


The Ethereum (EHT) price has declined since the cryptocurrency market crash in mid-August. The downward movement resulted in the loss of many important support levels, but the ETH price is currently trying to rebalance.
If the Ethereum price holds the key $1,630 area, a short-term bounce can complete a bearish retest of the $1,800 level. However, if the decline continues, the next important support is at $1,375.
Ethereum Price Loses Median of Parallel Channel
The weekly chart of Ethereum provides some bearish signals. First, the ETH price has been trading in an ascending parallel channel for over a year. Since then, the median of this channel has served as resistance and support (blue areas) several times.
However, sharp declines in the cryptocurrency market have recently led to the loss of this key support line. It is currently located near the $1,800 level. In case of a bounce, this area is now expected to act as resistance.
On the other hand, if the decline continues, the lower edge of the channel is located at the level of $1,375. This level is in confluence with the low generated at the beginning of March 2023. Therefore, support should be expected here.
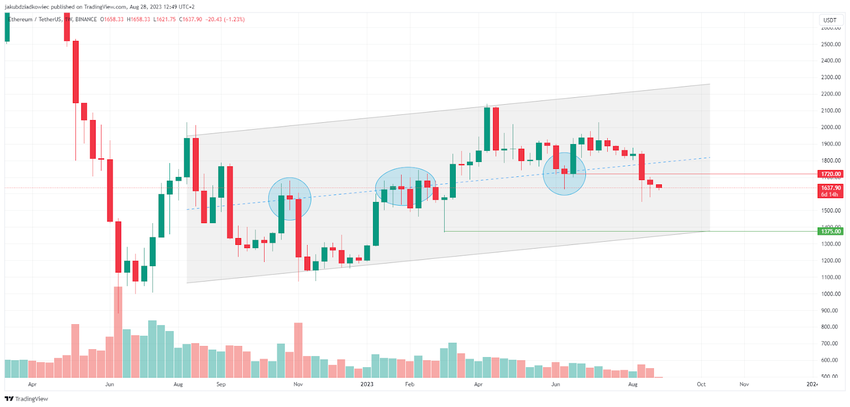
The bearish outlook is reinforced by the fact that the last two weekly closes were below the $1,720 level. This level was a higher low in June 2023 and coincided with the channel median.
The loss of this support caused the Ethereum price to generate a lower low on the weekly chart for the first time since the macro low of June 2022.
ETH Price Prediction: Hold Key Support
The daily chart confirms many of the readings from the weekly time frame. However, not all signals are bearish. First, the loss of an important diagonal support line (blue), which has been in place since November 2022, can also be seen here. The Ethereum price confirmed this line 4 times before finally breaking down from it on August 17.
Breaks from such long-term structures usually indicate a trend reversal. Here, the downward move suggests that a downtrend may have begun. However, unlike on the weekly chart, the lower low is not yet confirmed as long as the ETH price holds the support area around $1,630 (green).
Should the Ethereum price initiate a bounce here, the nearest resistance would be the $1,800 level, which is the inflection point and loss of the diagonal support line. Moreover, it is in confluence with the median of the rising parallel channel from the previous section.
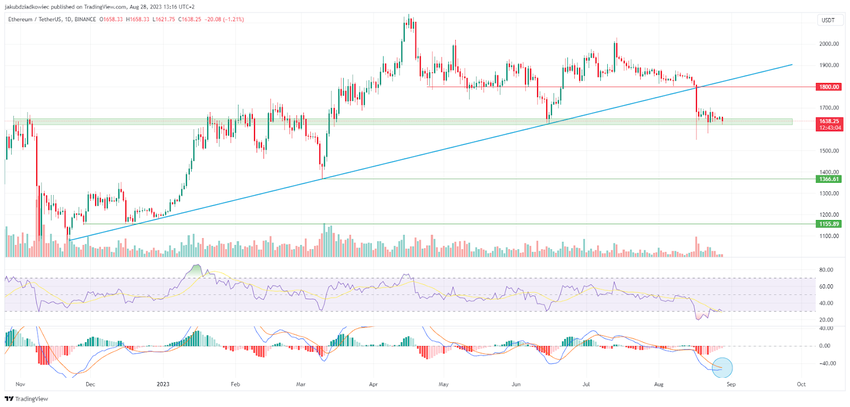
The daily technical indicators provide other slightly bullish signals. The RSI has already emerged from the overbought area (below 30) and is rising despite the price continuously declining. This suggests the potential for a bullish divergence and could lead to at least a short-term upward move.
Moreover, the MACD is close to a bullish crossing (blue circle), generating the first green momentum bar since August 15. If this happens, a move to resistance at $1,800 is possible.
However, further declines seem inevitable if the Ethereum price loses support at $1,630. Then, the nearest support area is only at $1,370, which is 16% below the current price.
If this support is lost as well, then a move all the way to the late 2022 bottom at $1,155 is possible. This would mean a drop of 30%.
For BeInCrypto’s latest crypto market analysis, click here.


