
A long-term resistance area rejected the Ethereum (ETH) price, which then broke down from a short-term pattern.
This could lead to more downside, in what could either be the final leg of the correction or the beginning of a new long-term downward movement.
Ethereum Price Creates Selling Pressure at Resistance
ETH is the native token of the Ethereum blockchain, which Vitalik Buterin created. The long-term outlook for ETH is leaning bearish, owing to the price action over the past month.
In April, ETH reached a new yearly high of $2,151. This seemingly caused a breakout above the $1,950 resistance area. However, a sharp fall ensued the next week, taking this price below this level.
This meant that the previous breakout was invalid. Rather, the ETH price deviated above the area before falling below it (red circle). This deviation is considered a bearish sign. It means that buyers were not able to sustain the breakout.
Rather, sellers took over, pushing the price down as a result. The price movement over the next two weeks supports this outlook since the ETH price created long upper wicks (red icons), also considered signs of selling pressure.
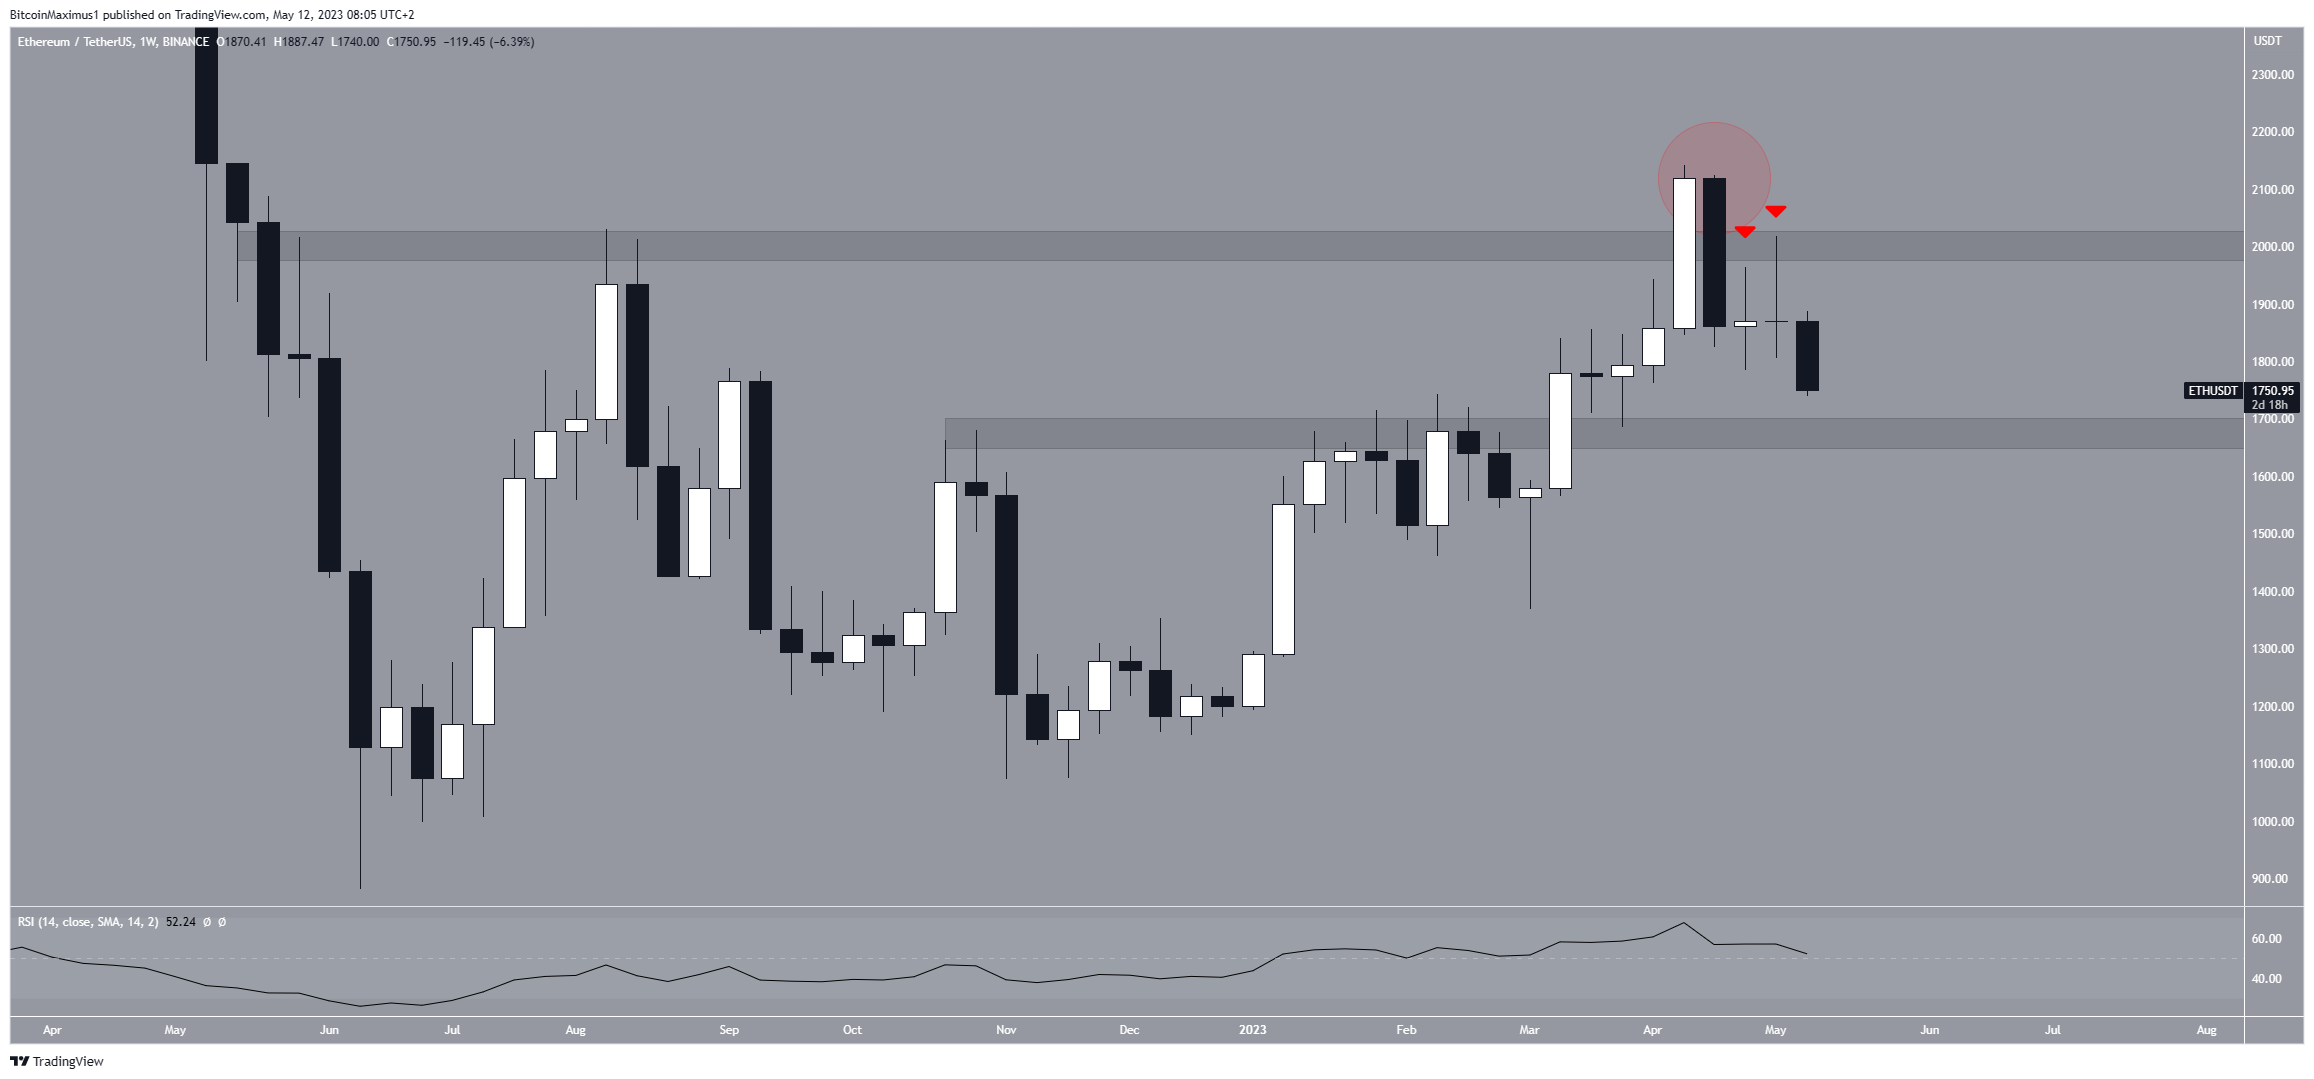
However, on the positive side, there are also indications of a bullish trend. The weekly Relative Strength Index (RSI) shows a bullish signal, with readings above 50 and an upward trend suggesting that bulls are in control.
However, the price decrease of Ethereum has caused it to fall below the $1,900 horizontal area, which was previously validated as resistance (red icon).
As a result, the previous breakout is now considered a deviation (red circle), which is viewed as a bearish signal that can lead to downward movements.
The closest support area is at $1,670, while the next resistance is at $2,530.
Ethereum (ETH) Price Prediction: More Downside Likely?
A closer look at the technical analysis from the six-hour time frame supports the possibility of more downside. There are two main reasons for this.
Firstly, the price broke down from an ascending parallel channel. These channels are considered bearish patterns, meaning that they lead to breakdowns most of the time.
Next, the wave count suggests that the price could be in an A-B-C corrective structure (white). If so, the price has completed the B wave and is now in the C wave. This was confirmed by the breakdown from the short-term channel.
There is a confluence of Fib support targets at an average price of $1,660. The support is created by giving waves A:C a 1:1 ratio (white) and by the 0.618 Fib retracement support level of the entire previous upward movement (black).
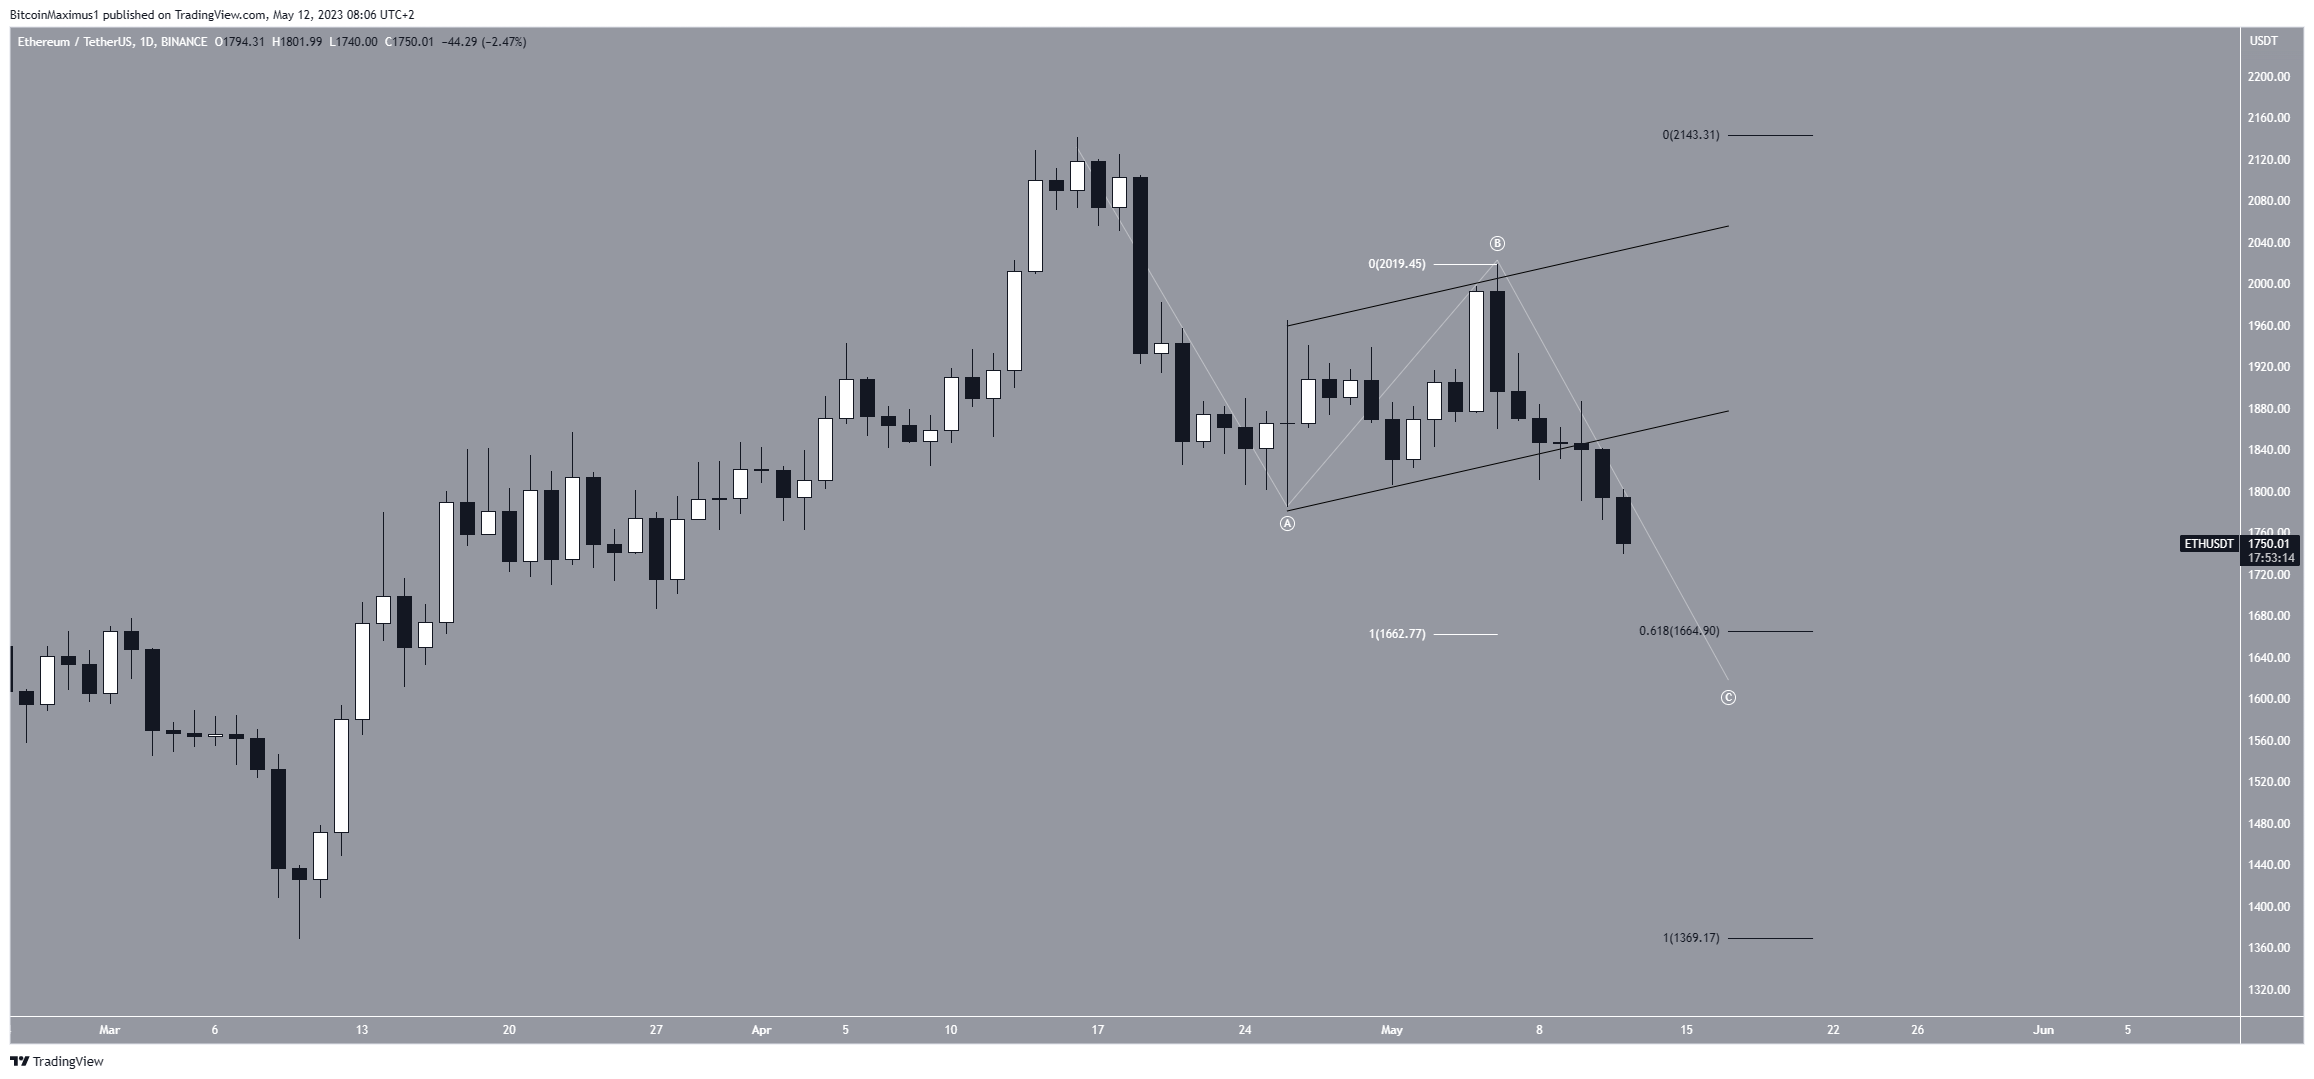
However, if the ETH price moves above the previous channel’s support line, it will invalidate this bearish Ethereum price forecast and indicate that more upside is likely.
In that case, the ETH price could move towards its long-term resistance at $1,950.
For BeInCrypto’s latest crypto market analysis, click here.
