


On July 17, 2019, the Ethereum (ETH) price reached a high of $223. A rapid decrease ensued. The price reached a low of $202 the same day. Since then, it has been increasing. However, it has failed to reach highs above $214.
Will ETH again reach highs above $220? In order to answer this question, we will analyze the Ethereum price in different time-frames alongside technical indicators.
For our previous analysis, click here.
If you are interested in trading Ethereum (ETH) with a multiplier of up to 100x on our new partner exchange with the lowest fees, follow this link to get a free StormGain account!
https://www.youtube.com/watch?v=o8d_Gt13XXM
Ethereum Price: Trends and Highlights for July 31
- ETH/USD is trading inside a symmetrical triangle.
- It faces short-term resistance at $215.
- It is following a long-term ascending support line.
- There is a resistance area at $230.
Current Pattern
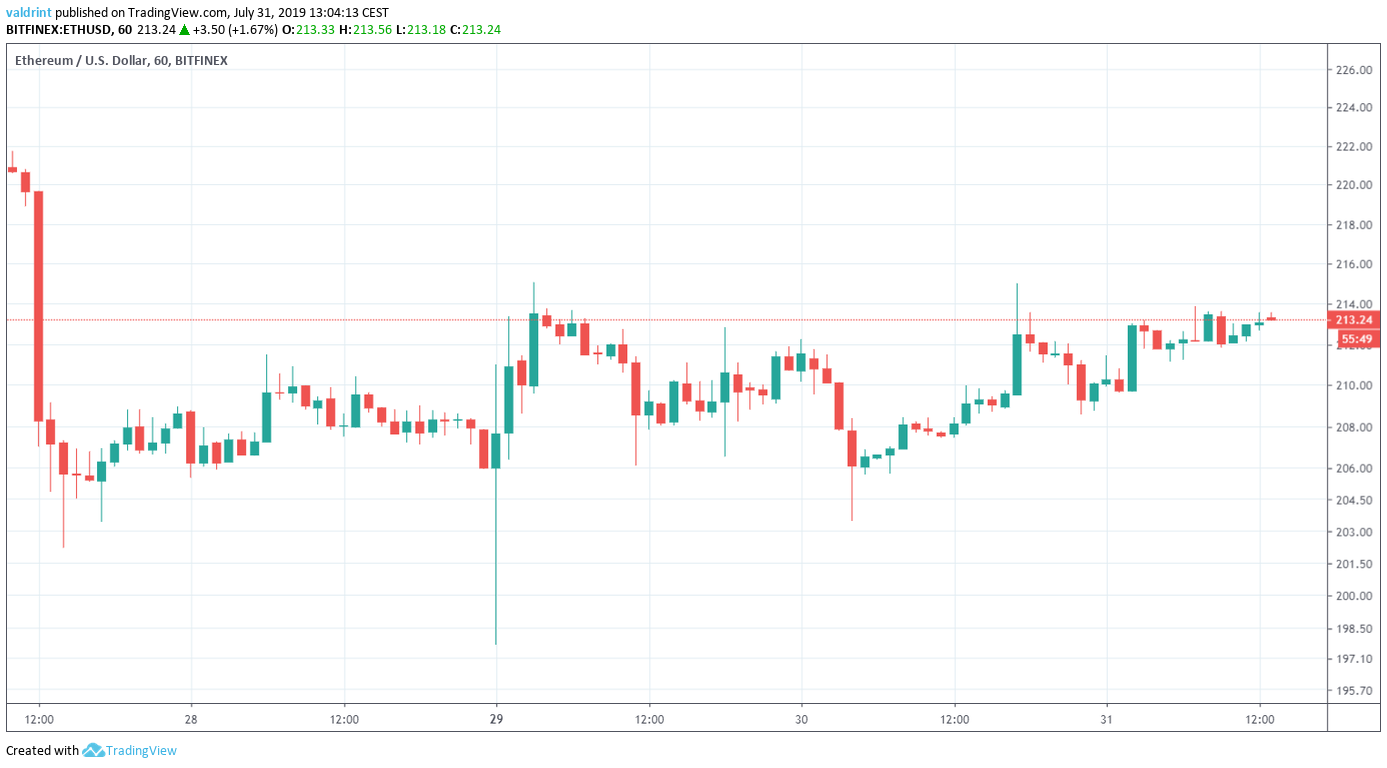
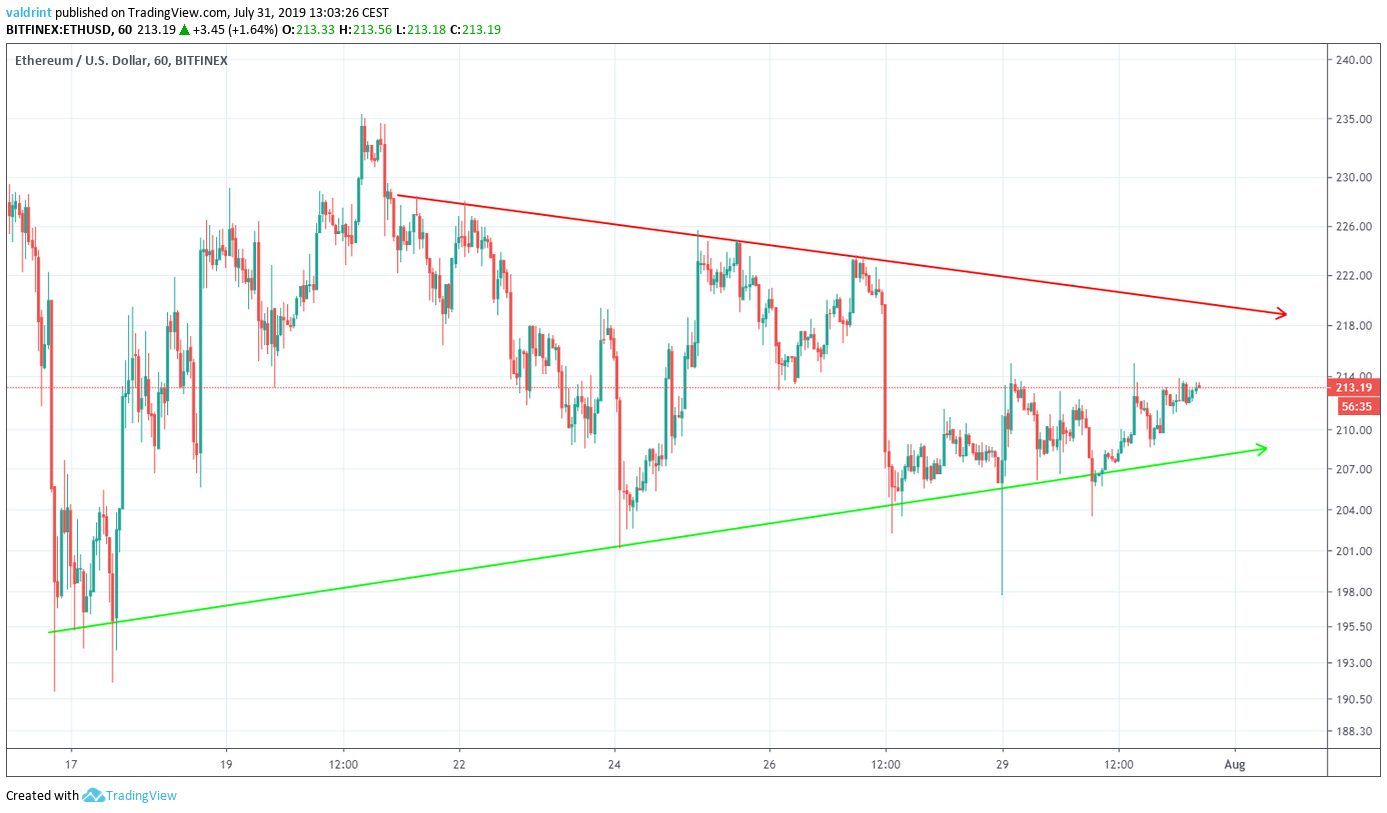
A look at the hourly time-frame shows that the ETH price has been trading inside the symmetrical triangle outlined below.
At the time of writing, it was trading in the middle of the triangle.
A closer look at the Ethereum price shows that it has found resistance at $215.
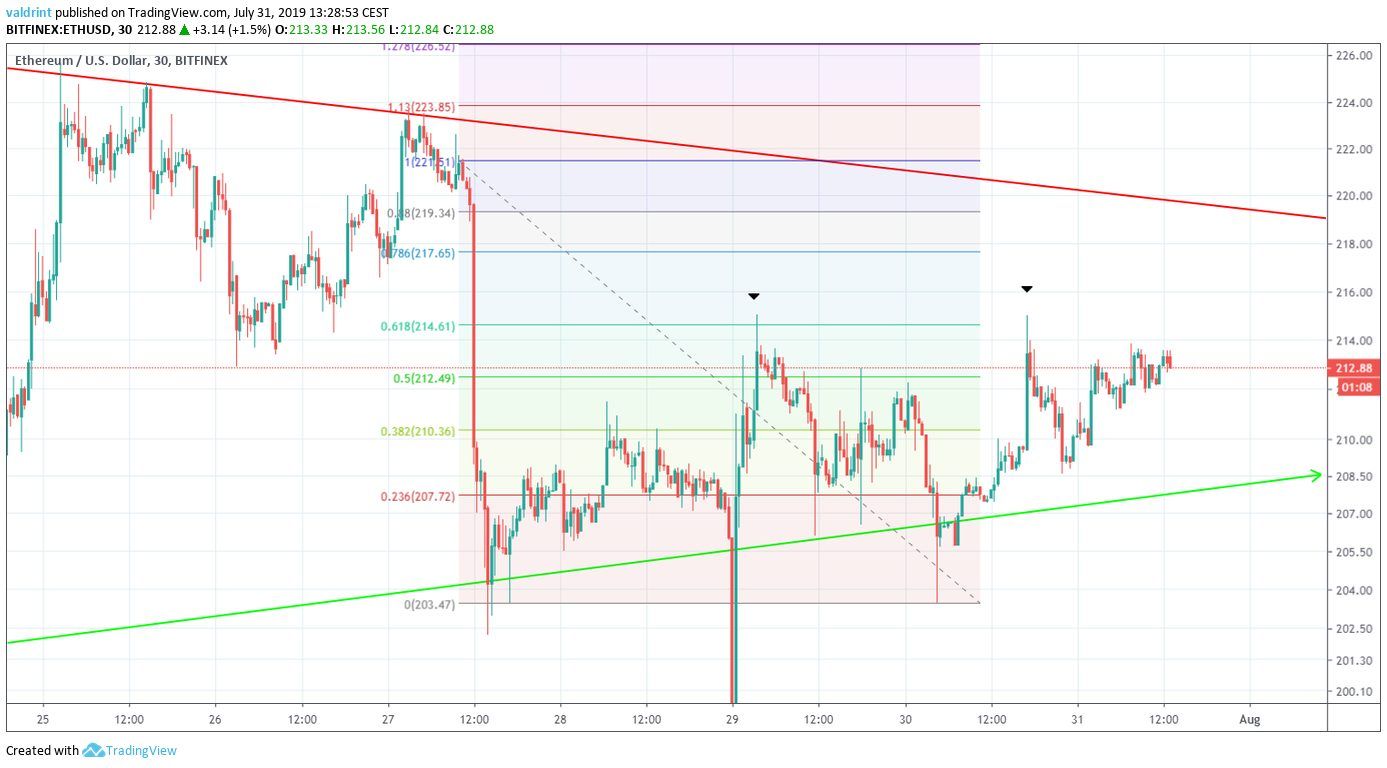
The resistance is provided by the 0.618 fib level measuring from the beginning of the drop.
ETH made two unsuccessful attempts at breaking out, on July 29 and 30 respectively.
A look at the RSI shows signs of weakness.
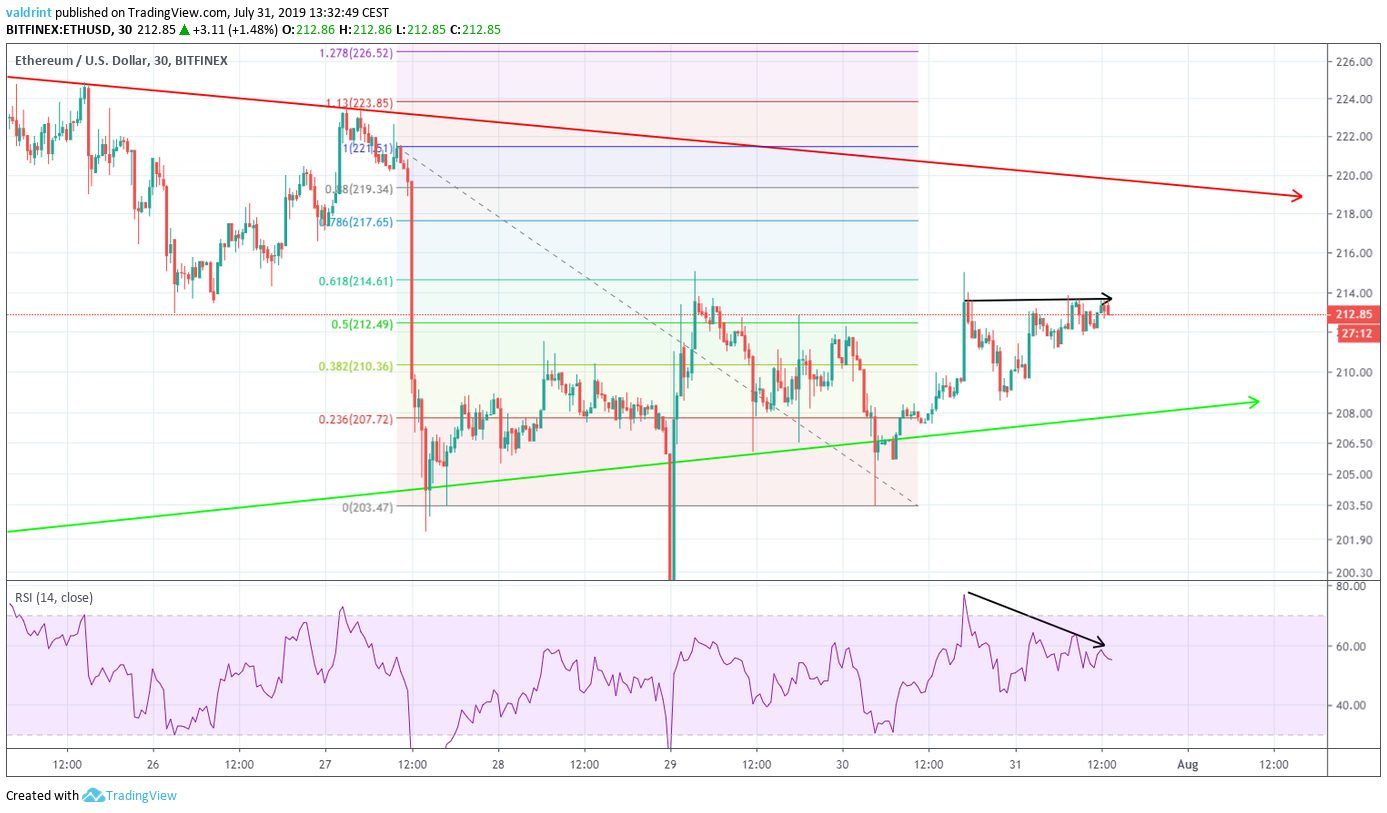
It has generated bearish divergence during the three price highs near $214.
This makes us believe that the price will decrease towards the support line at $208.
However, this is only a short-term movement.
Let’s take a look at a longer-term time-frame to see if the ETH price will break out or down from the triangle.
Long-Term Support
A look at the daily time-frame shows that ETH has been following an ascending support line since.
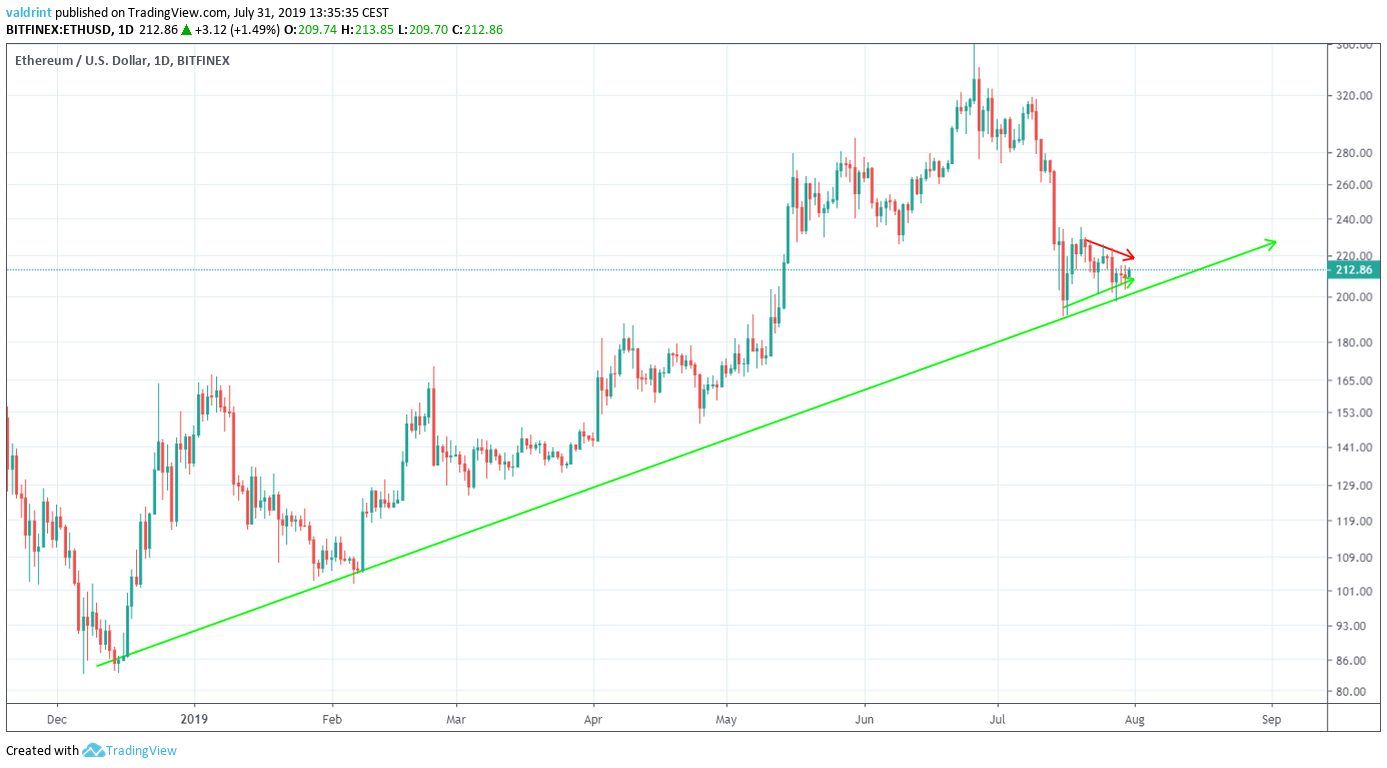
The support line of the triangle coincides with this long-term support.
Therefore, a breakdown from the triangle would most likely indicate a breakdown from the long-term support line.
This makes a breakdown slightly less likely.
A look at the daily moving averages does not provide a definite answer.
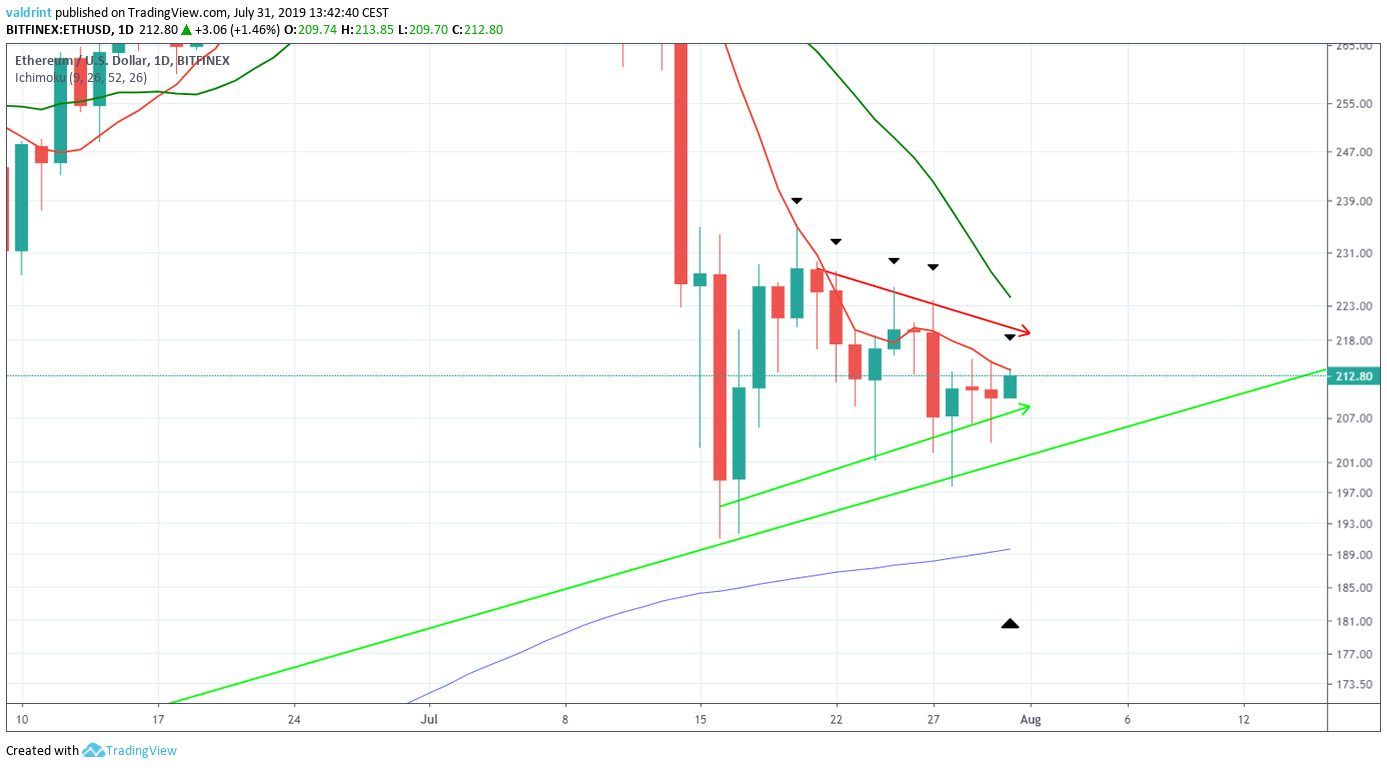
The price is trading below the 10- and 20-day moving averages.
Furthermore, it has continuously made unsuccessful attempts at a breakout since July 20.
The ETH price is currently in the process of making another attempt.
On a more bullish note, ETH is trading above the 200-period MA.
The use of these indicators and previous price movement does not allow us to confidently predict a breakout or breakdown.
Rather, we believe the price will consolidate without experiencing significant fluctuations.
Ethereum Price Future Movement
An outline of possible price movements is presented below.
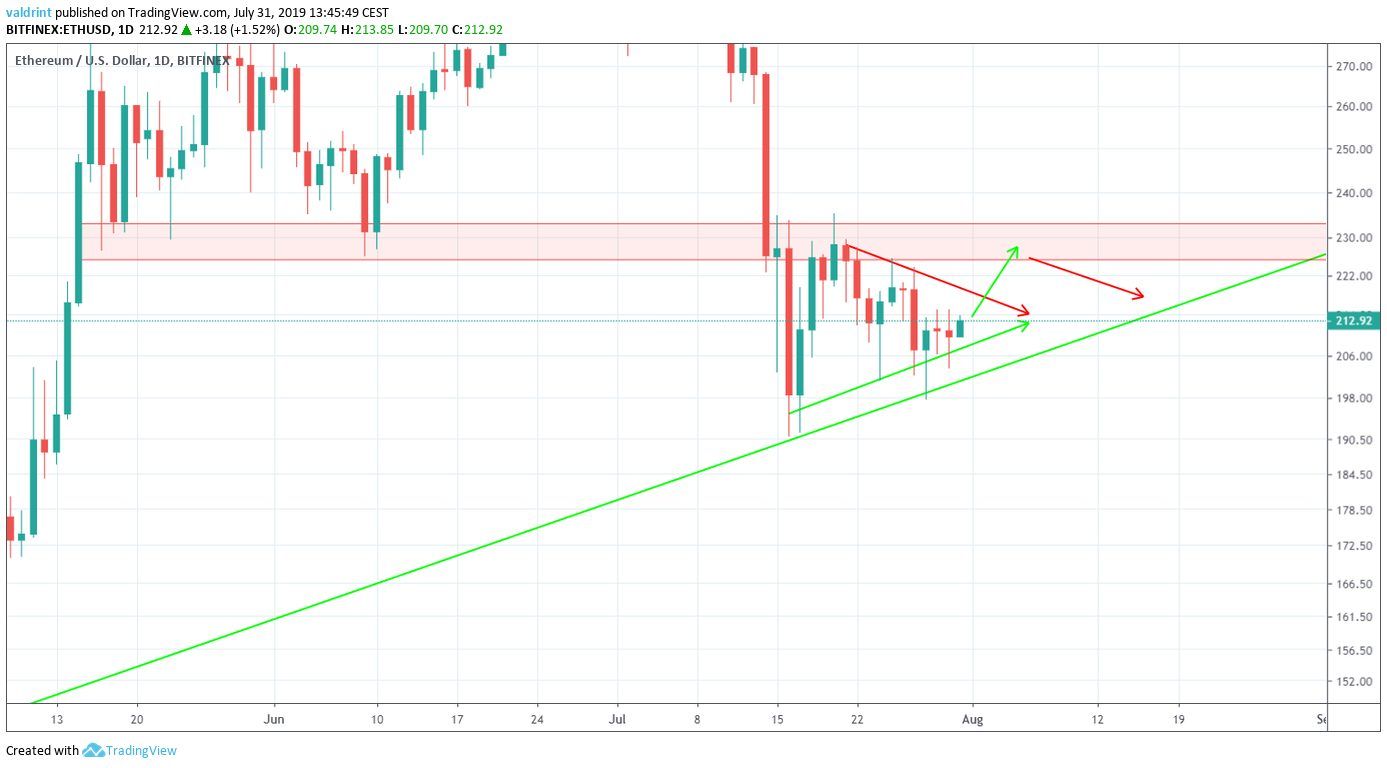
ETH is likely to break out from the triangle and reach the resistance area at $230.
Afterward, we believe it will decrease and trade close to the ascending support line.
Summary
Ethereum has been trading inside a symmetrical triangle.
According to our analysis, it is likely to break out an reach the resistance area outlined above.
Do you think Ethereum will break out from the triangle? Let us know in the comments below.
Disclaimer: This article is not trading advice and should not be construed as such. Always consult a trained financial professional before investing in cryptocurrencies, as the market is particularly volatile.
Images are courtesy of TradingView and Shutterstock.


