


On July 30, 2019, the Ethereum price reached a low of $203. A gradual upward move ensued. On August 5, ETH reached a high of $236. On August 6, it increased to $240, before decreasing back to $230 in a matter of minutes.
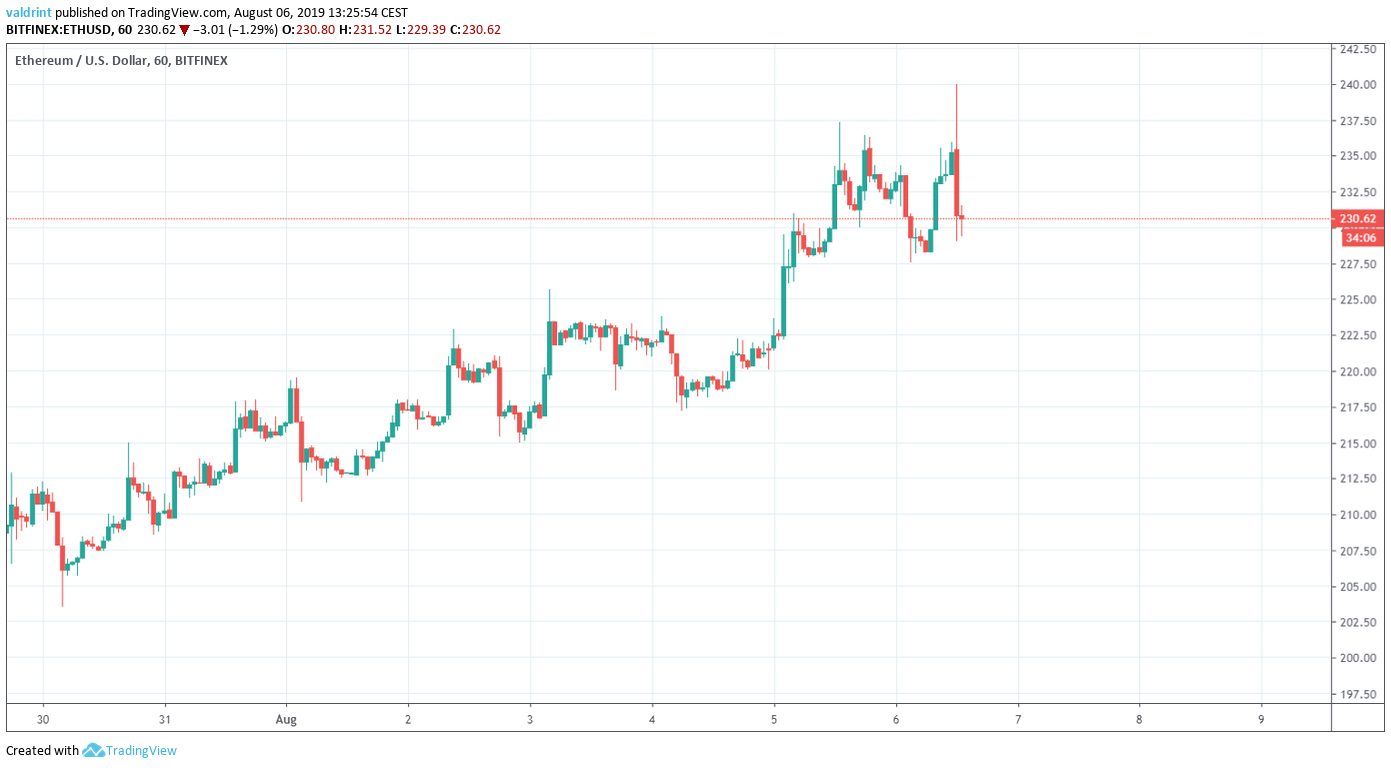
Will Ethereum continue to increase or was this the beginning of a reversal? Keep reading below if you want to find out.
For our previous analysis, click here.

Ethereum Price: Trends and Highlights for August 6
- ETH/USD is trading inside an ascending triangle.
- Short-term bearish divergence is present in the RSI.
- It made a failed attempt at a breakout.
- The ensuing decrease transpired with significant volume.
Current Pattern
A look at the two-hour chart shows that the Ethereum price has been trading inside an ascending triangle since July 15.
The ascending triangle is considered a bullish pattern, making price breakouts more likely.
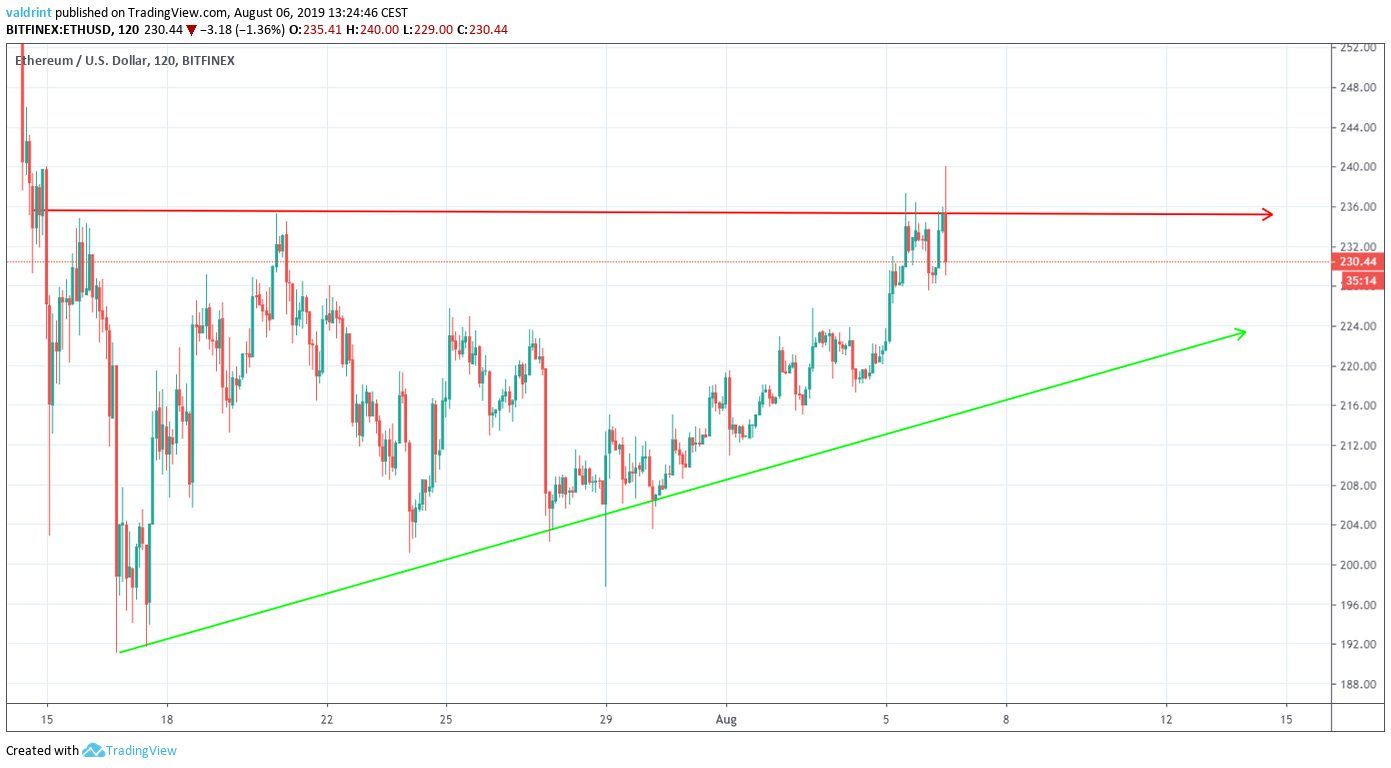
At the time of writing, it was trading right on the resistance line of the triangle.
Even though the price technically broke out for a short period of time, it immediately decreased to fall back inside the triangle.
Therefore, the breakout is considered insignificant.
Where will ETH go to next?
Trade Ethereum on the world’s largest cryptocurrency exchange by volume, Binance. Create a free account today.
Beginning Of a Reversal?
A look at the RSI shows that the current decrease was preceded by bearish divergence.
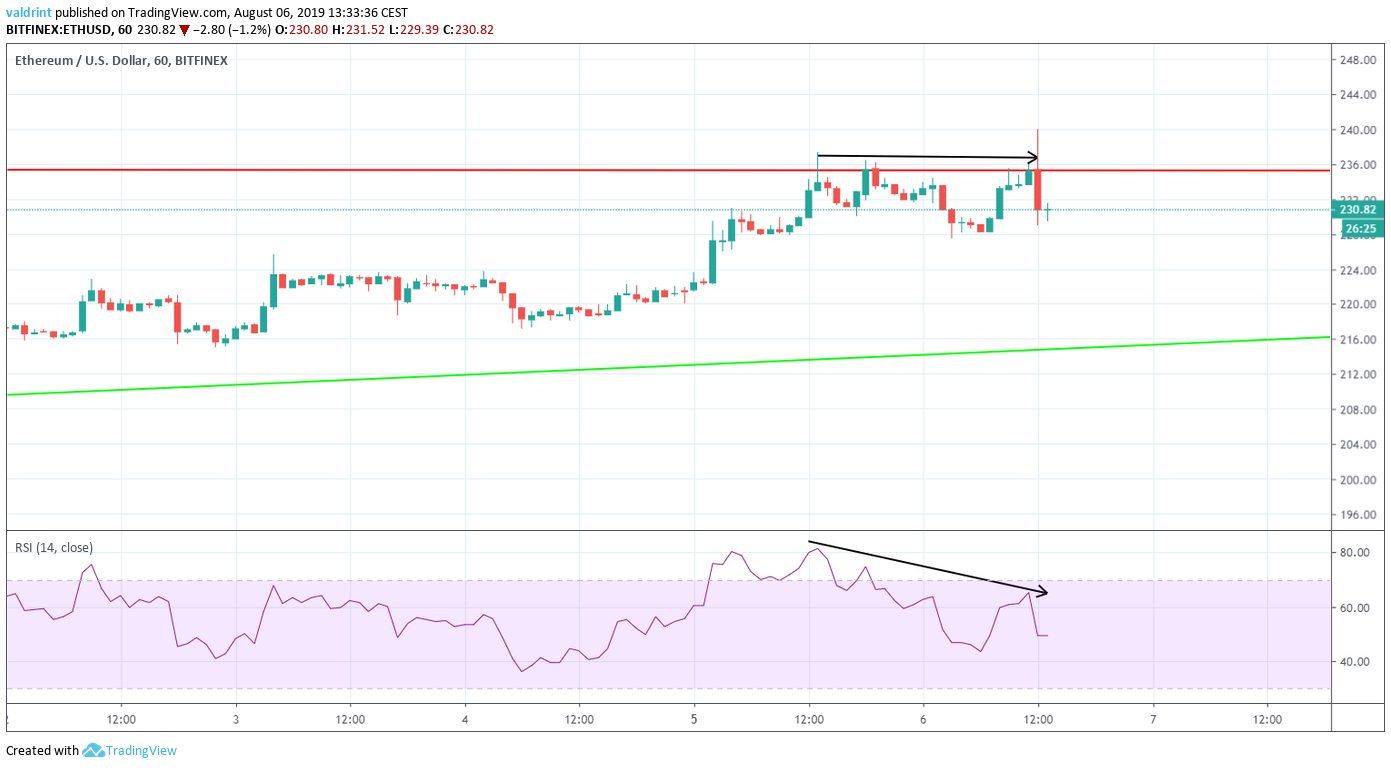
While the price has been making highs near $236 since August 5, the RSI has been generating successively lower values.
A closer look at the price movement shows several characteristics of a fake breakout.
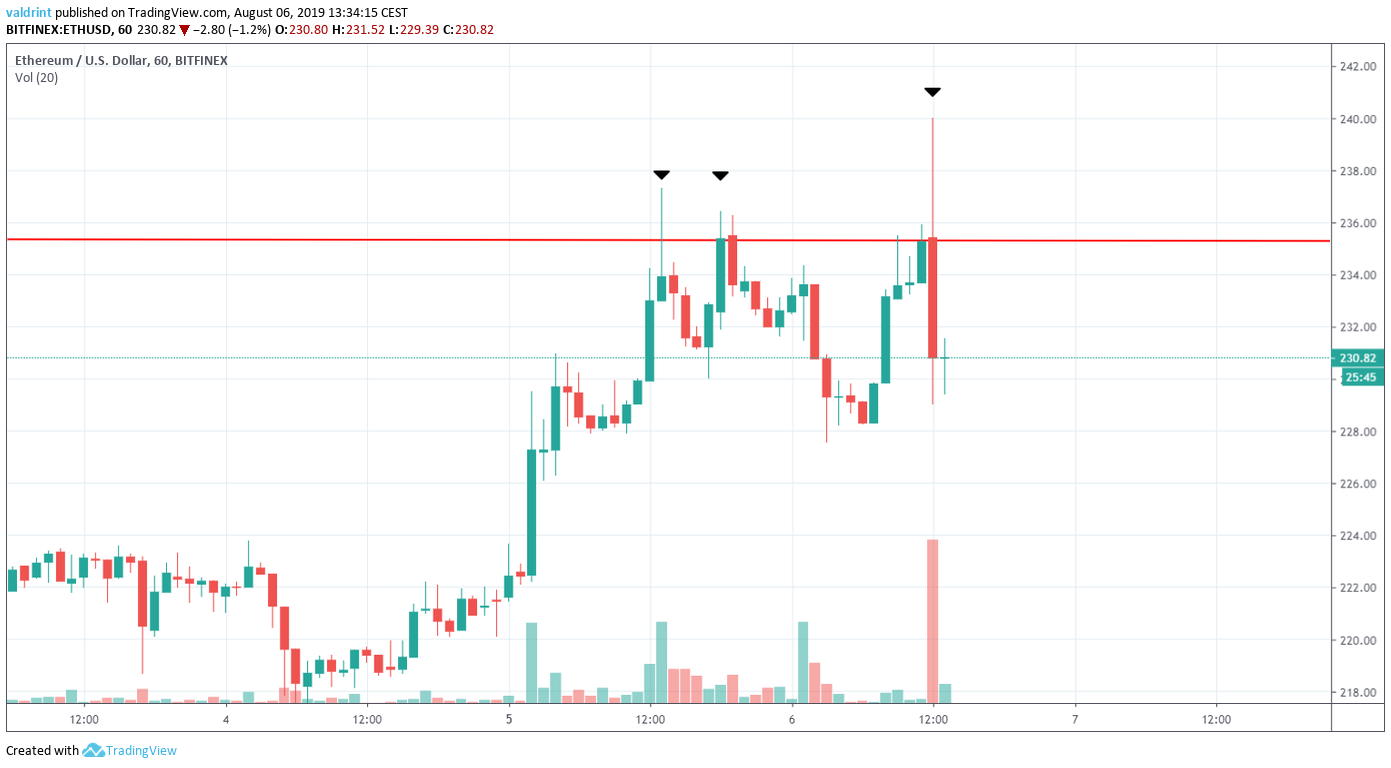
The first two arrows indicate that the price is forming a resistance area near $236.
The next day, the Ethereum price again met resistance at $236. However, a breakout ensued, and the price reached values of $240 before immediately decreasing.
The closing price for the hour was $230.
Additionally, there was massive volume during that one-hour candle.
Examining the presence of a bearish divergence near resistance areas such as this can be effective in identifying possible causes of a fake breakout.
The use of these indicators and previous price movement makes us believe that ETH will decrease towards the support line of the triangle.
Buy and trade Ethereum and other assets with a 100x multiplier on our partner exchange, StormGain.
Ethereum Price Summary
The Ethereum price is trading inside an ascending triangle.
According to our analysis, it is likely to drop towards the support line of the triangle.
Do you think ETH will drop to the support line? Let us know in the comments below.
Disclaimer: This article is not trading advice and should not be construed as such. Always consult a trained financial professional before investing in cryptocurrencies, as the market is particularly volatile.
Images are courtesy of TradingView and Shutterstock.


