
The price of Ethereum has been gradually increasing since June 20, 2019. The increase intensified on June 26 and the ETH price briefly reached highs above $360.

A flash crash ensued and the Ethereum price made lows near $300 the next day.
Where will the price go next? Keep reading below in order to find out.
Click here to read our previous analysis.
Ethereum Price: Trends and Highlights for June 27
- The ETH price began a rapid decrease on June 26.
- It failed to break out above the 0.236 fib level or the 100-week moving average.
- It is possibly creating an evening star pattern.
- It is following a short-term horizontal support line.
- There is bearish divergence developing in the RSI and the MACD.
ETH Price in a Horizontal Channel
Since June 22, the Ethereum price has been trading inside a horizontal channel.
The increase on June 26 caused it to break out of the resistance line.
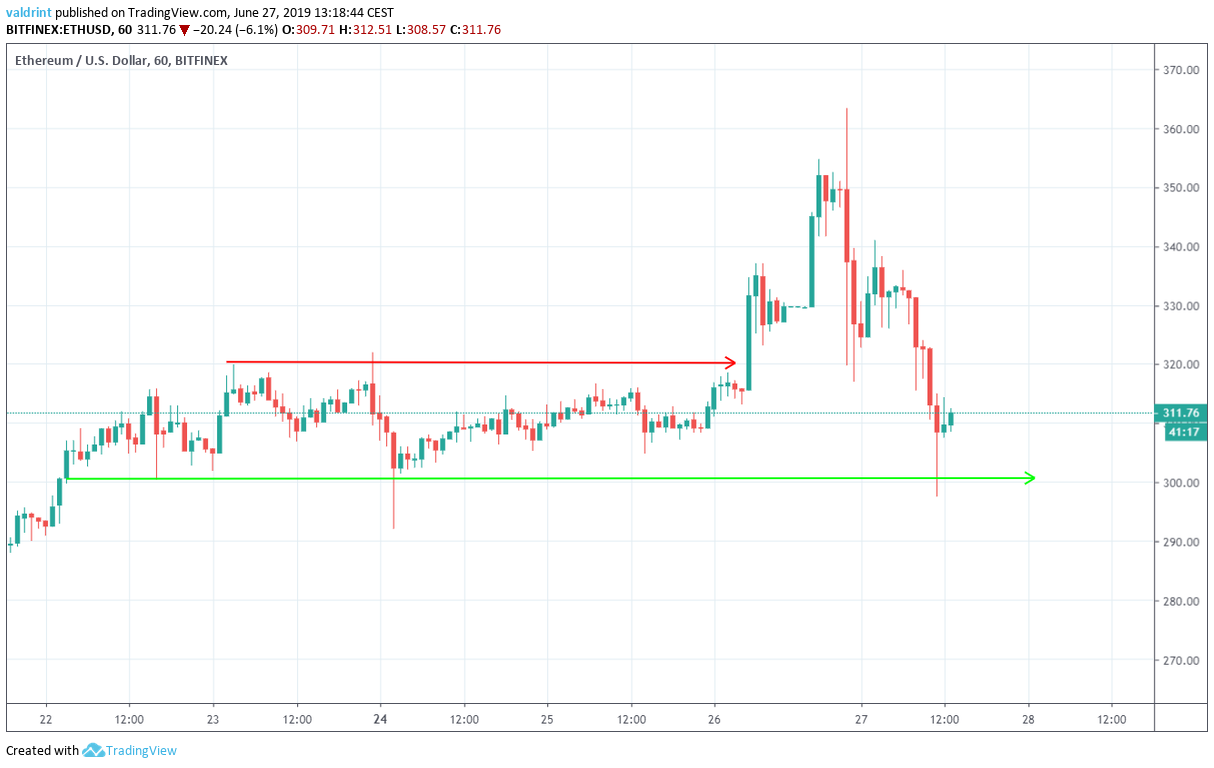
The ensuing decrease, however, caused the price to drop and once more validate the support line.
Therefore, while the resistance line has been broken, the support line is still intact.
Possible Evening Star for the Ethereum Price
Since reaching a low of $83 in December 2018, the ETH price has been slowly increasing.
However, it has yet to retrace past the 0.236 fib level of the entire drop, which is at $380.
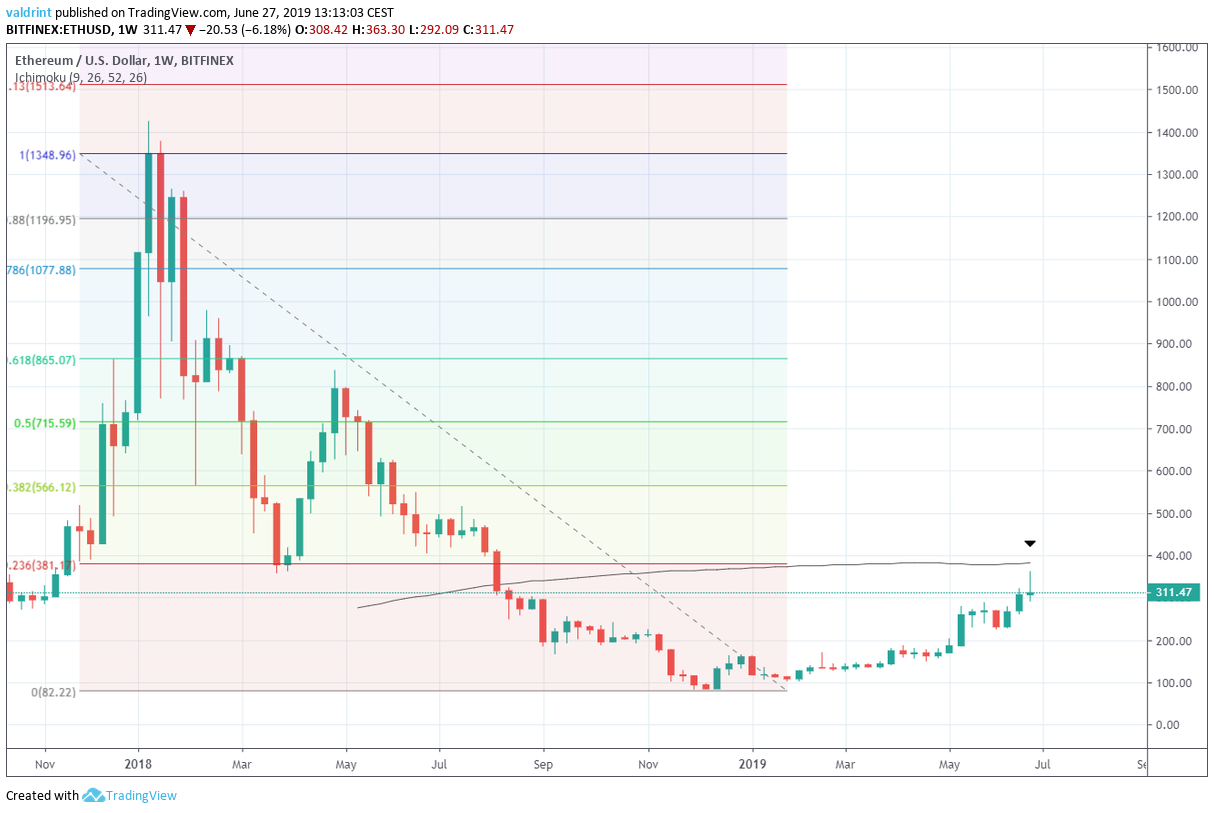
This level also coincides with the 100-week moving average (MA).
Price briefly reached this level on June 26, before a swift reversal ensued.
With a closer look, it seems as if the ETH price is creating a bearish evening star pattern.
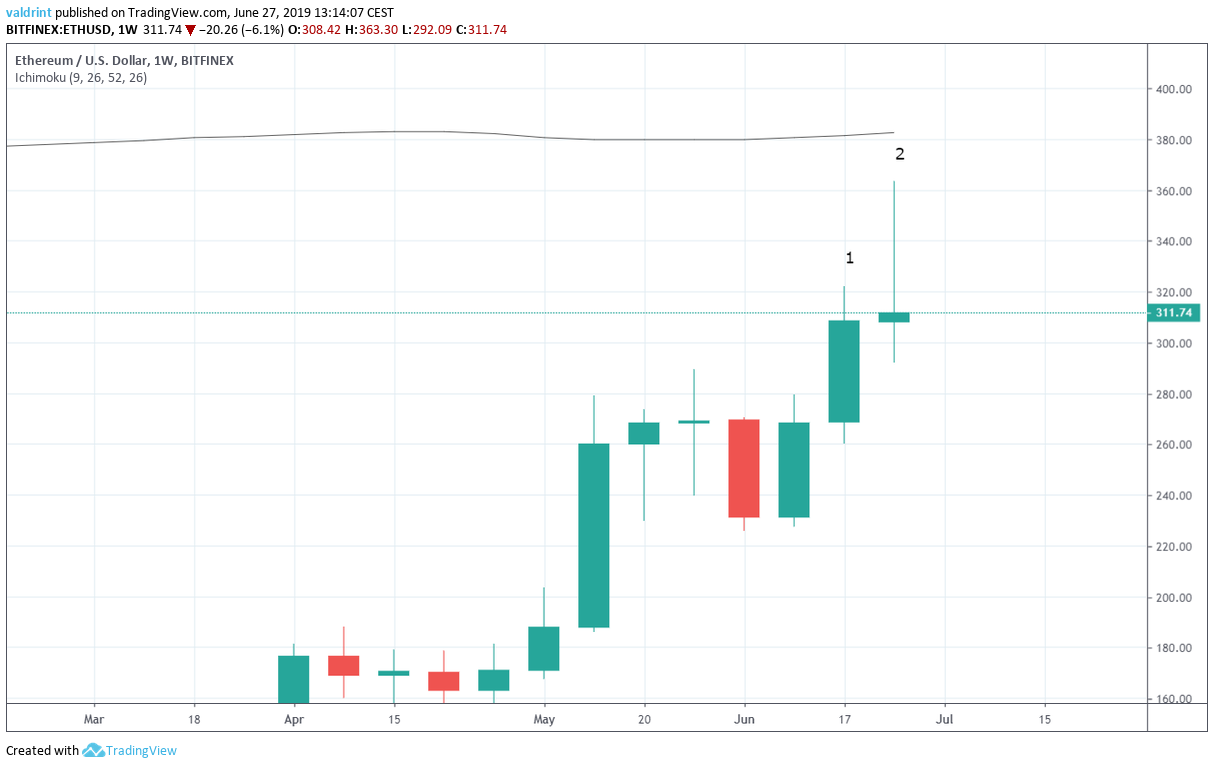
The candlestick for the week of June 17-24 was bullish. The current weekly candle is shaping to be a doji — either positive or negative. If next week’s candle is bearish engulfing, with a close below $260, it will complete the evening star reversal pattern.
Let’s take a look at some technical indicators and assess this possibility.
Possible Reversal
On May 16, the price reached a high of $279 — which was combined with a high in both the RSI and the MACD.
However, while the Ethereum price has continued to increase, both the RSI and the MACD have generated lower values.

This is known as bearish divergence and often precedes price decreases.
While it is not very significant in value, it is occurring in both indicators and near a very significant resistance area.

To the contrary, they made a bullish cross on June 17, and have provided support to the price during the recent decrease.
However, the divergence is used to predict possible tops before they occur. Conversely, the moving averages are a lagging indicator. As a result, a reversal would already have to be underway for the MAs to turn bearish.
Price movement below the MAs and a possible bearish cross would provide confirmation that a reversal has begun.
Summary
Even with the recent increases, the ETH price has failed to break out past the 0.236 level of the drop or the 100-week moving average.
The recent price decrease may have possibly initiated the creation of an evening star pattern.
While momentum indicators support this possibility, the daily moving averages have yet to turn bearish.
What do you think about the Ethereum price? Let us know your thoughts in the comments below.
Disclaimer: This article is not trading advice and should not be construed as such. Always consult a trained financial professional before investing in cryptocurrencies, as the market is particularly volatile.
Images are courtesy of TradingView.
