


On July 26, 2019, the Ethereum price reached a high of ₿0.022. A downtrend began. On August 6, ETH made an unsuccessful attempt at a reversal. Afterward, it continued its downward movement, reaching a low of ₿0.0161 on September 6.
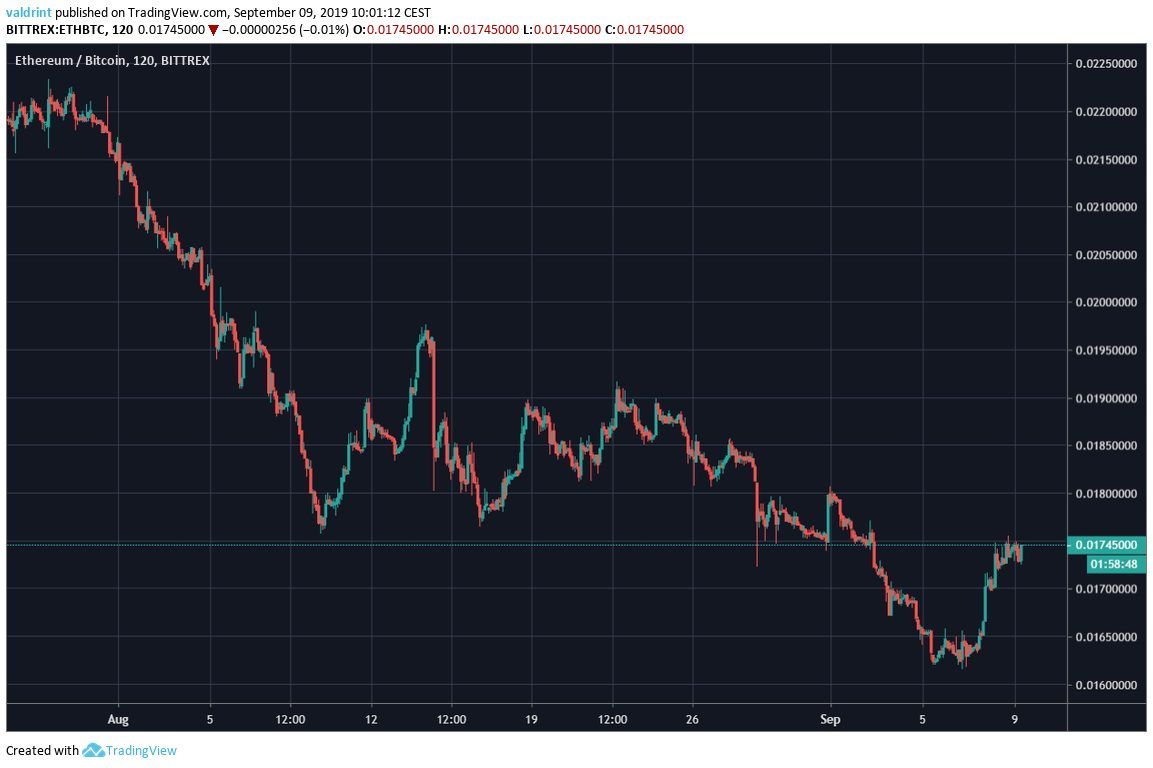
At the time of writing, it was trading at ₿0.0175.
Will Ethereum increase above ₿0.02? Let’s find out.
For our previous analysis, click here.
Ethereum Price: Trends and Highlights for September 9
- ETH/BTC is trading inside a descending wedge.
- There is support at ₿0.012.
- The 10- and 20-day moving averages are close to making a bullish cross.
- Bullish divergence has developed in the RSI & MACD.
- The closest resistance area is found at ₿0.019.
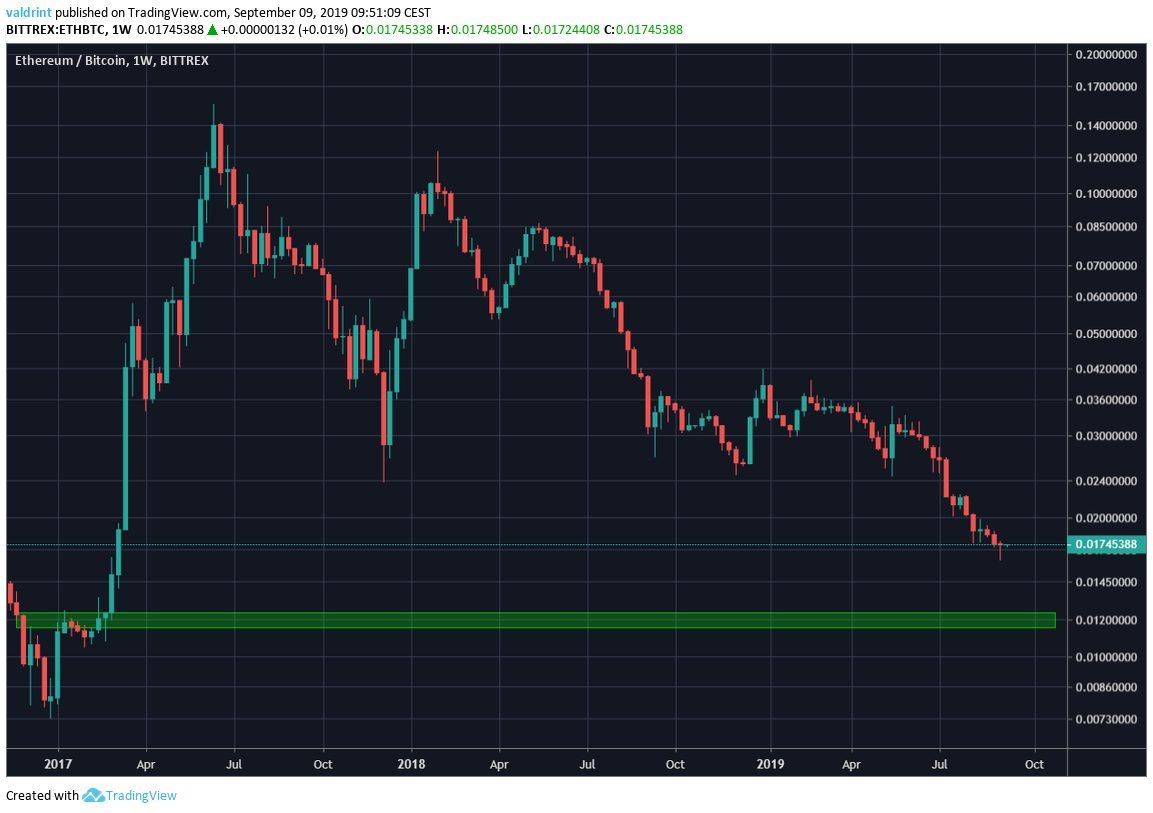
Long-Term Support
A look at the weekly chart shows that Ethereum has been decreasing since June of 2017.
The logarithmic chart is used to better visualize large price fluctuations.
Additionally, we can see one support area at ₿0.012.
Descending Wedge
Taking a closer look at price movement we can see that ETH has been trading inside a descending wedge since September 2018.
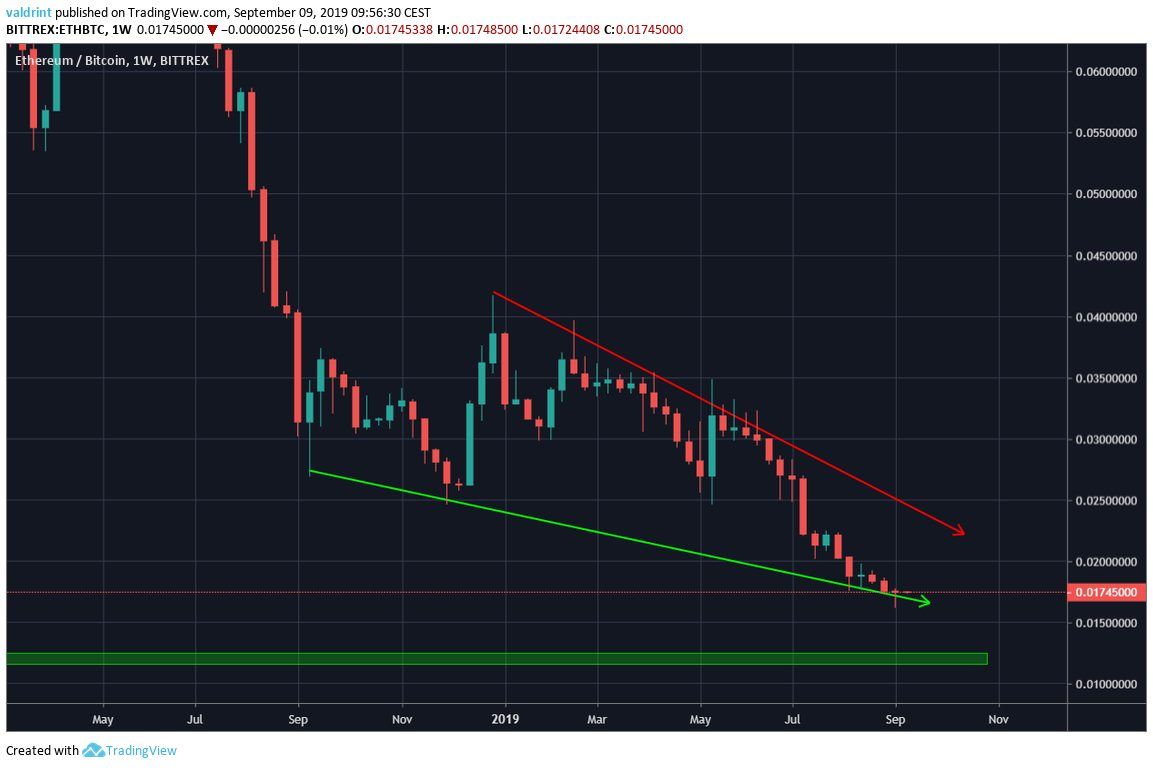
The descending wedge is considered a bullish pattern, making a price breakout more likely.
Currently, the price is trading right on the support line of the wedge.
Will it move towards resistance?
Ethereum Price Possible Reversal
In order to determine if a reversal is likely, we have incorporated the RSI & MACD into the analysis.
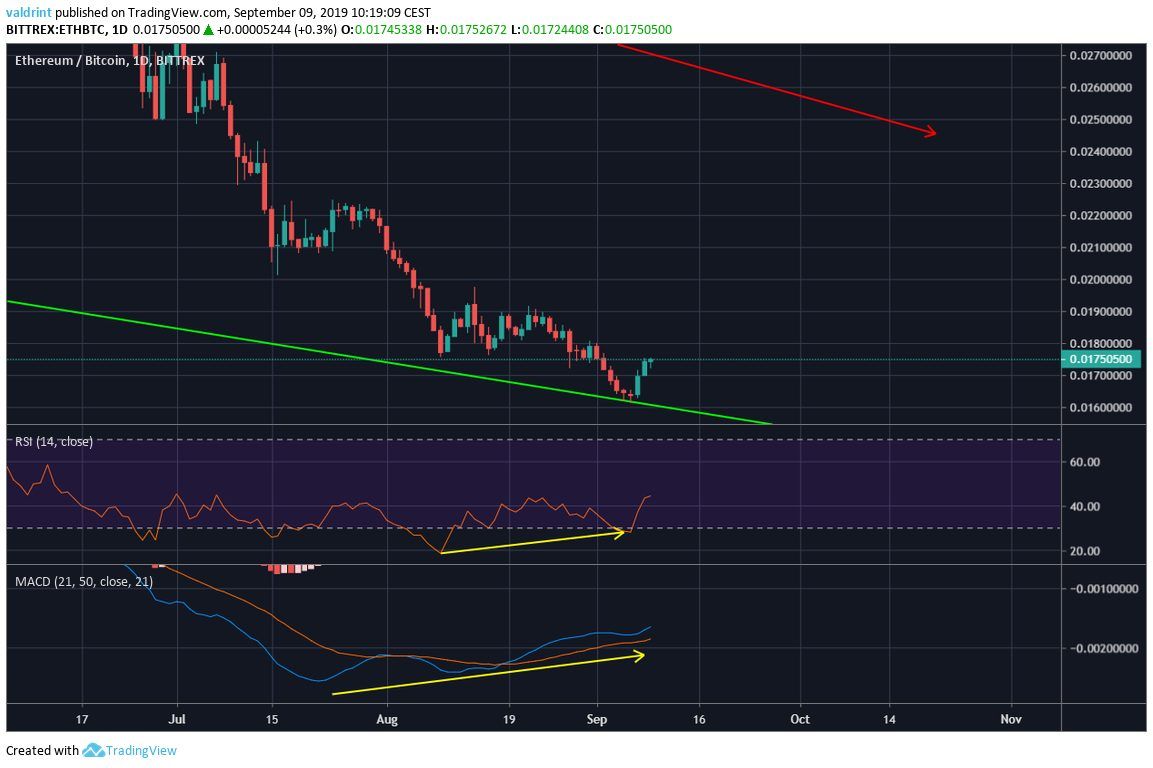
During the most recent lower lows on August 12 and September 5, both the RSI & MACD have generated higher lows.
This is known as bullish divergence and often indicates that an upward move will begin.
The divergence is more pronounced in the MACD.
A look at the daily moving averages (MA) indicates that the reversal might be very close.
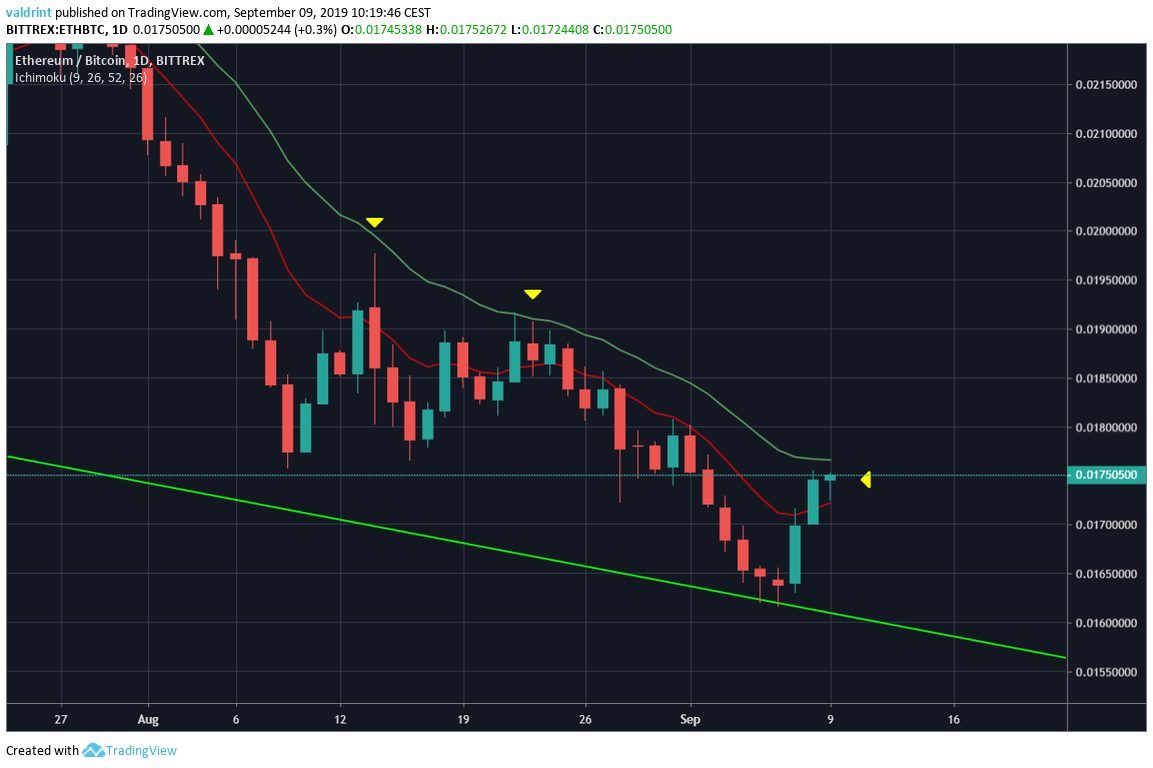
ETH has moved above its 10-day MA and is currently at the 20-day one.
Previously, it made two unsuccessful attempts at moving above it.
If it does so, it could indicate that the uptrend has already begun.
This hypothesis would be strengthened by a bullish cross between the aforementioned MAs.
Future Movement
If Ethereum continues its upward movement, one resistance area is outlined below:
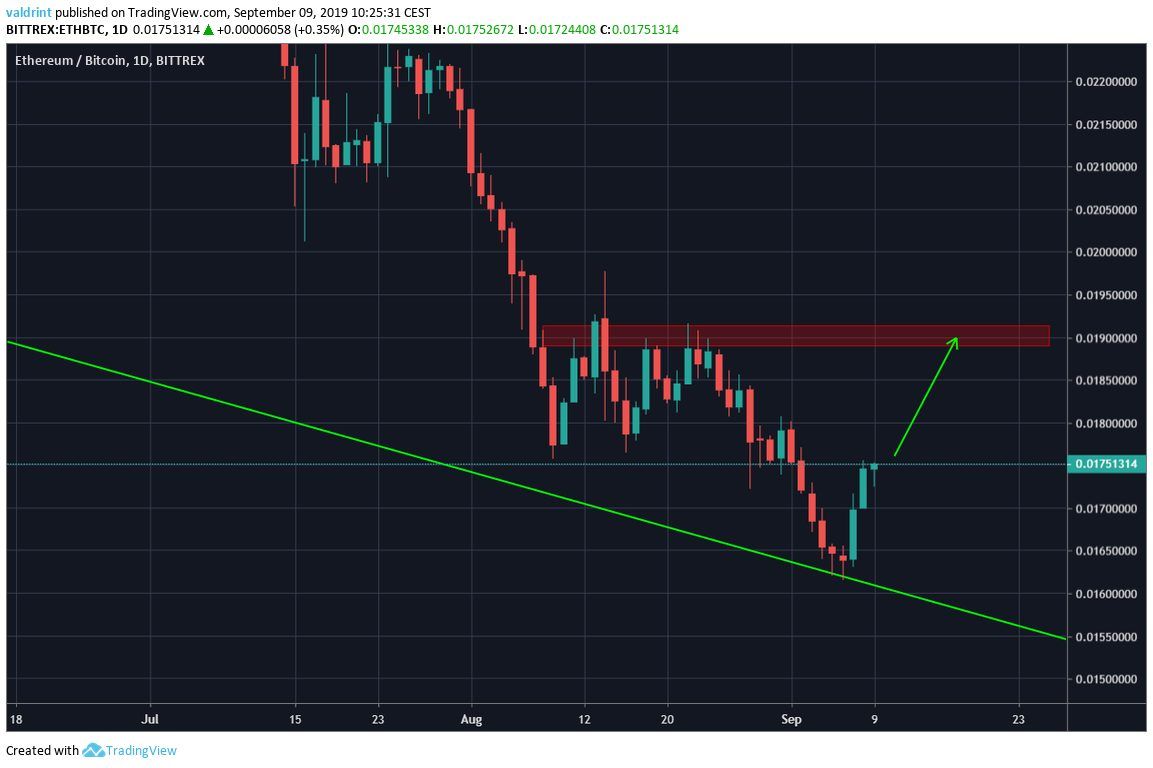
It is found at ₿0.019.
According to our analysis, ETH is likely to reach it.
Ethereum Price Summary
The Ethereum price is trading inside a descending wedge.
According to our analysis, it is likely to move towards the resistance line of the wedge.
Before it gets there, it should meet resistance at ₿0.019.
For trading purposes, we consider ETH a buy for medium-term time-frames.
Do you think Ethereum will reach the resistance area? Let us know in the comments below.

Disclaimer: This article is not trading advice and should not be construed as such. Always consult a trained financial professional before investing in cryptocurrencies, as the market is particularly volatile.
Images are courtesy of Shutterstock, TradingView.


