
Ethereum price has dropped more than 6% in the past 24 hours and is now down about 27% over the last 30 days. A breakdown from a major continuation pattern has opened the door to a much deeper decline. At the same time, an on-chain signal is flashing a possible 28% downside window that aligns with what could become Ethereum’s next cycle bottom if conditions worsen.
Together, these signals show that ETH may not be done correcting yet.
One Long-Term Metric Shows Room to Fall?
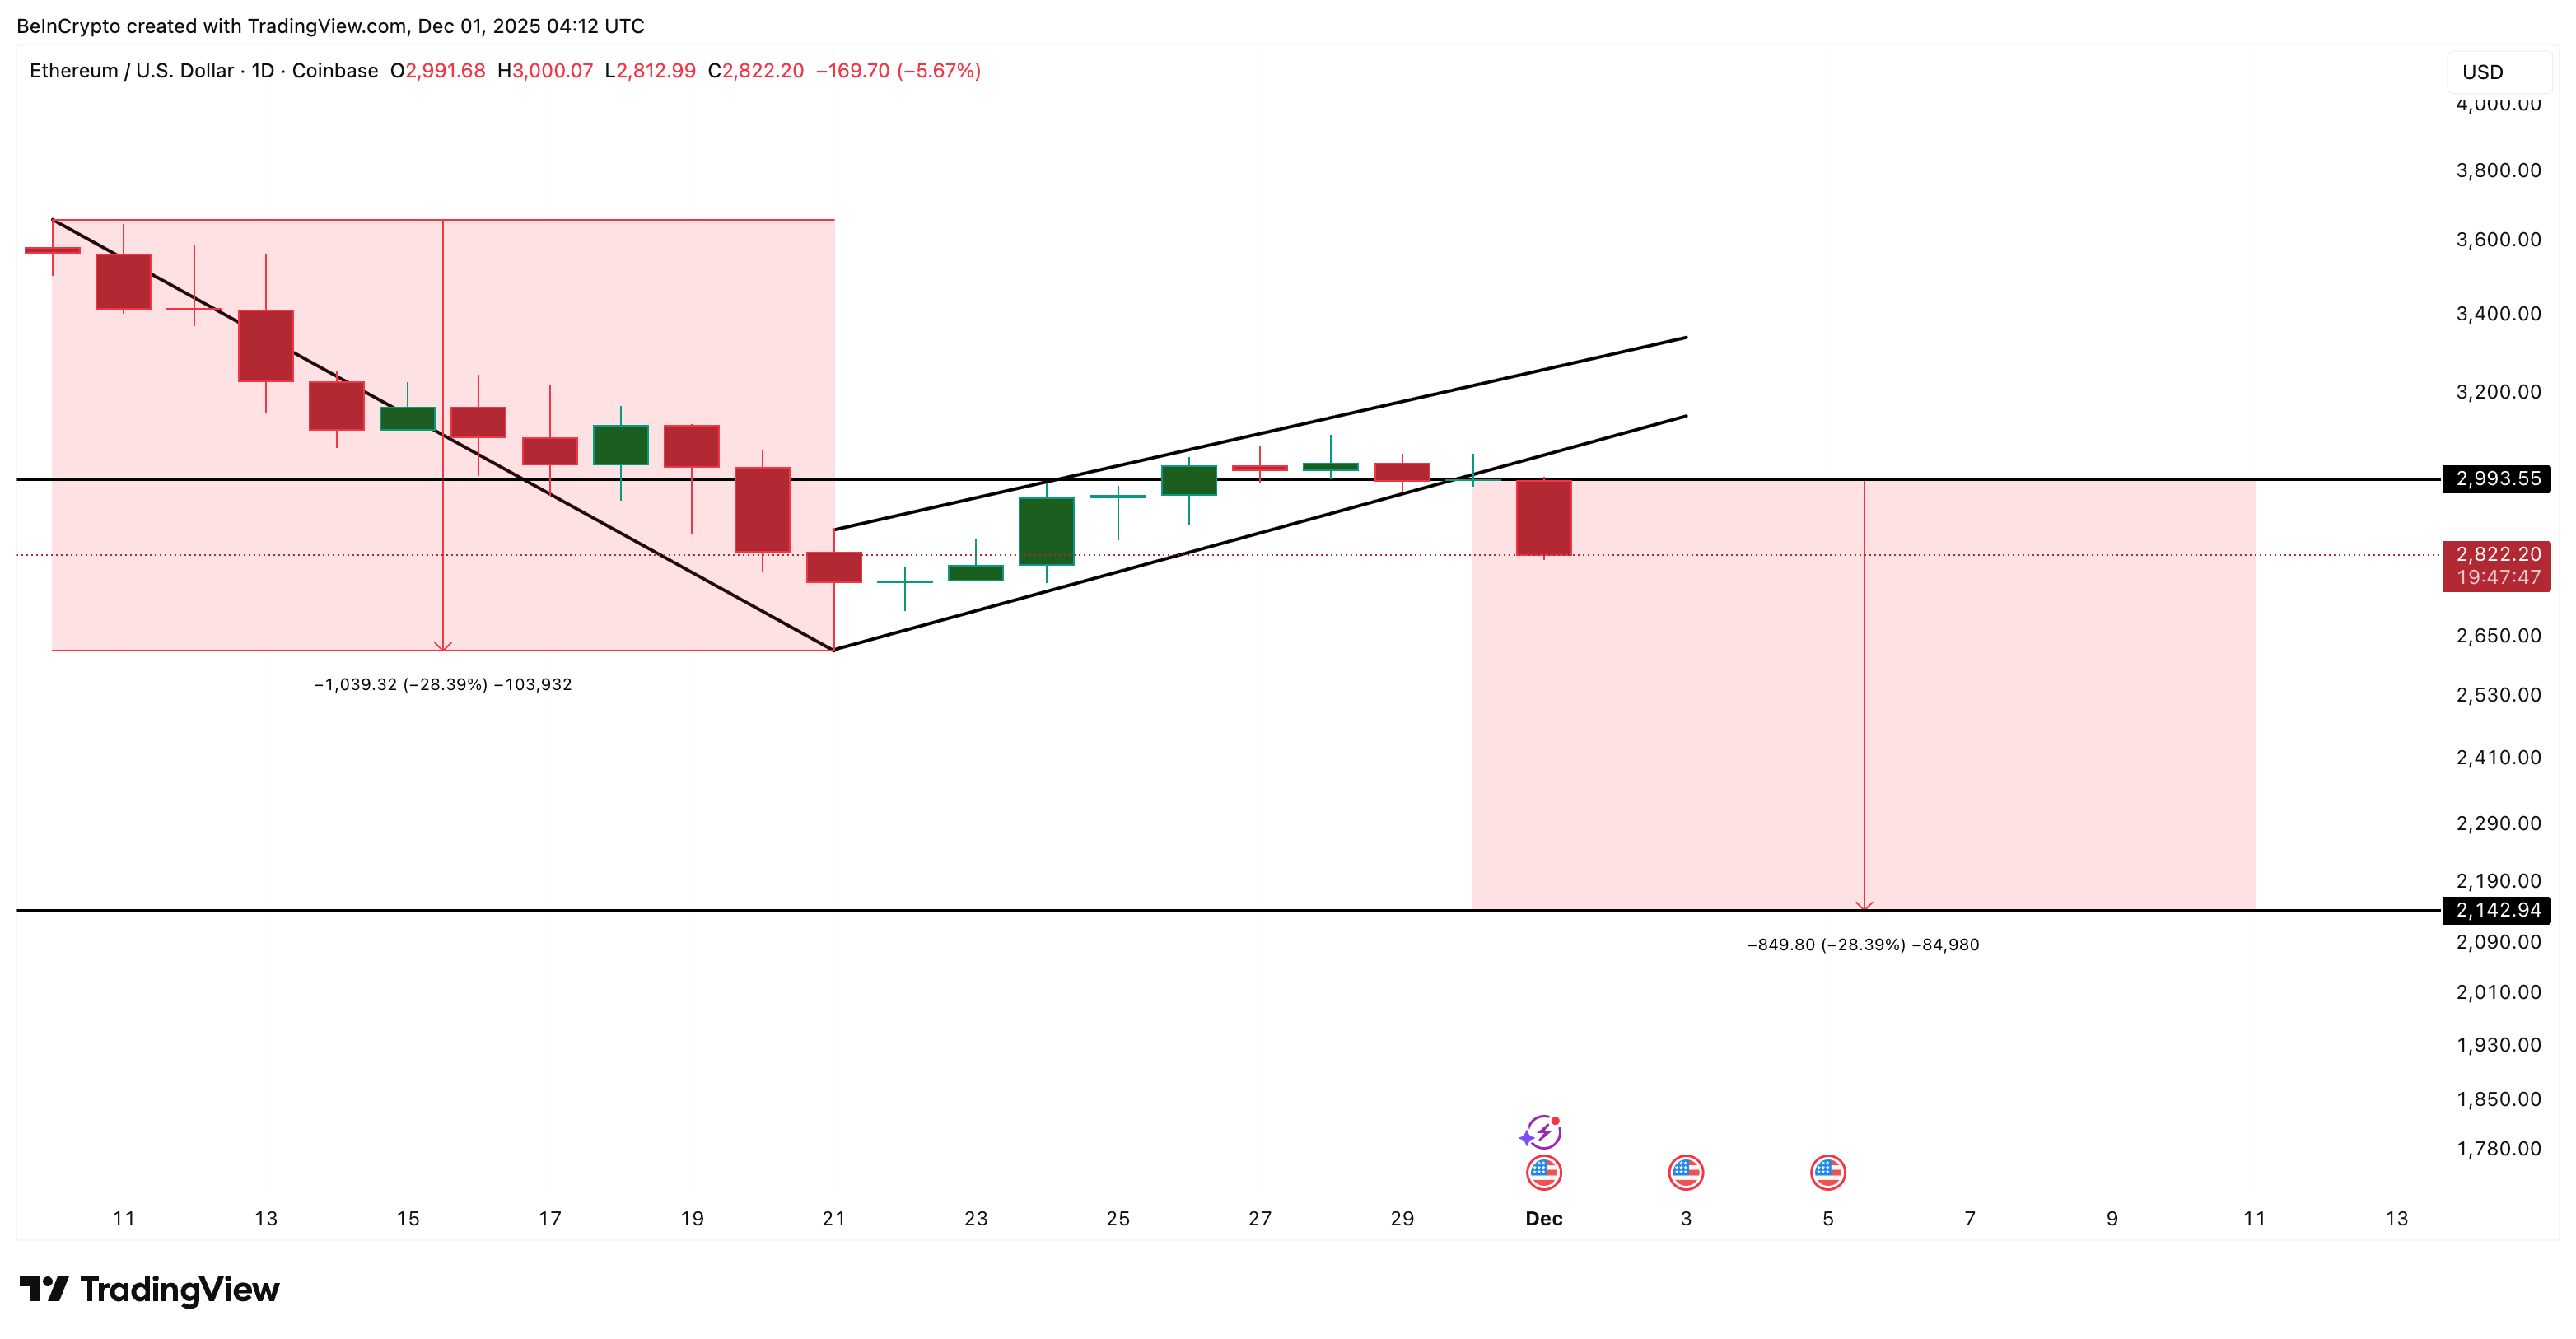
Ethereum recently broke down from a clean bear flag. The move began after ETH failed at $2,990 and slipped out of the rising channel it had been trading within for a week. The earlier sell-off created the “pole,” a drop of 28.39%, and the breakdown activates a measured target around $2,140, which sits almost exactly 28% below the breakdown level.
Want more token insights like this? Sign up for Editor Harsh Notariya’s Daily Crypto Newsletter here.
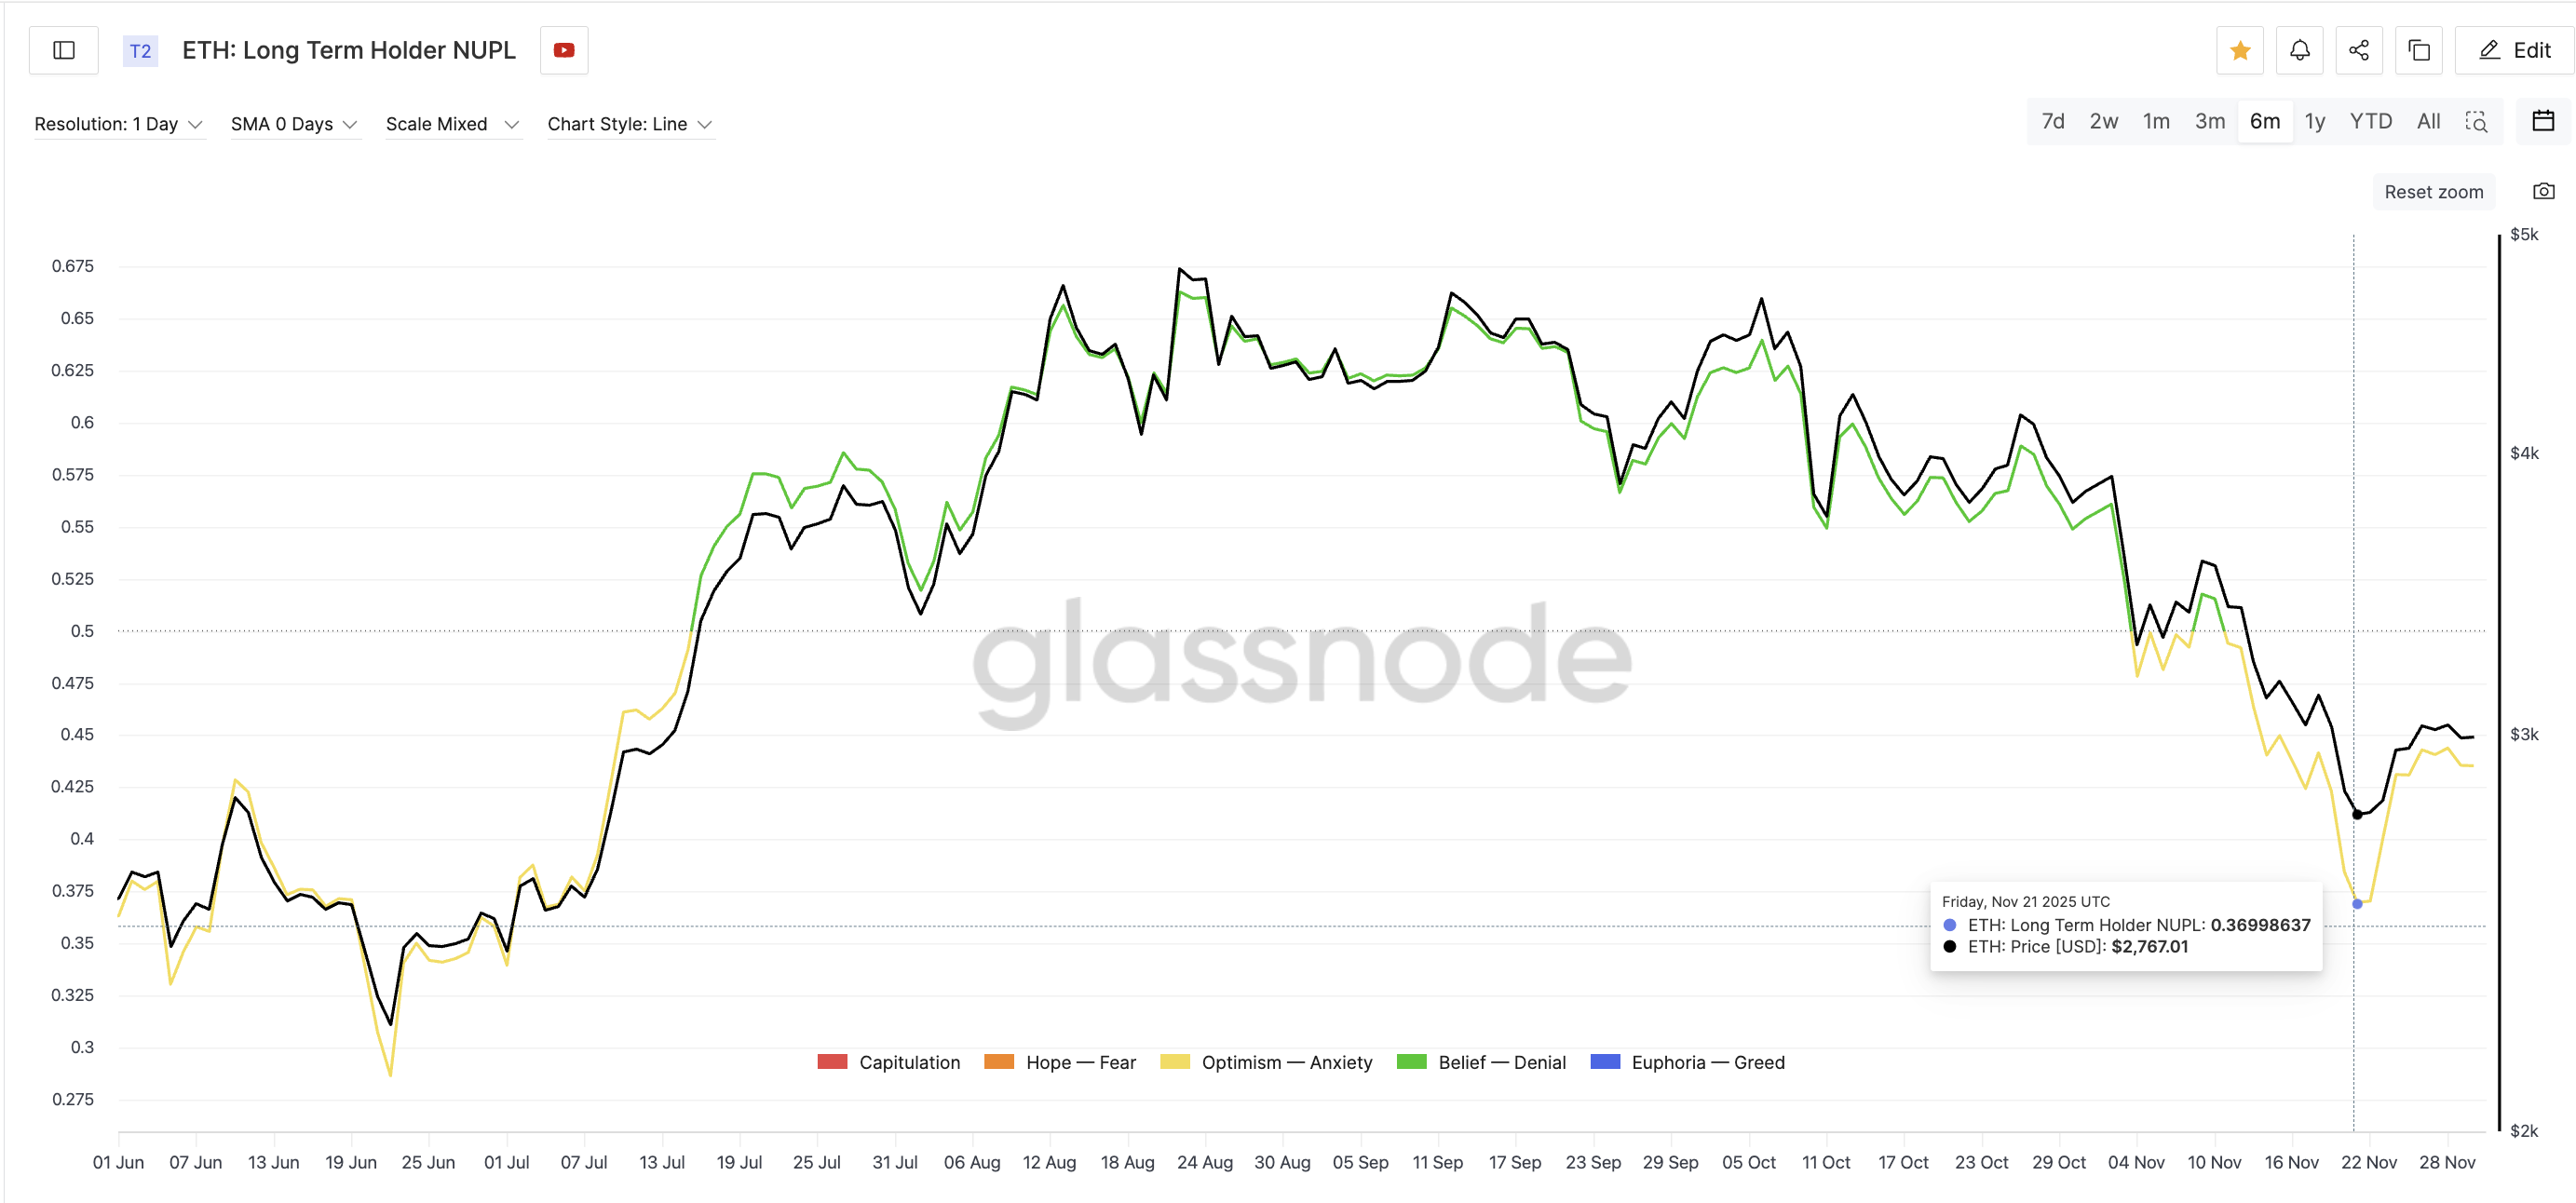
To see if this target makes sense, we compare it with long-term holder NUPL. Long-term holder NUPL measures how much profit long-term holders are sitting on.
NUPL has been trending down since August 22, suggesting long-term holders are reducing unrealized profits and softening their conviction. The latest short-term low was 0.36 on Nov 21, but the six-month low sits at 0.28, recorded on June 22, which is a difference of roughly 22%.
Back on June 22, when NUPL hit 0.28, ETH traded near $2,230, and the market reversed sharply. From there, Ethereum rallied all the way to $4,820, a gain of 116% from that bottom.
Today, if NUPL were to retest that 0.28 cycle-low band again, the implied price drawdown from ETH’s recent local high near $2,990 would be in the same 20–25% range, which aligns exactly with the 28% bear-flag target at $2,140.
This is the cleanest overlap in the entire analysis: Both the price pattern and the long-term holder metric point to the same lower zone.
Ethereum Price Sits on Its Strongest Cost-Basis Wall
The next step is to see whether the Ethereum price chart supports the same conclusion. The Cost Basis Distribution Heatmap shows where large clusters of ETH were recently accumulated. The heaviest band sits between $2,801 and $2,823, with 3,591,002 ETH bought in that zone. This is the strongest support Ethereum has right now.
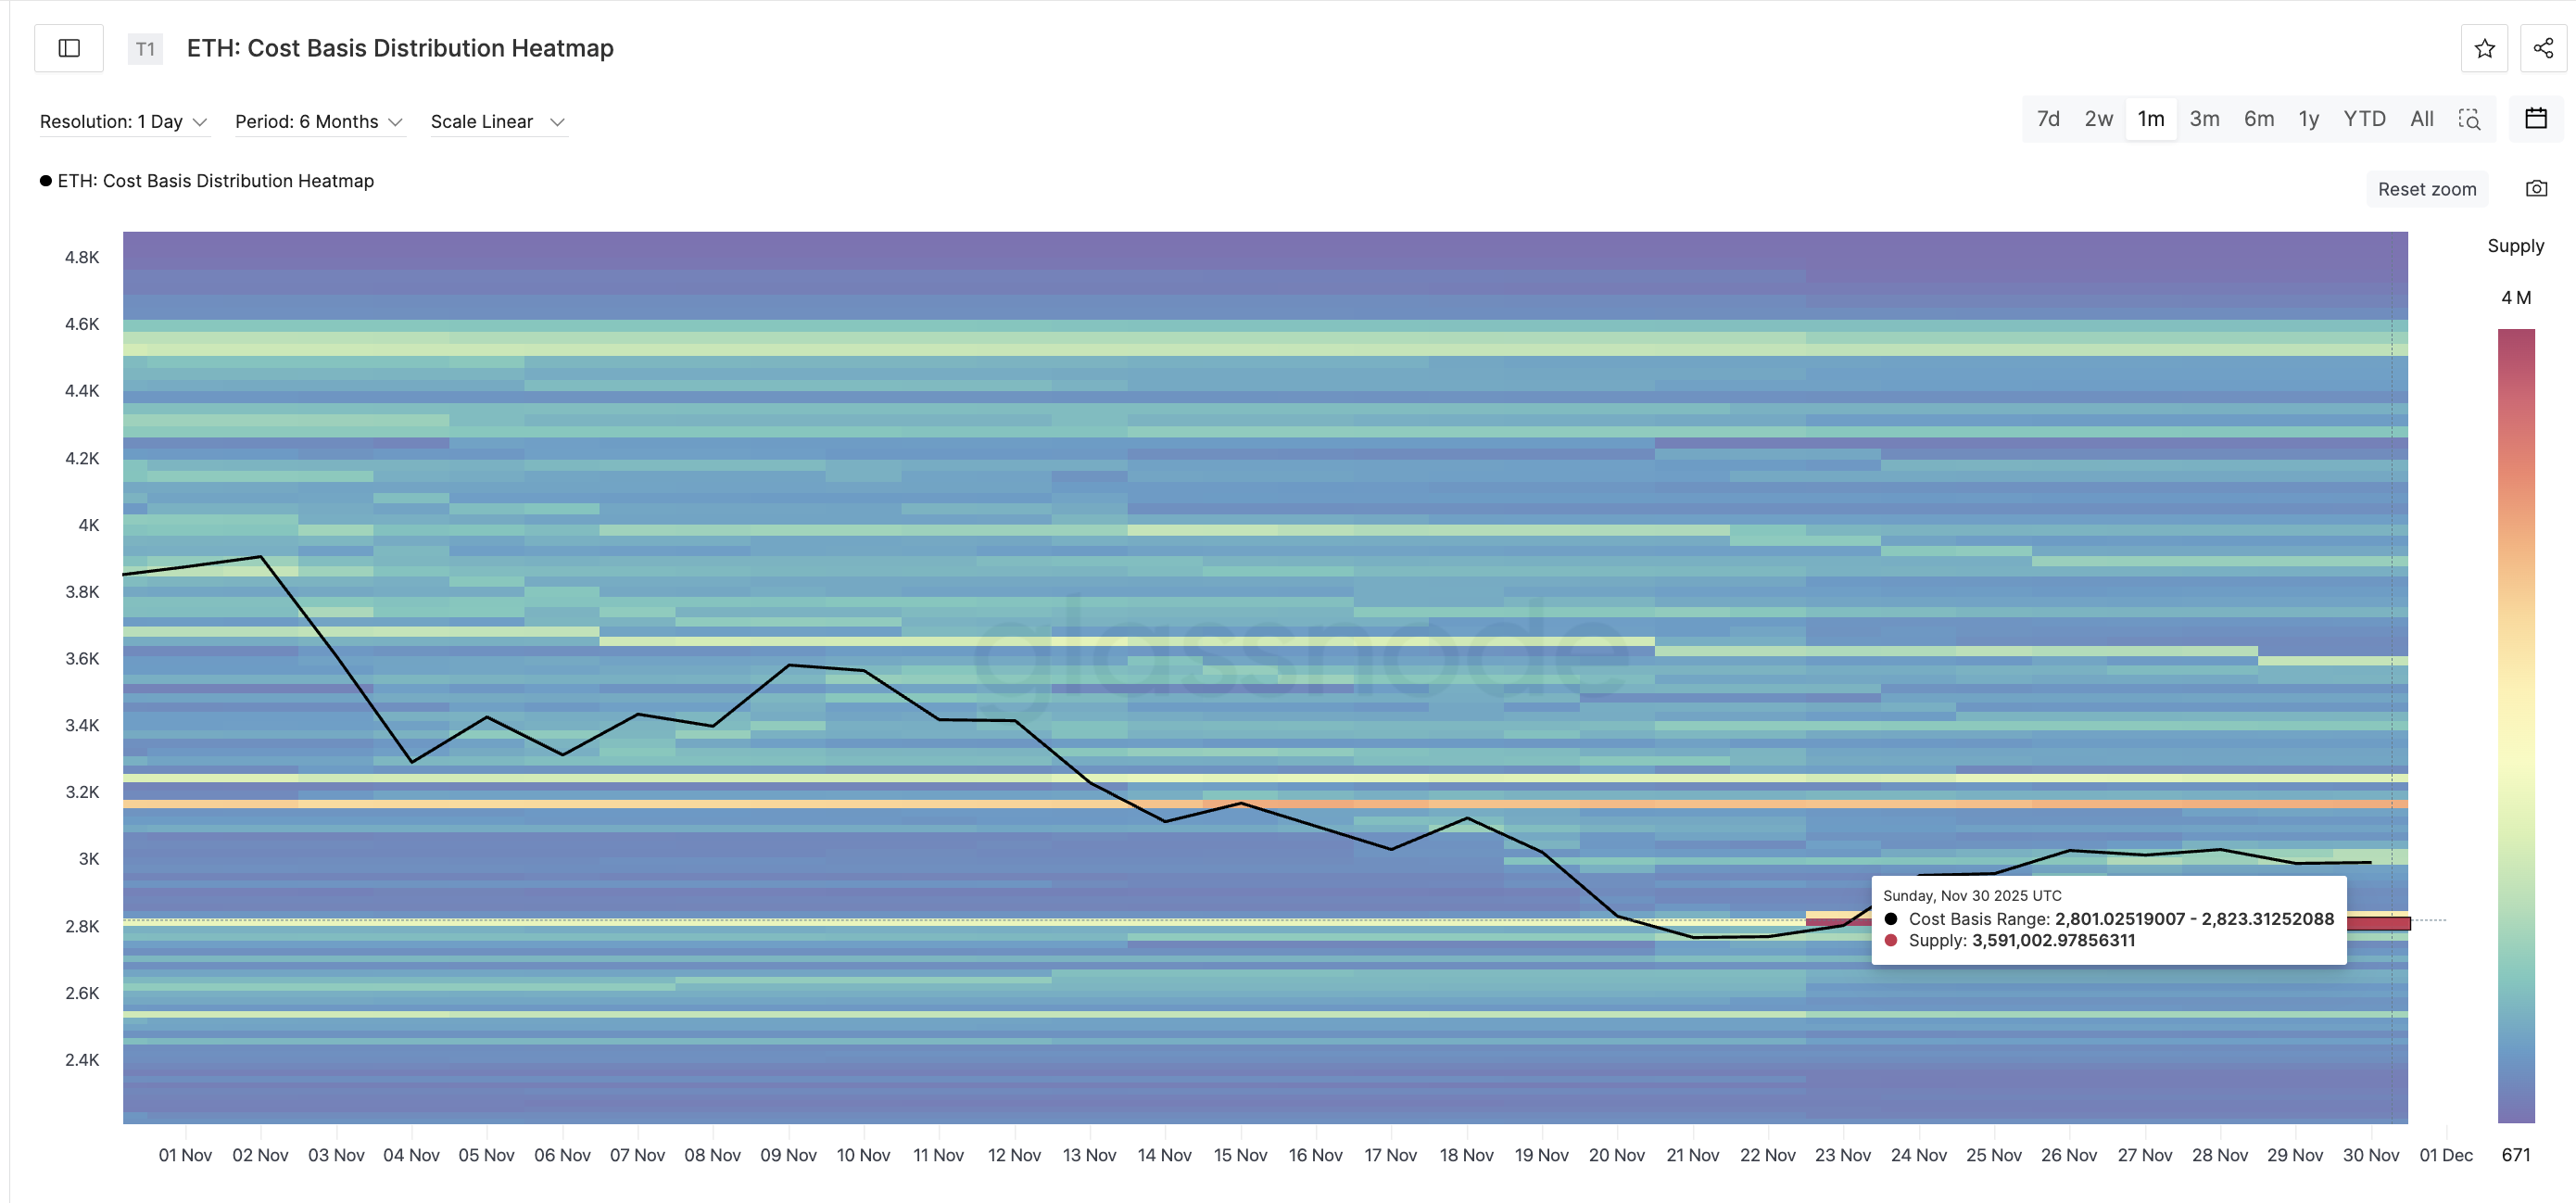
ETH has already broken below the $2,840 price level, increasing pressure on this cost-basis wall. If the ETH price cannot reclaim $2,840 quickly and close above $2,990 again, sellers remain in full control.
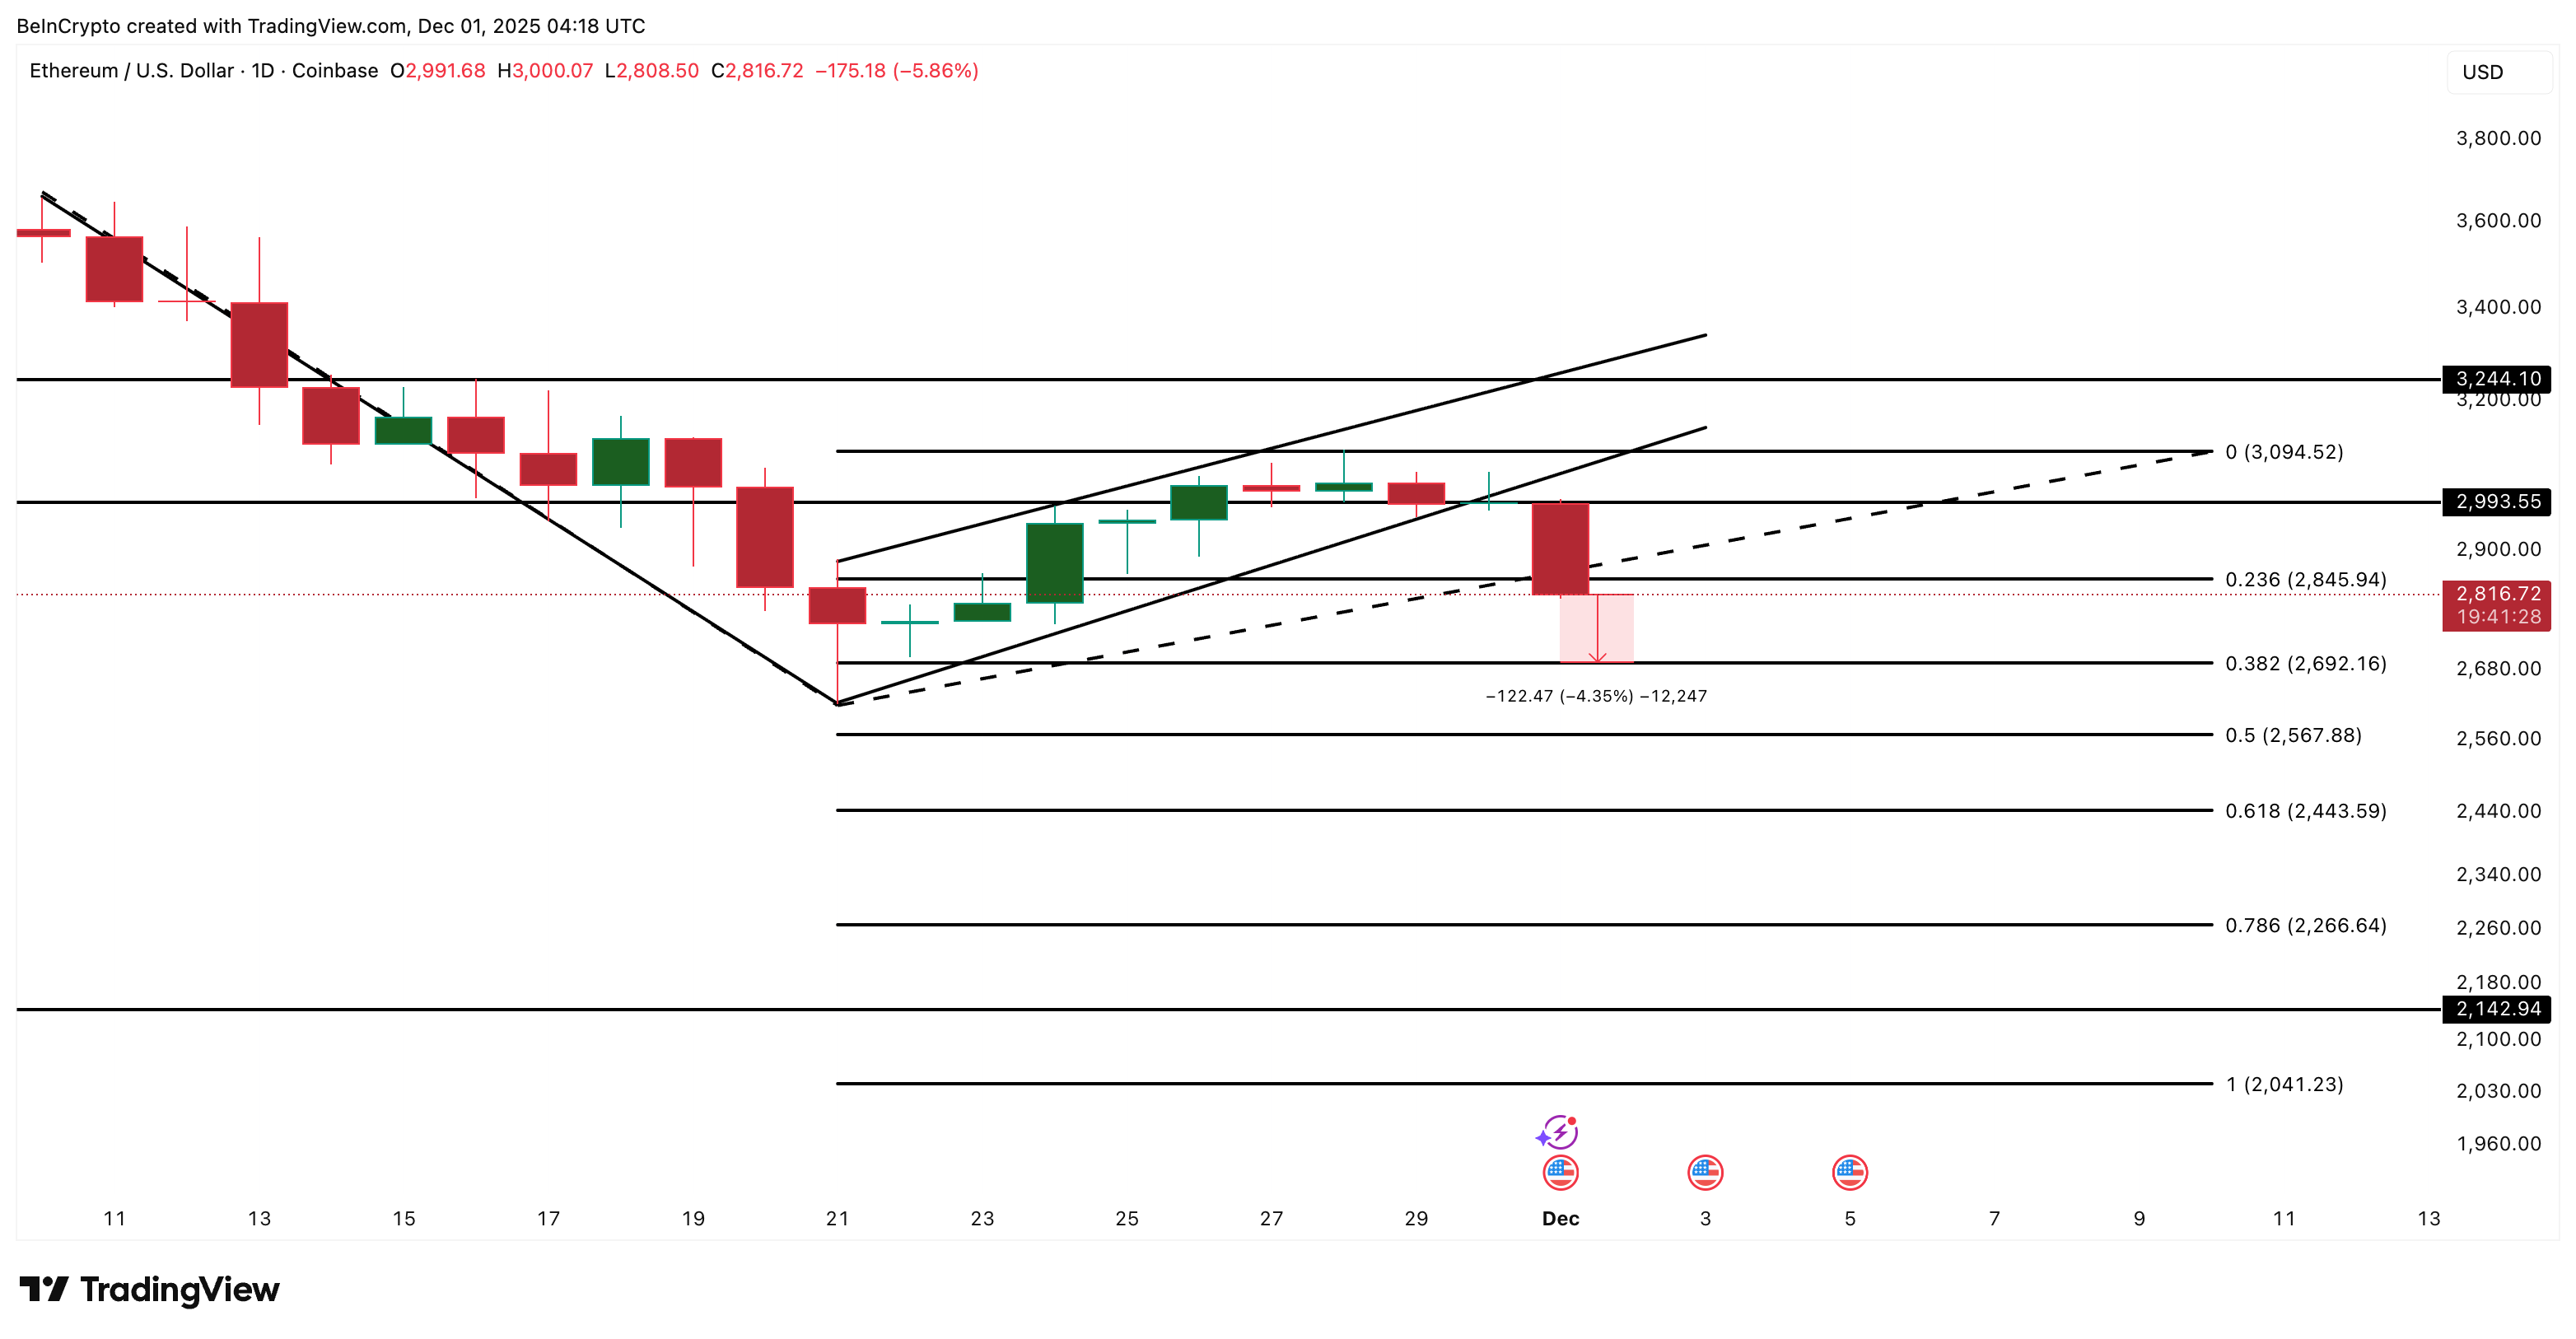
If weakness continues, the next levels on the trend-based extension appear one after another. The first point is $2,690, which sits about 4.5% below the current price. If that fails, the decline can extend to $2,560 (a further 4.6% drop), $2,440 (another 4.8%), and $2,260, which is just 2% above the June NUPL-bottom price of $2,230.
Below all of these sits $2,140, the full breakdown target, about 28% below the breakdown zone and fully aligned with the flag projection.
If ETH falls through $2,266, the bear-flag target becomes the most realistic scenario.
There is still an invalidation path, but it requires strength at several layers. ETH must regain $2,840, then break above $2,990, and then secure a close above $3,090. The entire bearish pattern loses meaning only if ETH pushes through $3,240, which would be a roughly 15% move up from current levels.
For now, ETH trades beneath its strongest cost-basis wall, long-term holders are still reducing unrealized profit, and the continuation structure points clearly lower. If these conditions hold, the $2,260–$2,140 region becomes the most probable area where Ethereum could form its next cycle bottom.
