


The Ethereum price has been decreasing since June, having lost almost 60 percent of its value. Recently, it broke down below a significant support area — indicating that further decreases could be in store.
Even though the Ethereum price outlook is bleak, the network looks as strong as ever. Investments in the Ethereum-based decentralized finance (DeFi) have been significantly increasing. The services offered by DeFI include, but are not limited to, derivatives, assets, and lending.
DeFi is considered a general indicator of the Ethereum health, with the $650 million currently invested in it accounting for two percent of the total supply. The amount of funds is near an all-time high, having increased by more than 200 percent since the same time last year — when the total amount was $220 million. The difference is highlighted when looking at 2017 when DeFi had only $10 million in investments.
However, the increase in investments has failed to move the price upwards. Cryptocurrency trader @cryptodude999 outlined the Ethereum price movement and sarcastically suggested that the chart looks bullish. He used an inverted chart that shows that the price has recently broken down below a very significant support area.
$ETH Damn. Bullish AF. pic.twitter.com/wlXbY9UmMc
— the dude (@cryptodude999) December 11, 2019
Is Ethereum really bearish? If so, how long will it continue to decrease?
Current Ethereum Pattern
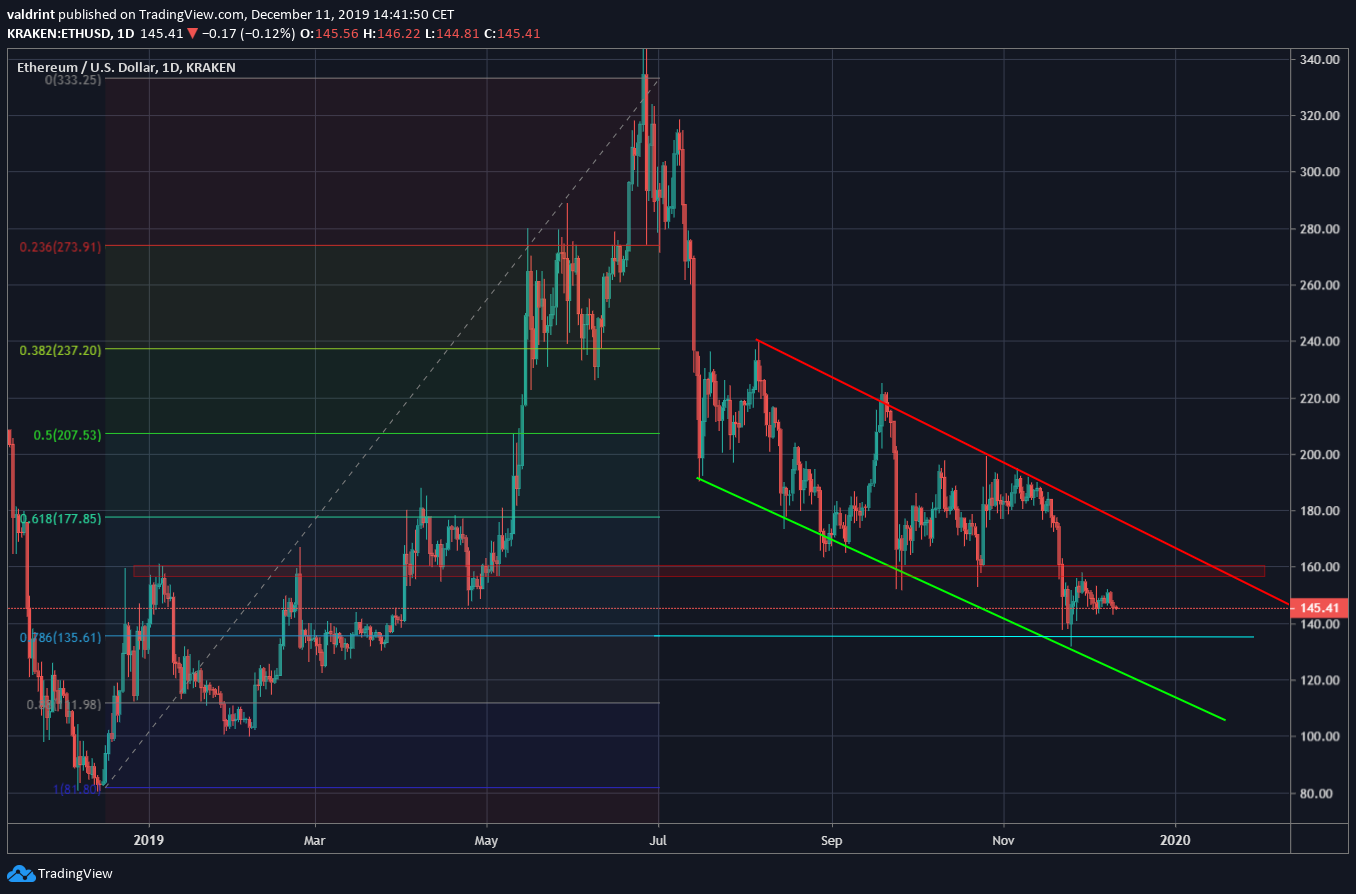
The Ethereum price has been trading inside a descending channel since July. It has broken down below the significant support area at $160 and validated it as resistance afterward.
However, the November 25 bounce occurred at the confluence of support offered by the descending support line and the 0.786 Fib level. Currently, the Ethereum price is trading between the aforementioned support confluence at $135 and the resistance area at $160.
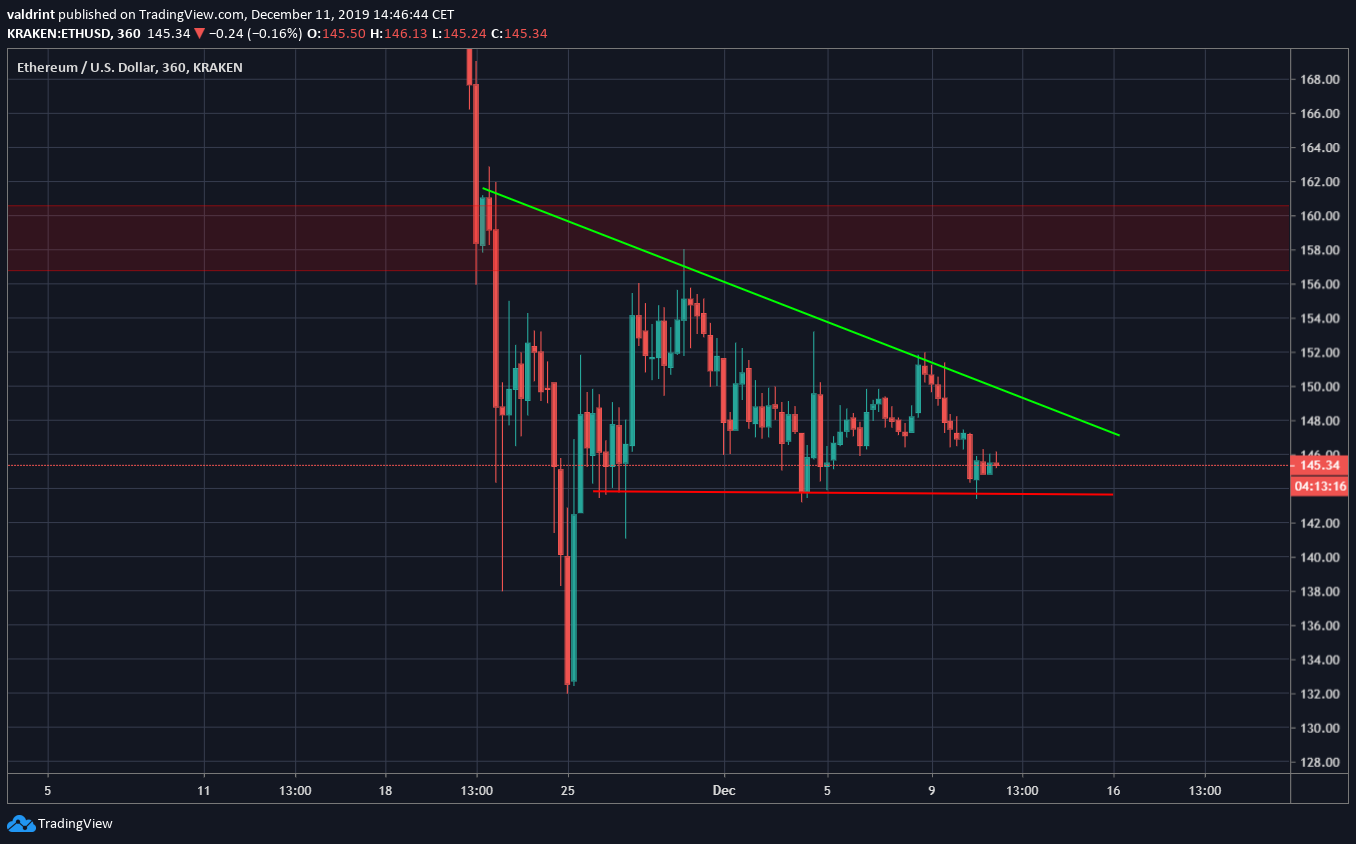
The short-term movement is also bearish. Since the bounce, the Ethereum price validated the resistance area but failed to move upwards. Since then, it has been trading inside a descending triangle. This is a bearish pattern that suggests the price will eventually break down.
Future Movement
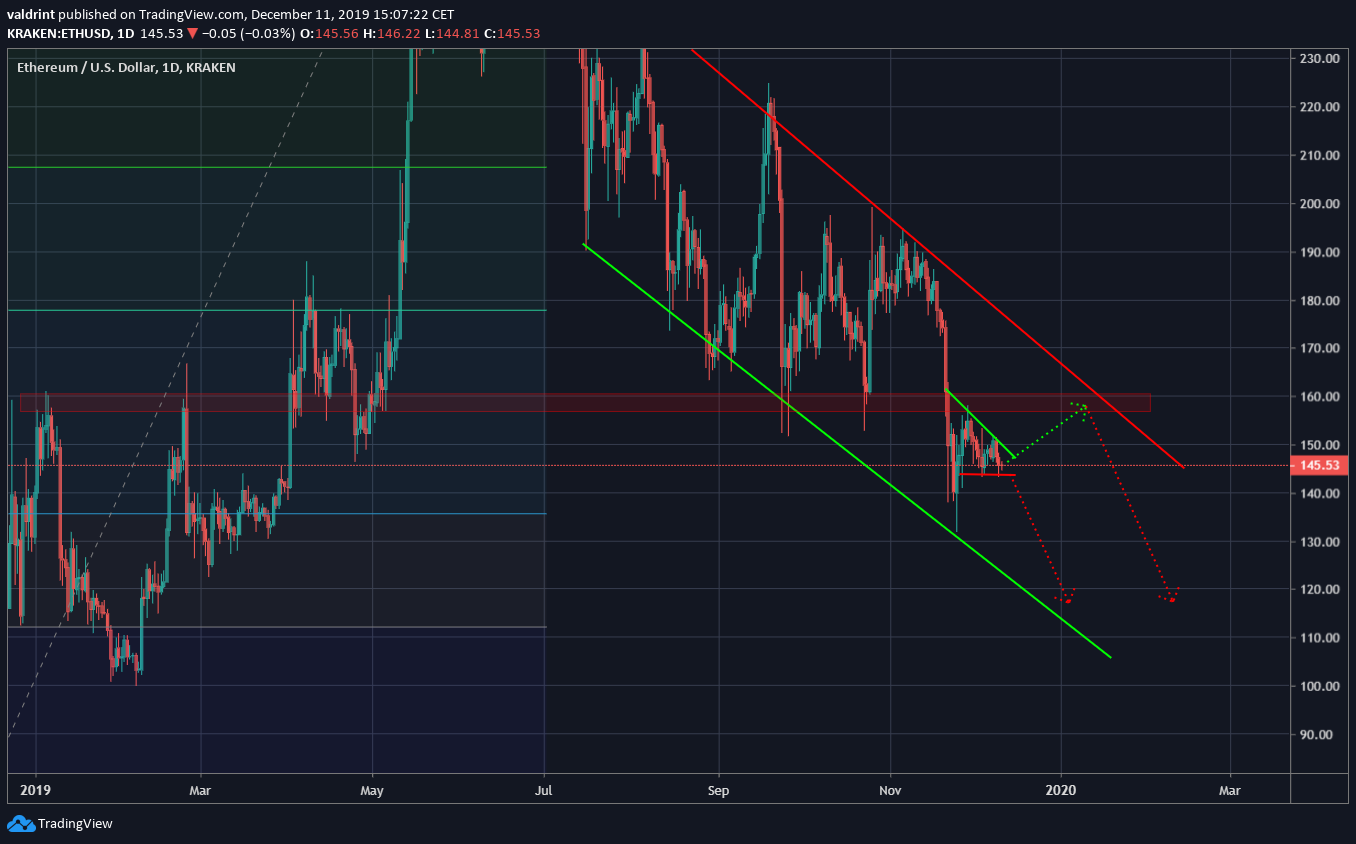
Based on our analysis, there are two possible movements for the Ethereum price.
- The price will break out from the triangle, validate the resistance area once again, and decrease towards $110-$120.
- The price will break down from the triangle and decrease towards $110-$120
Therefore, the outlook is bearish and an eventual Ethereum price decrease is expected either way.
To conclude, the Ethereum price broke down below a significant support area and validated it as resistance. We expect the price to continue decreasing until it reaches the next support area.


