

The Bitcoin dominance rate (BTCD) has been decreasing rapidly since May 14.
This downward move has caused it to fall below an important resistance line, above which it was previously believed that it had broken out from. During this same period, ETH/BTC has been moving upwards with strength.
Bitcoin Dominance Rate
The Bitcoin dominance rate had been following a descending resistance line beginning in September 2019. Until now, the price has validated this line four times. In the beginning of May, the rate purportedly broke out from this resistance line, along with the 68% support level. However, the price swiftly decreased back below it, invalidating the previous breakout. In addition, the rate has also lost the support of the 200-day moving average (MA), confirming the possibility of a continued decrease. Therefore, we could see the BTCD fall all the way to 64%.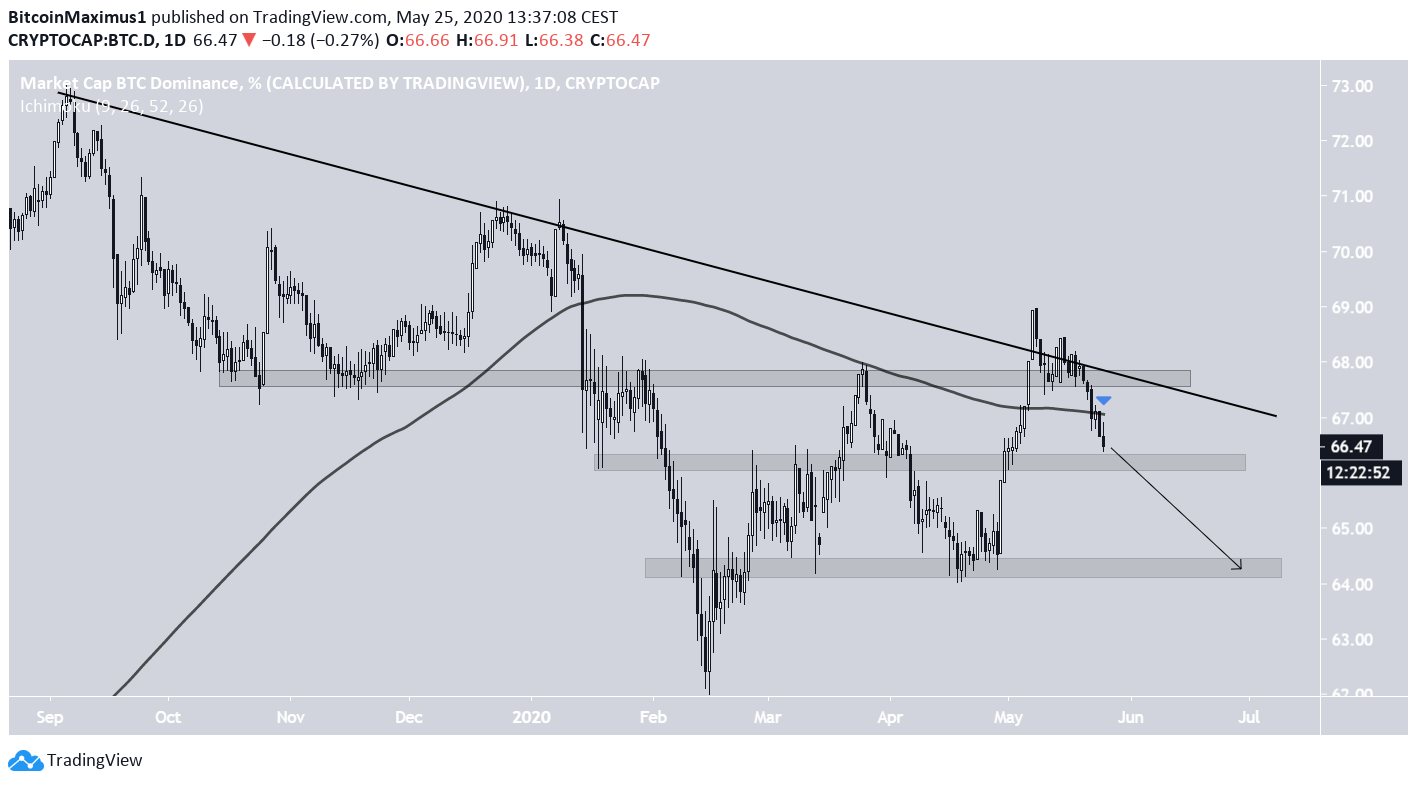
Ethereum
The ETH price has seemingly been trading inside a long-term symmetrical triangle since the beginning of 2020. The movement near the support line of the triangle is very interesting, since the price has twice decreased below its 200-day MA, only to bounce on the support line and initiate a strong upward movement. The last time this occurred was on May 14, the same day that BTCD reached a high. During its upward movement, the ETH price has successfully flipped the ₿0.023 area as support.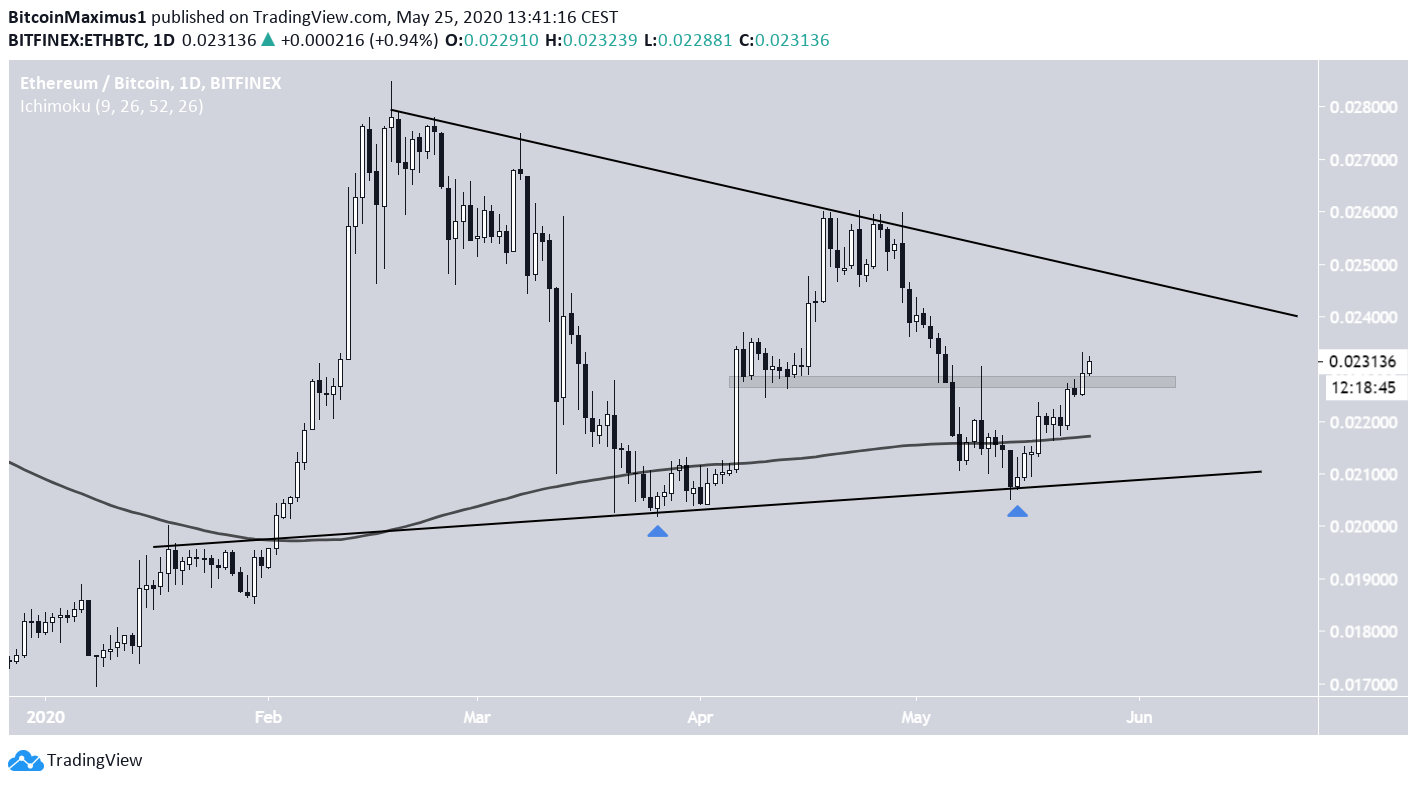
Top crypto projects in the US | April 2024
Trusted
Disclaimer
In line with the Trust Project guidelines, this price analysis article is for informational purposes only and should not be considered financial or investment advice. BeInCrypto is committed to accurate, unbiased reporting, but market conditions are subject to change without notice. Always conduct your own research and consult with a professional before making any financial decisions. Please note that our Terms and Conditions, Privacy Policy, and Disclaimers have been updated.

Valdrin Tahiri
Valdrin discovered cryptocurrencies while he was getting his MSc in Financial Markets from the Barcelona School of Economics. Shortly after graduating, he began writing for several different cryptocurrency related websites as a freelancer before eventually taking on the role of BeInCrypto's Senior Analyst.
(I do not have a discord and will not contact you first there. Beware of scammers)
READ FULL BIO
Sponsored
Sponsored