The Bitcoin dominance rate (BTCD) has been decreasing rapidly since May 14.
This downward move has caused it to fall below an important resistance line, above which it was previously believed that it had broken out from. During this same period, ETH/BTC has been moving upwards with strength.
Bitcoin Dominance Rate
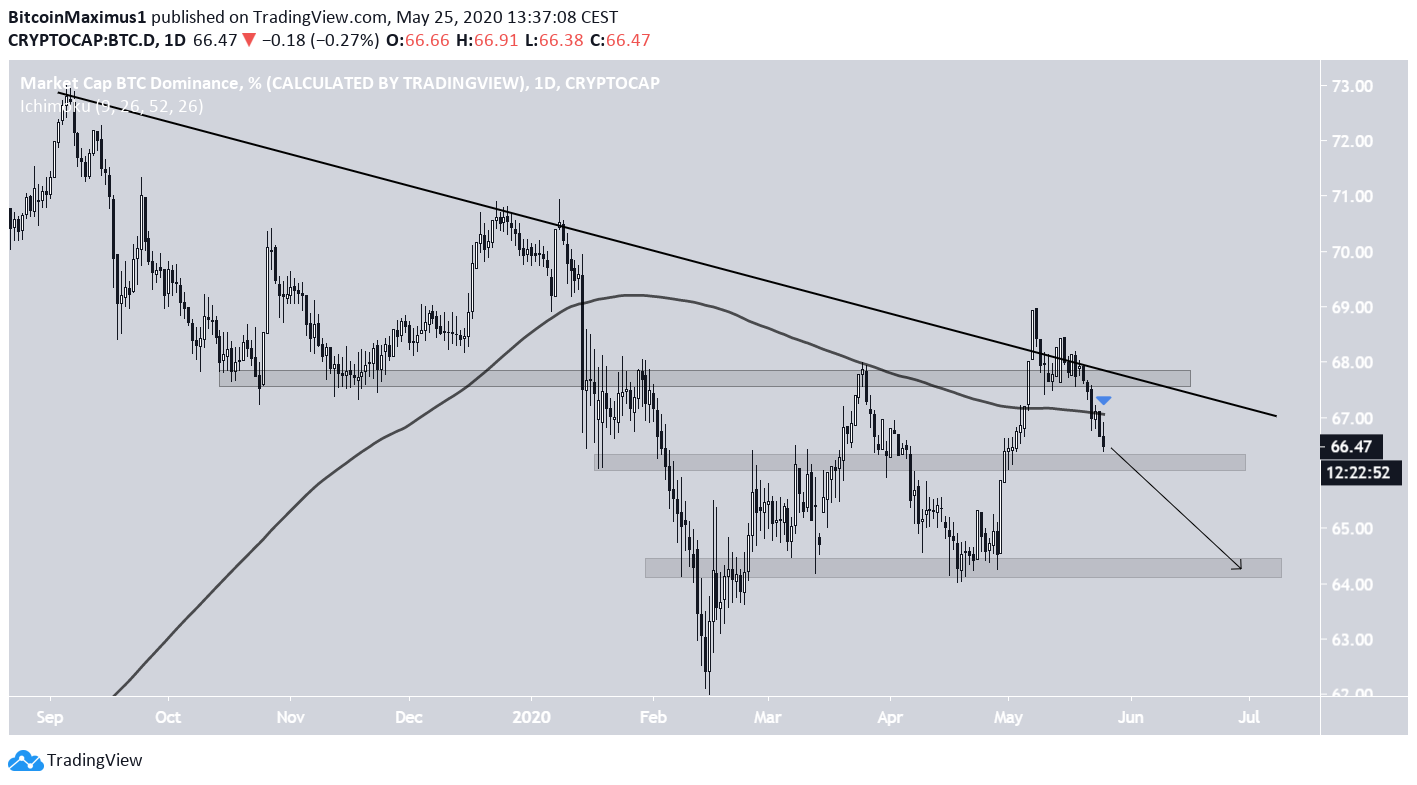
The Bitcoin dominance rate had been following a descending resistance line beginning in September 2019. Until now, the price has validated this line four times.
In the beginning of May, the rate purportedly broke out from this resistance line, along with the 68% support level. However, the price swiftly decreased back below it, invalidating the previous breakout.
In addition, the rate has also lost the support of the 200-day moving average (MA), confirming the possibility of a continued decrease. Therefore, we could see the BTCD fall all the way to 64%.
Ethereum
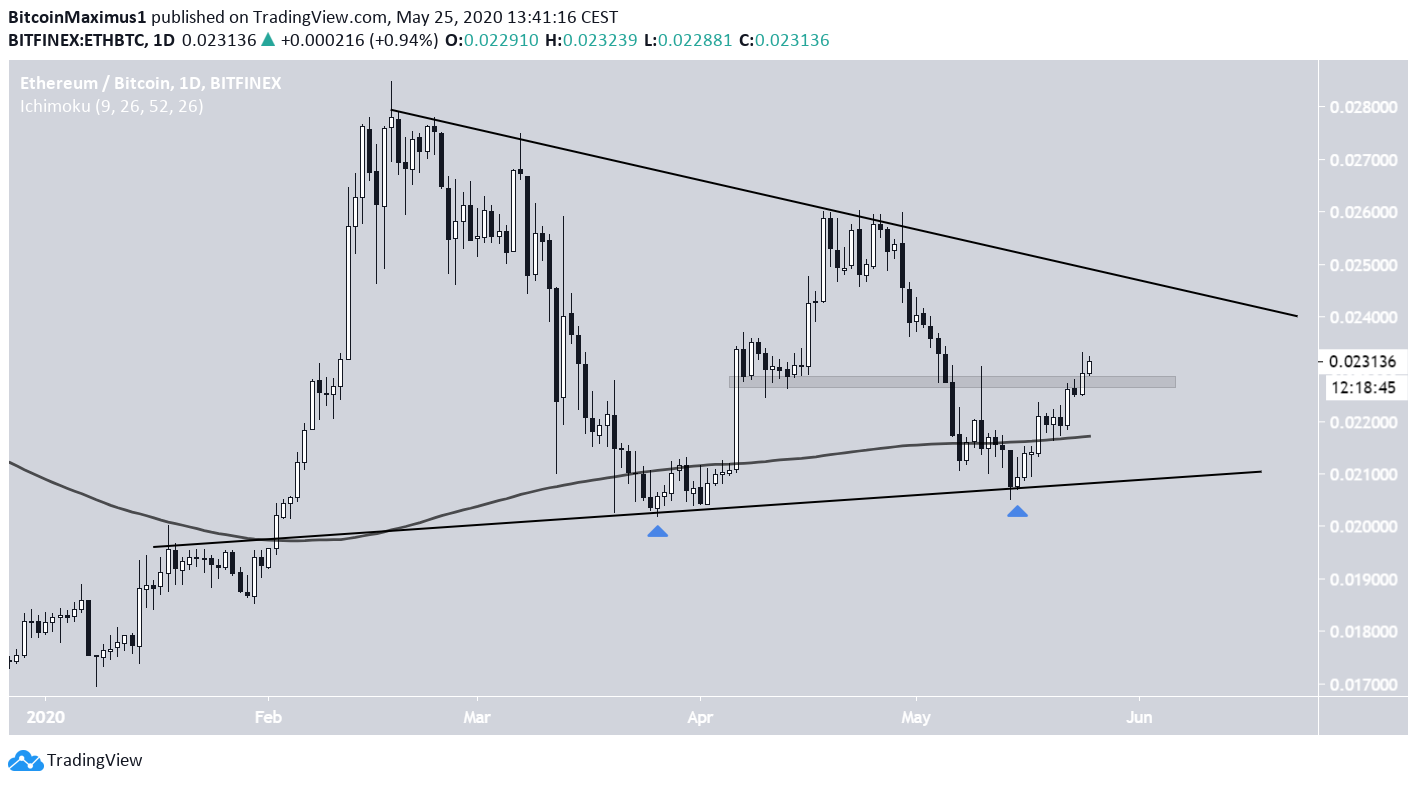
The ETH price has seemingly been trading inside a long-term symmetrical triangle since the beginning of 2020. The movement near the support line of the triangle is very interesting, since the price has twice decreased below its 200-day MA, only to bounce on the support line and initiate a strong upward movement.
The last time this occurred was on May 14, the same day that BTCD reached a high. During its upward movement, the ETH price has successfully flipped the ₿0.023 area as support.
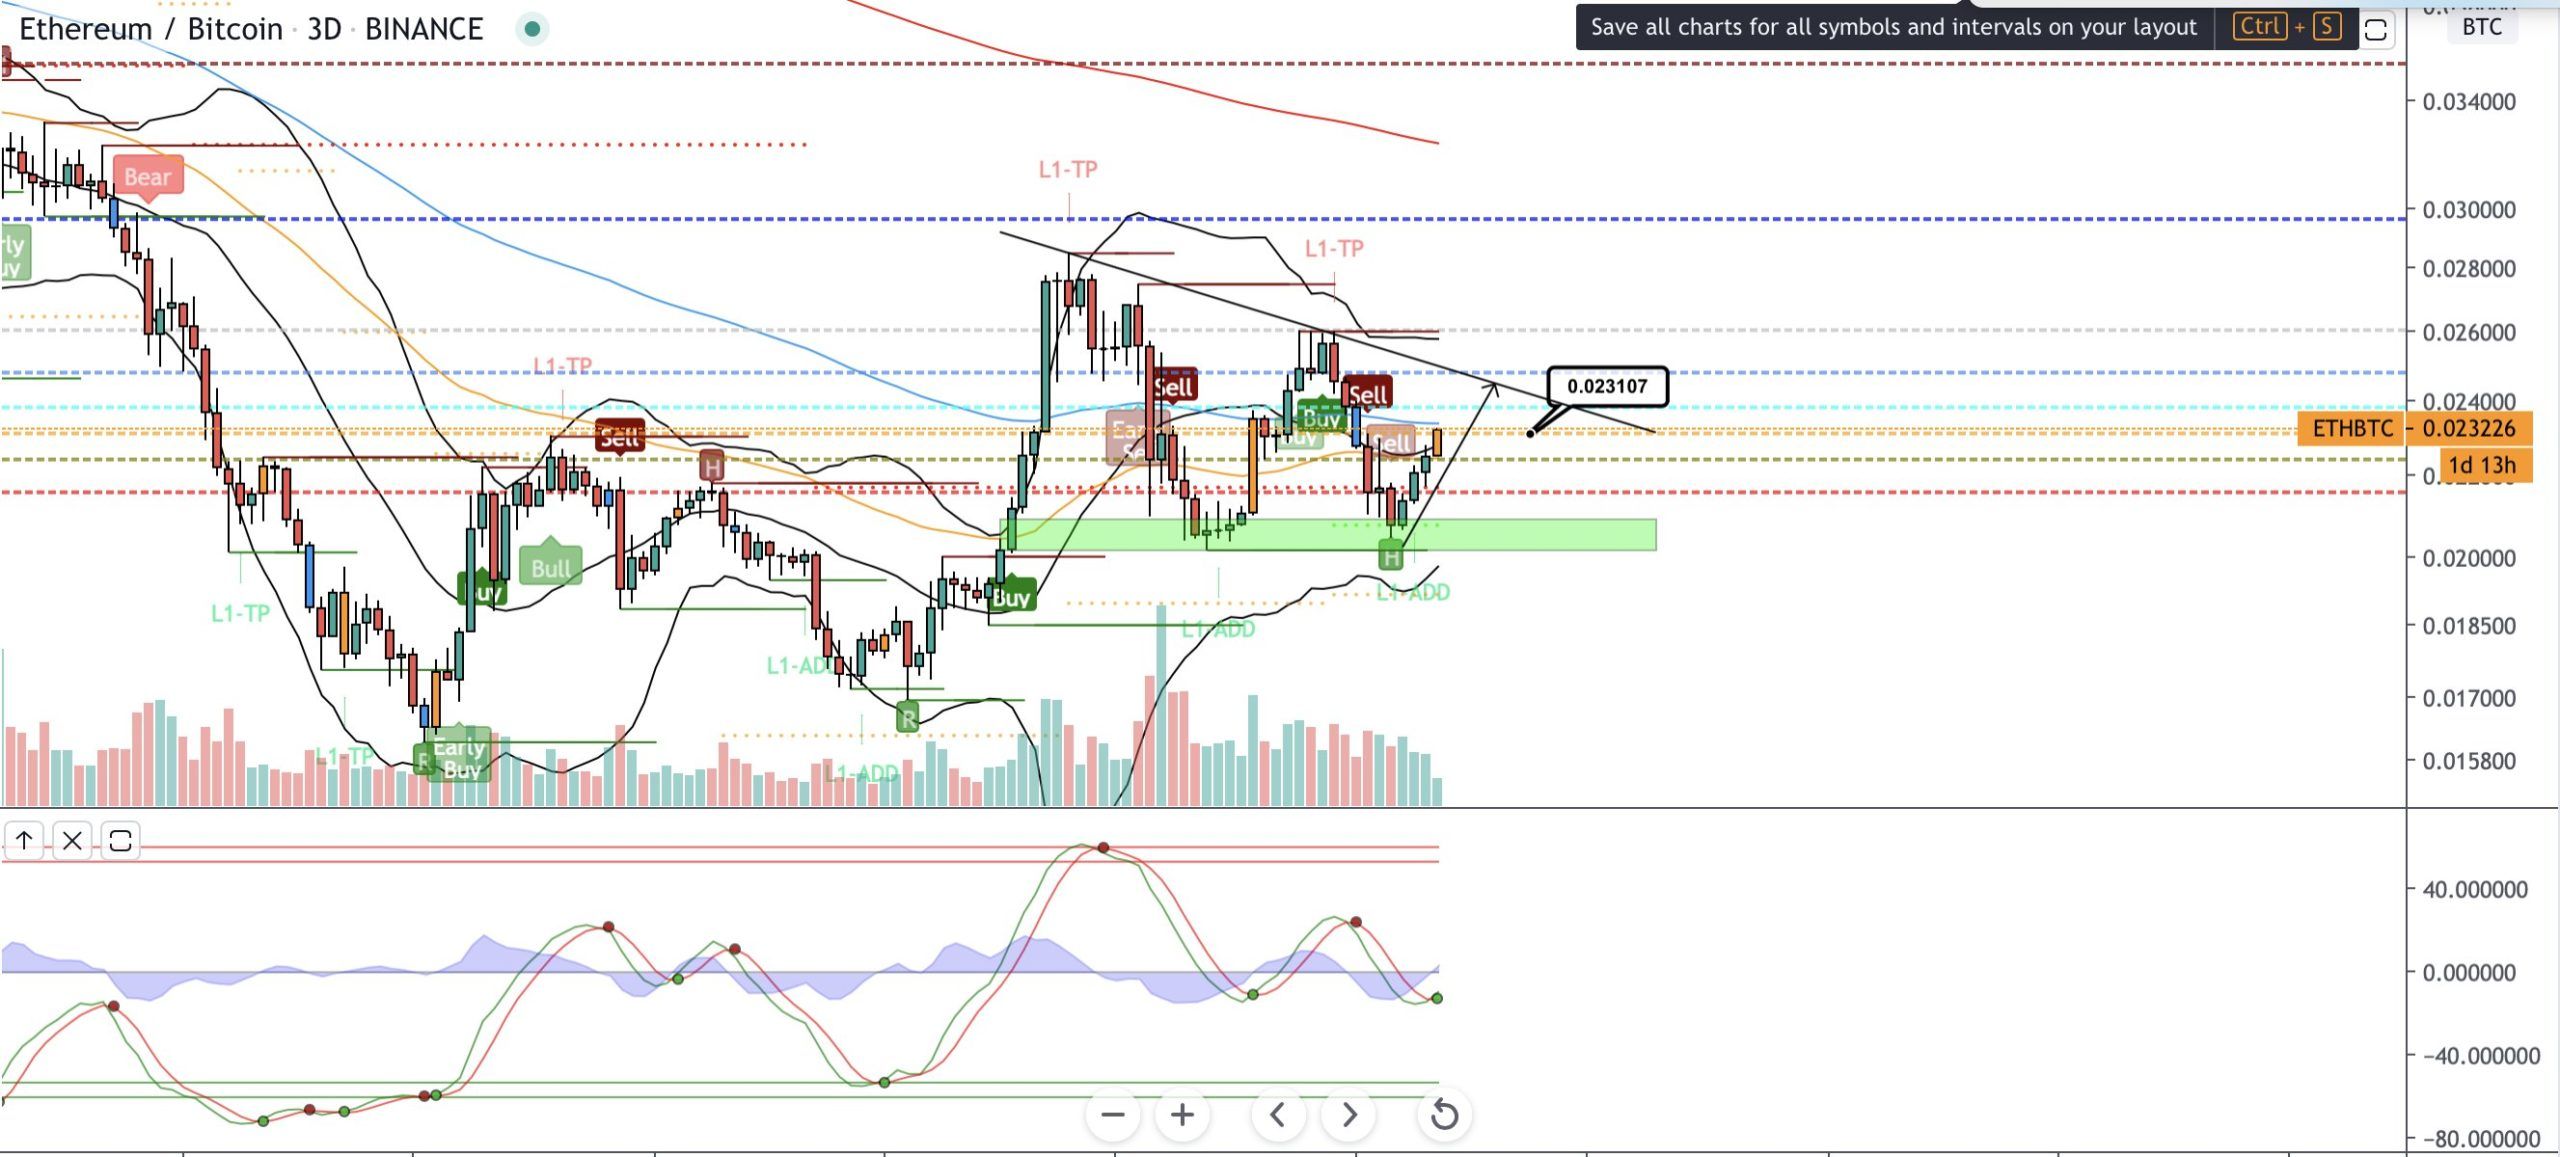
Well-known trader @CryptoNewton tweeted an Ethereum price chart, stating that he believes that Ethereum can be the one to initiate alt-season, especially if it breaks out from the current resistance he has drawn. The resistance line is the same one from the symmetrical triangle above.
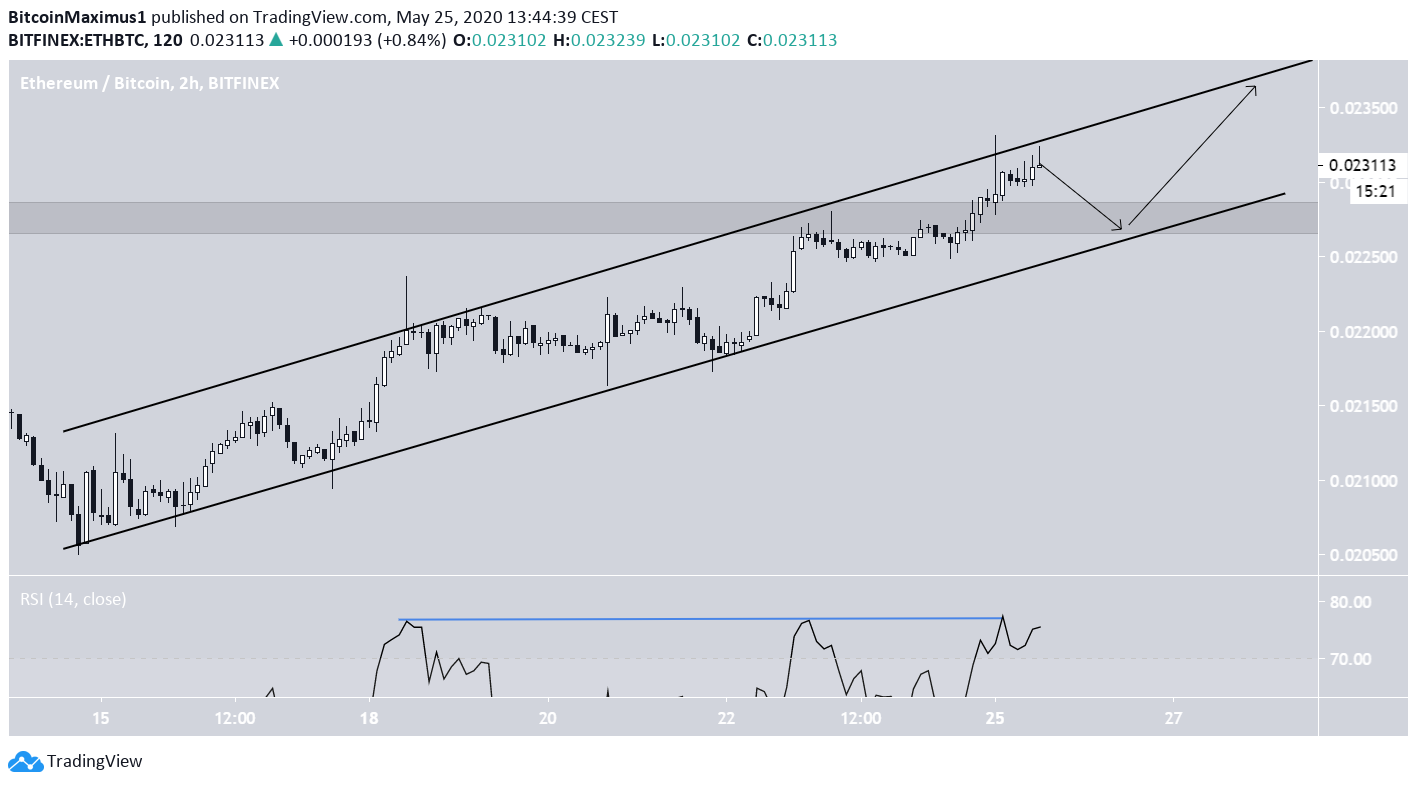
The short-term movement indicates that the price is likely to reach this area. ETH is trading inside an ascending channel, currently being very close to the resistance line of the channel, and has generated bearish divergence in the RSI.
Therefore, it is possible that the price decreases towards the previously outlined ₿0.023 support area along with the ascending support line, before it resumes its upward movement towards the resistance line of the longer-term symmetrical triangle.