Yesterday’s decrease has caused Ethereum to drop all the way to an ascending support line that has been in place since the March 13 bottom. Whether the price breaks down below it or initiates a bounce from the current price level will determine if the upward trend for ETH will continue.
Double Top
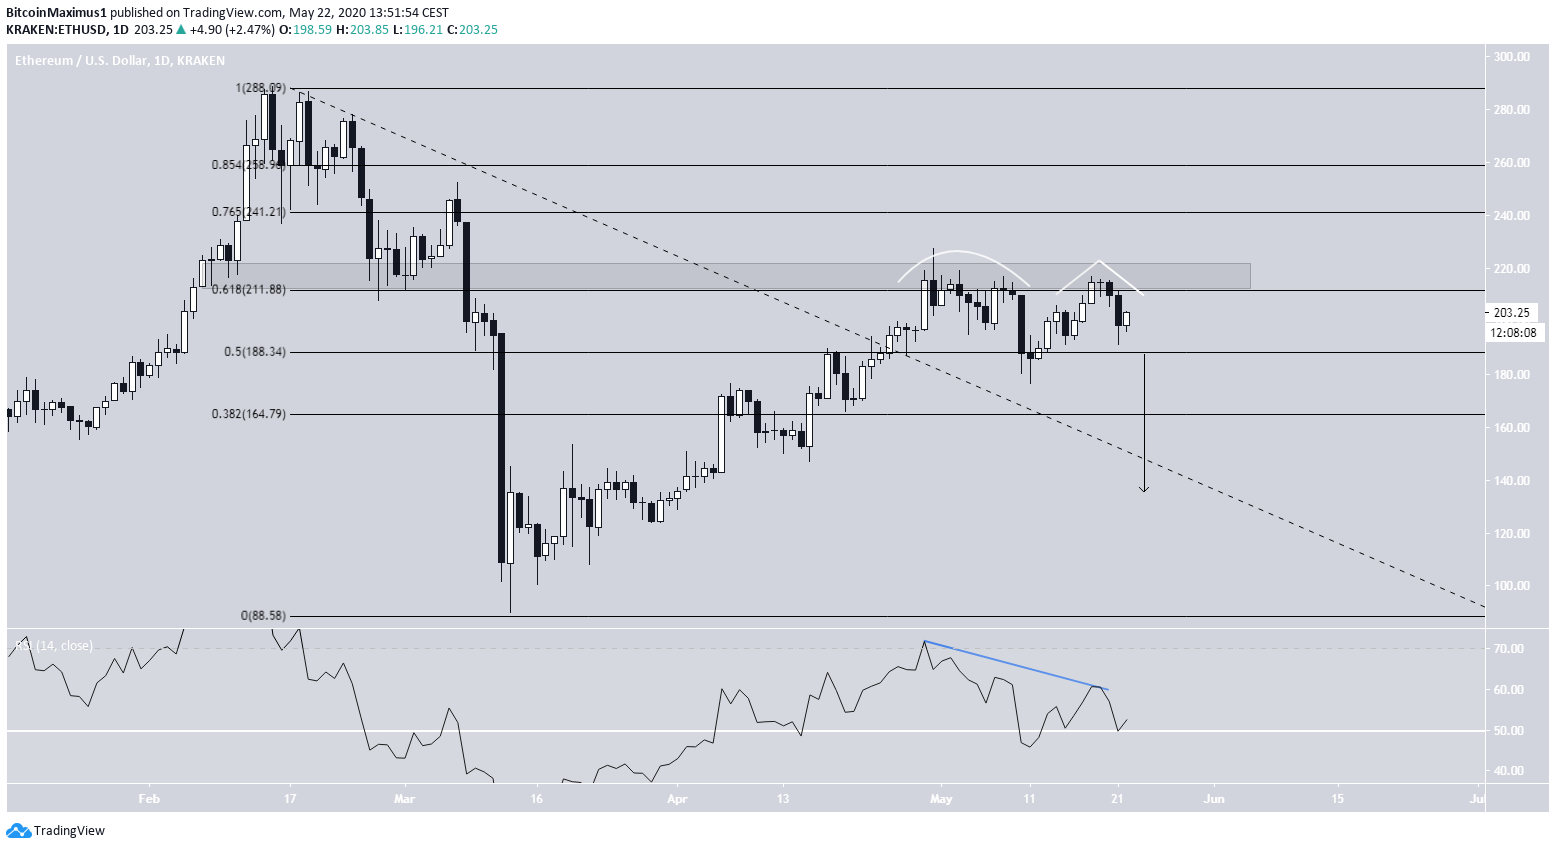
When looking at the daily chart, we can see that Ethereum has possibly created an Eve & Adam double top, which is considered a bearish reversal pattern. Furthermore, the pattern has occurred at the 0.618 Fib level of the previous decrease and inside a minor resistance area, making this a suitable level for a trend reversal.
If the price decreases the entire length of the pattern, it could drop all the way to $140.
Ascending Triangle
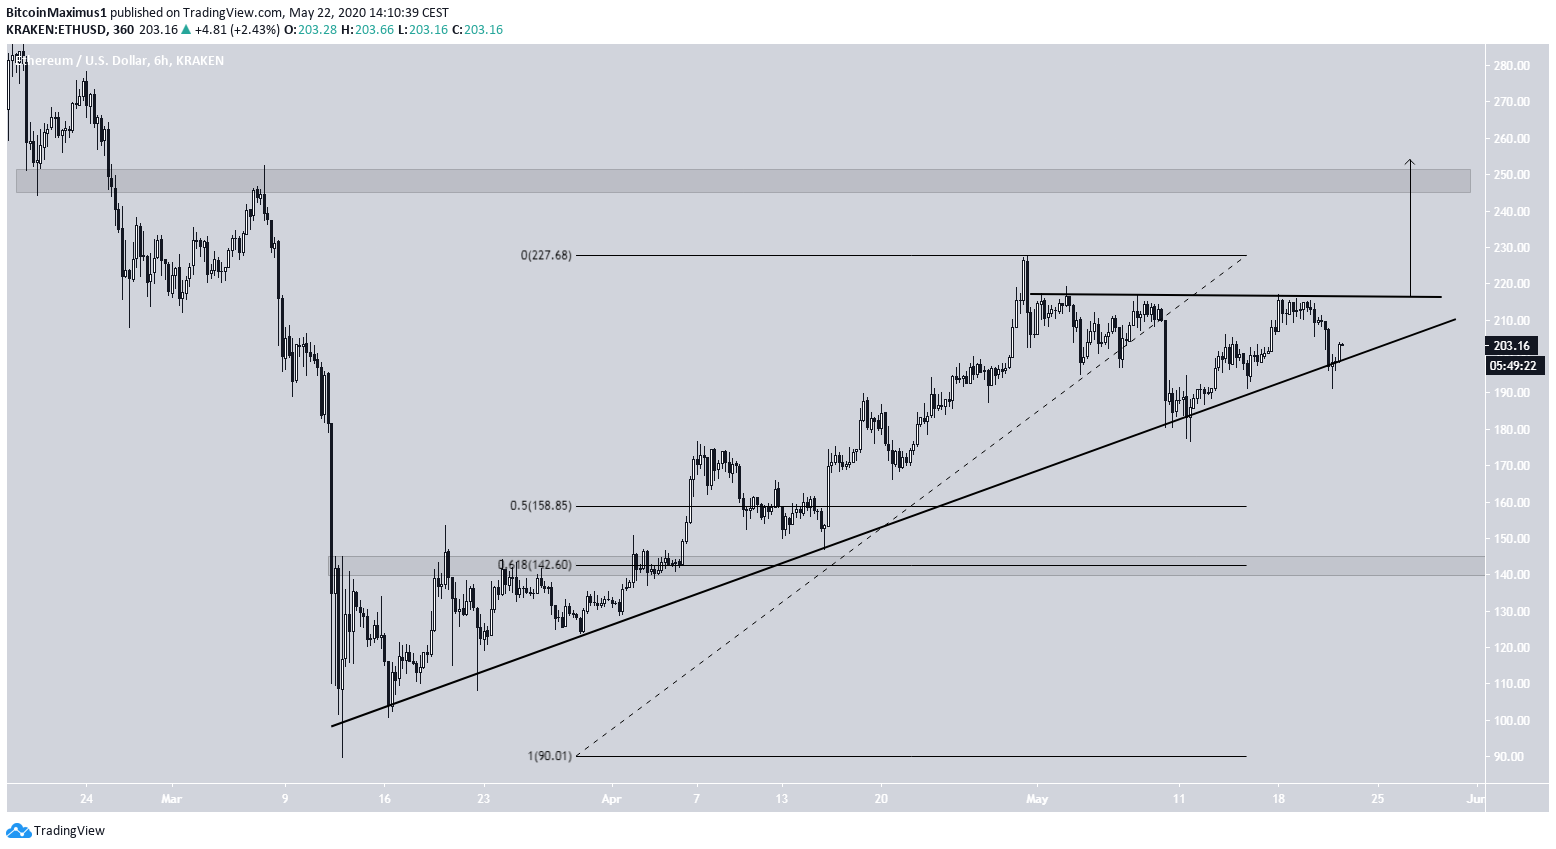
However, lower time-frames provide a more bullish outlook.
First, the price has been increasing alongside an ascending support line since the March 13 bottom. Furthermore, since May 2, it has been following a horizontal resistance line, which creates a possible ascending triangle.
If so, the price would be expected to break out from this pattern. Furthermore, an upward move that travels the entire height of the pattern would take ETH to $255.
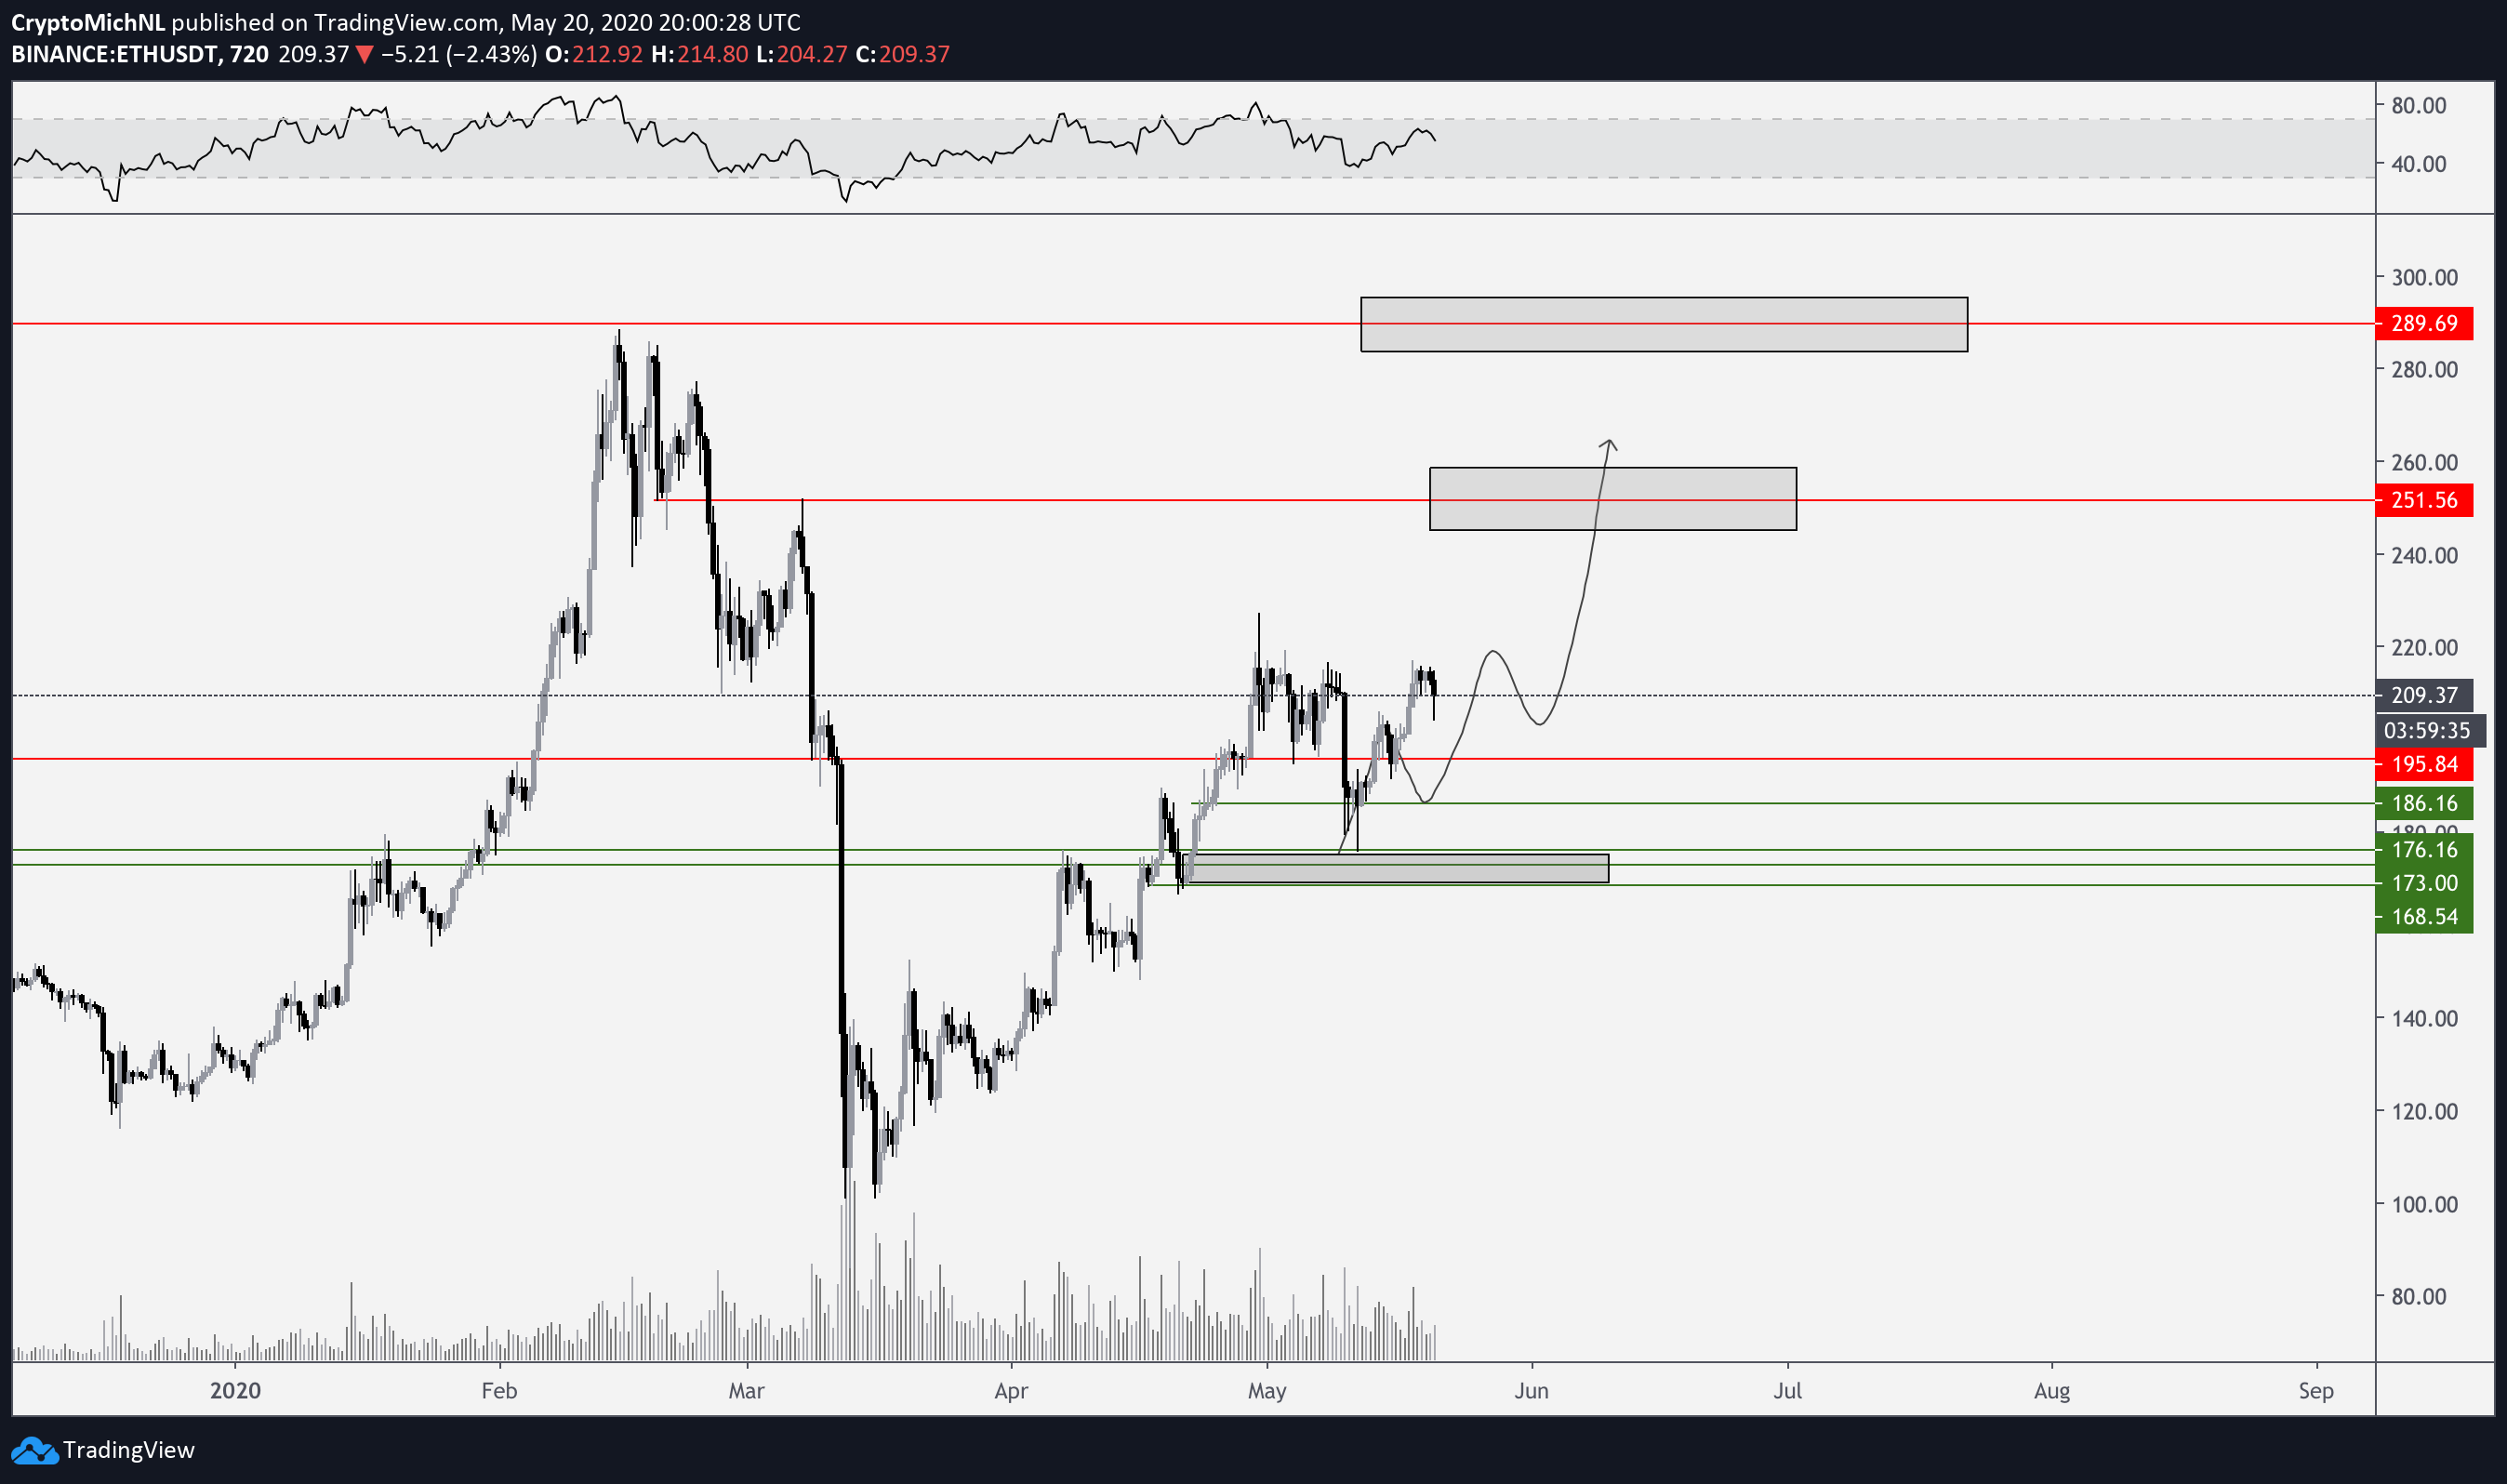
The $255 target was also given in a tweet by cryptocurrency trader @CryptoMichNL, who posted an Ethereum chart in which he has outlined a slight retracement along with two targets, found at $250 and $290, respectively.
So, whether the price initiates a bounce at the support line or breaks down below it will likely determine the direction of the longer-term trend for Ethereum.
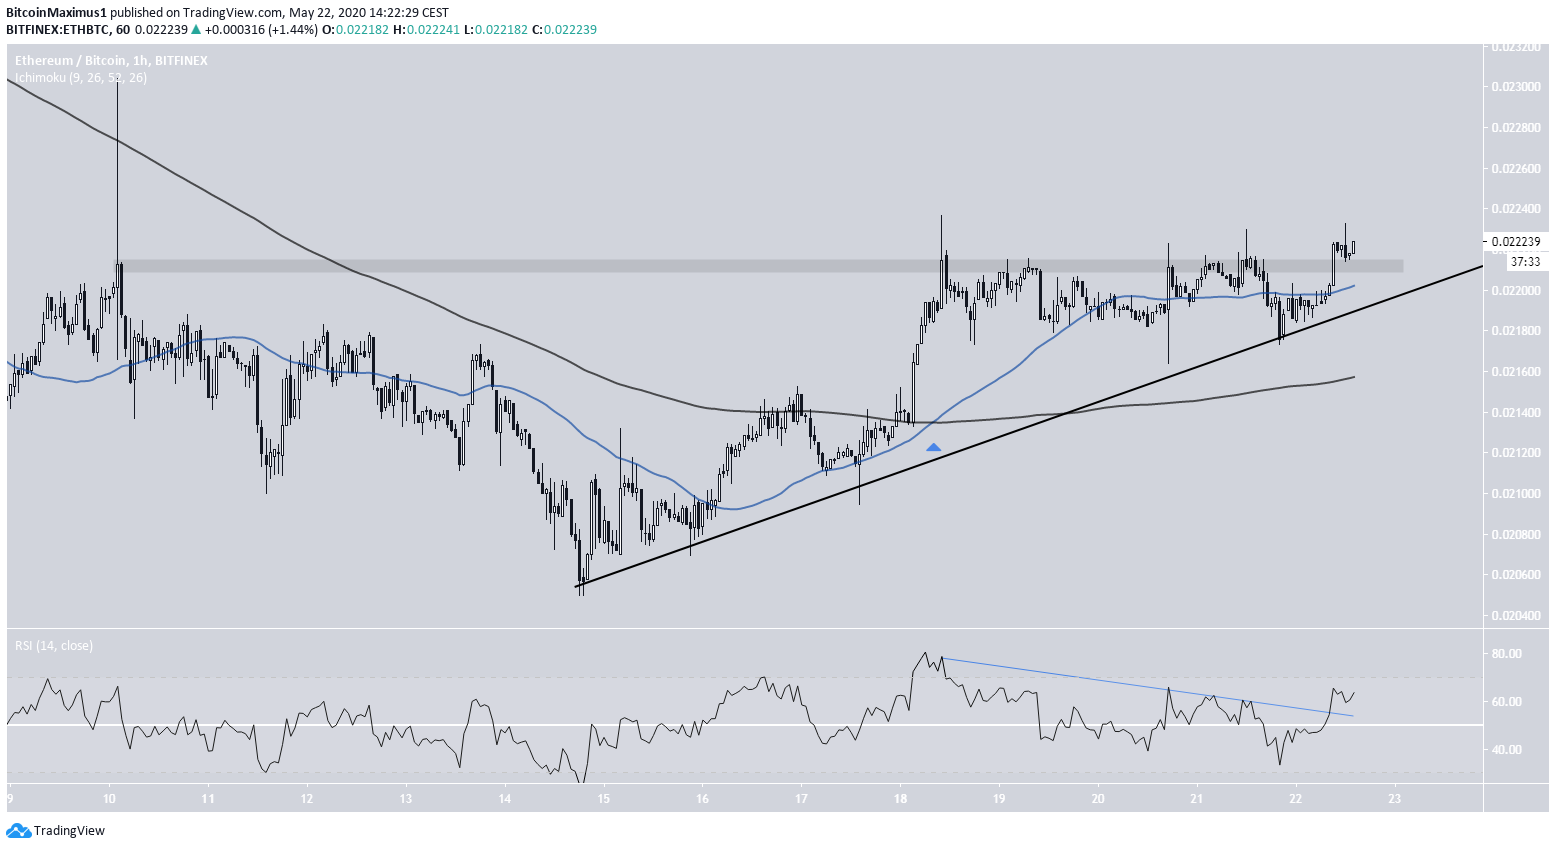
Ethereum/Bitcoin
The ETH/BTC chart looks bullish. First, it seems that the price has just broken out above the resistance area at ₿0.221. Furthermore, the RSI broke a descending resistance line and is moving upwards.
Finally, the 50- and 200-hour moving averages have made a bullish cross and the price is trading above both of them.
Therefore, ETH/BTC is expected to increase towards ₿0.225.