


The Ethereum (ETH) price is trading at a crucial diagonal and horizontal resistance level. A breakout above it could trigger a sharp increase.
ETH is the native token of the Ethereum blockchain, created by Vitalik Buterin. Last week, the supply deflation hit yet another new record. The Ethereum supply has decreased by $40 million since the Merge, which amounts to a reduction in supply of 32,600 ETH tokens.
Next, the number of staked Ethereum via liquid staking protocols is over seven million tokens. The biggest player is Lido, responsible for over 70% of the locked ETH.
Finally, a three-day Ethereum conference will be held in Zurich between April 14-16.
Bullish Weekly Candlestick Leads to New Yearly High
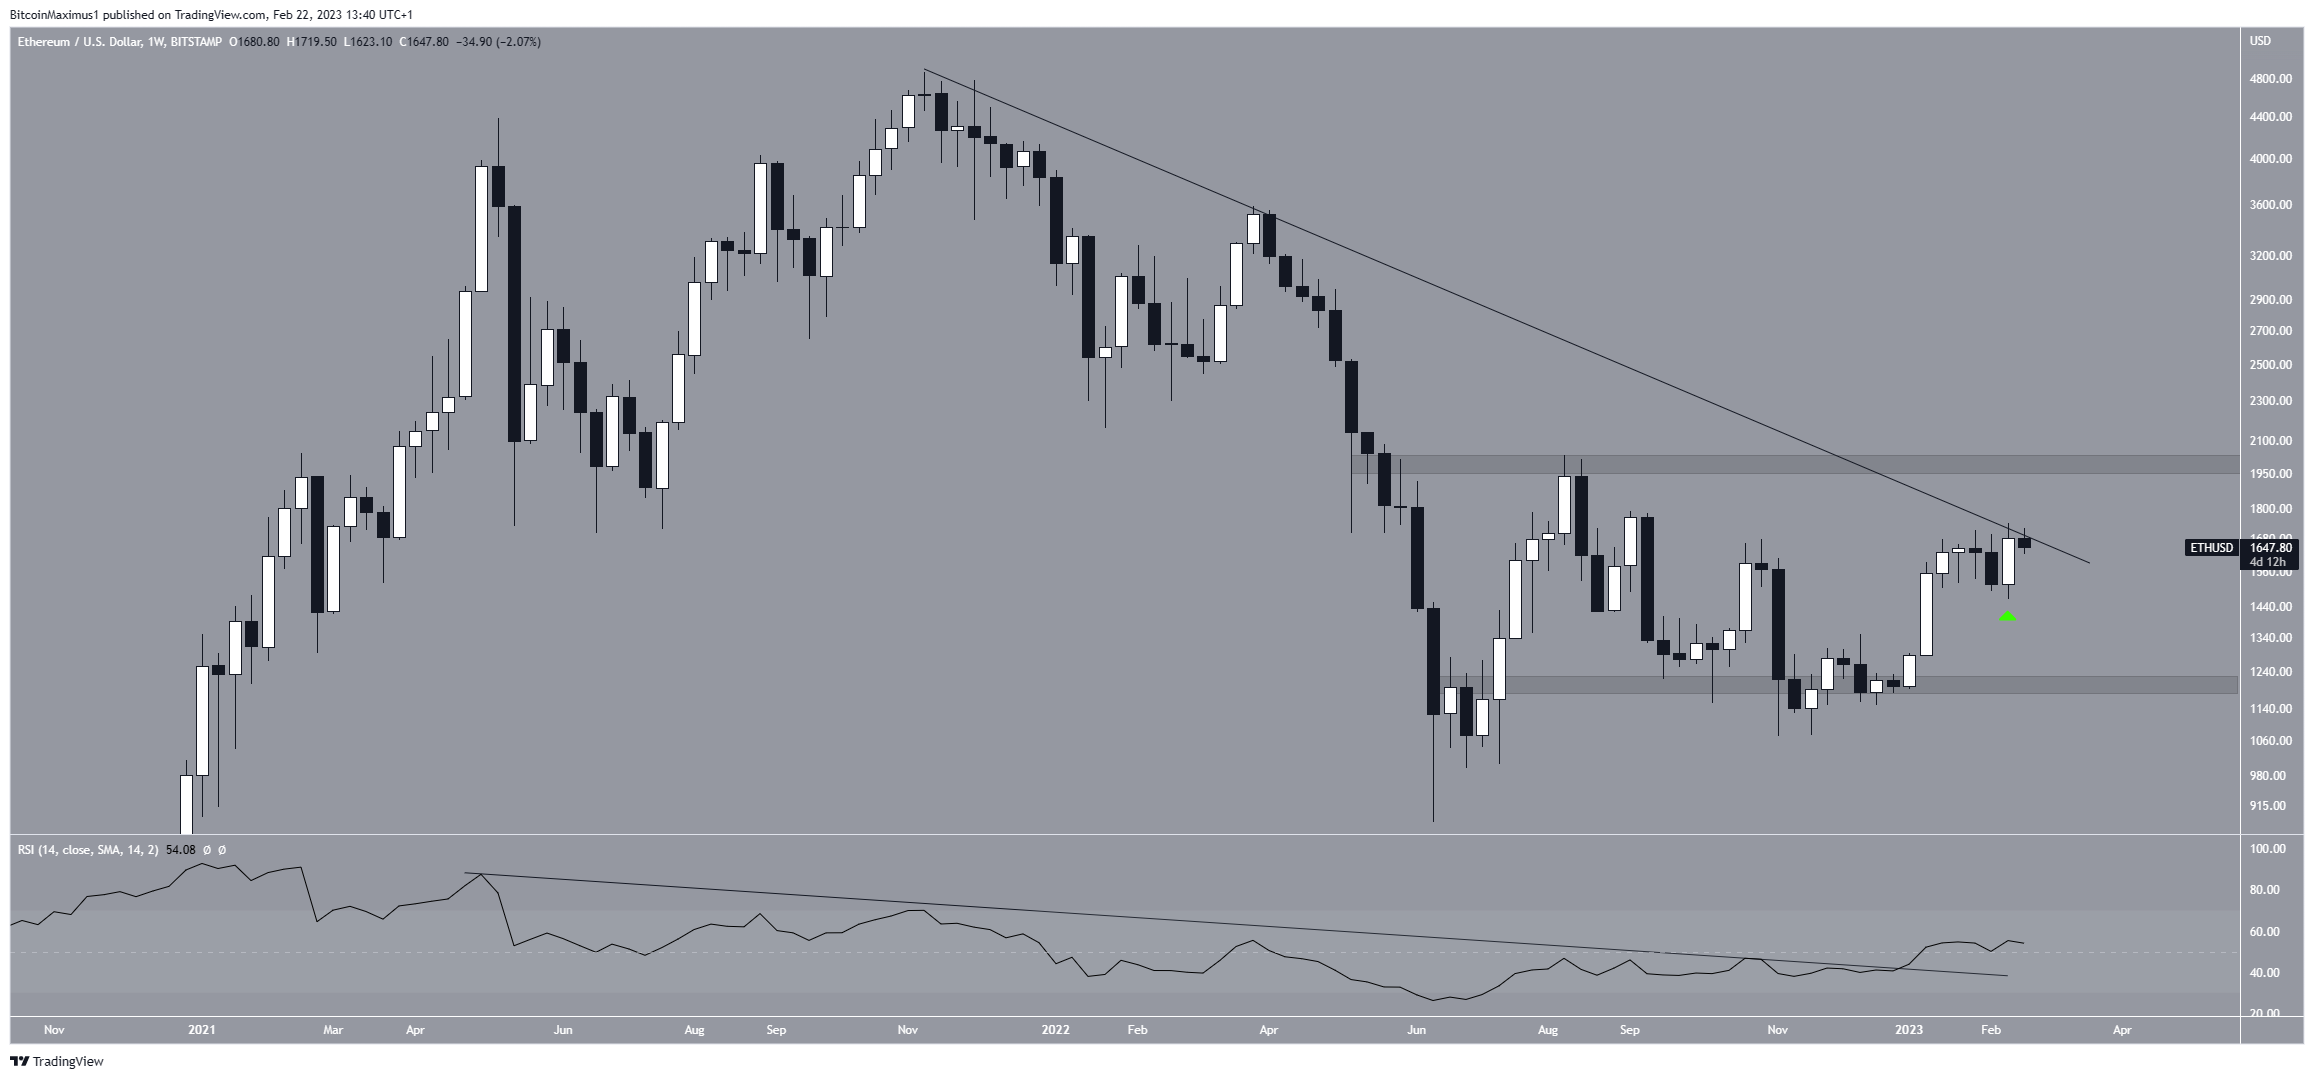
The weekly chart for Ethereum is relatively bullish. This was especially evident last week when the price created a bullish engulfing candlestick (green icon). However, the ETH price has not yet broken out from a descending resistance line which has been in place since the all-time high.
Nevertheless, the weekly RSI has broken out from its descending resistance line. This often precedes similar price breakouts. Therefore, the ETH price may break out and increase toward $2,000.
However, if a rejection occurs, the price of Ethereum could drop toward $1,200.
Ethereum (ETH) Price Trades at Crucial Level
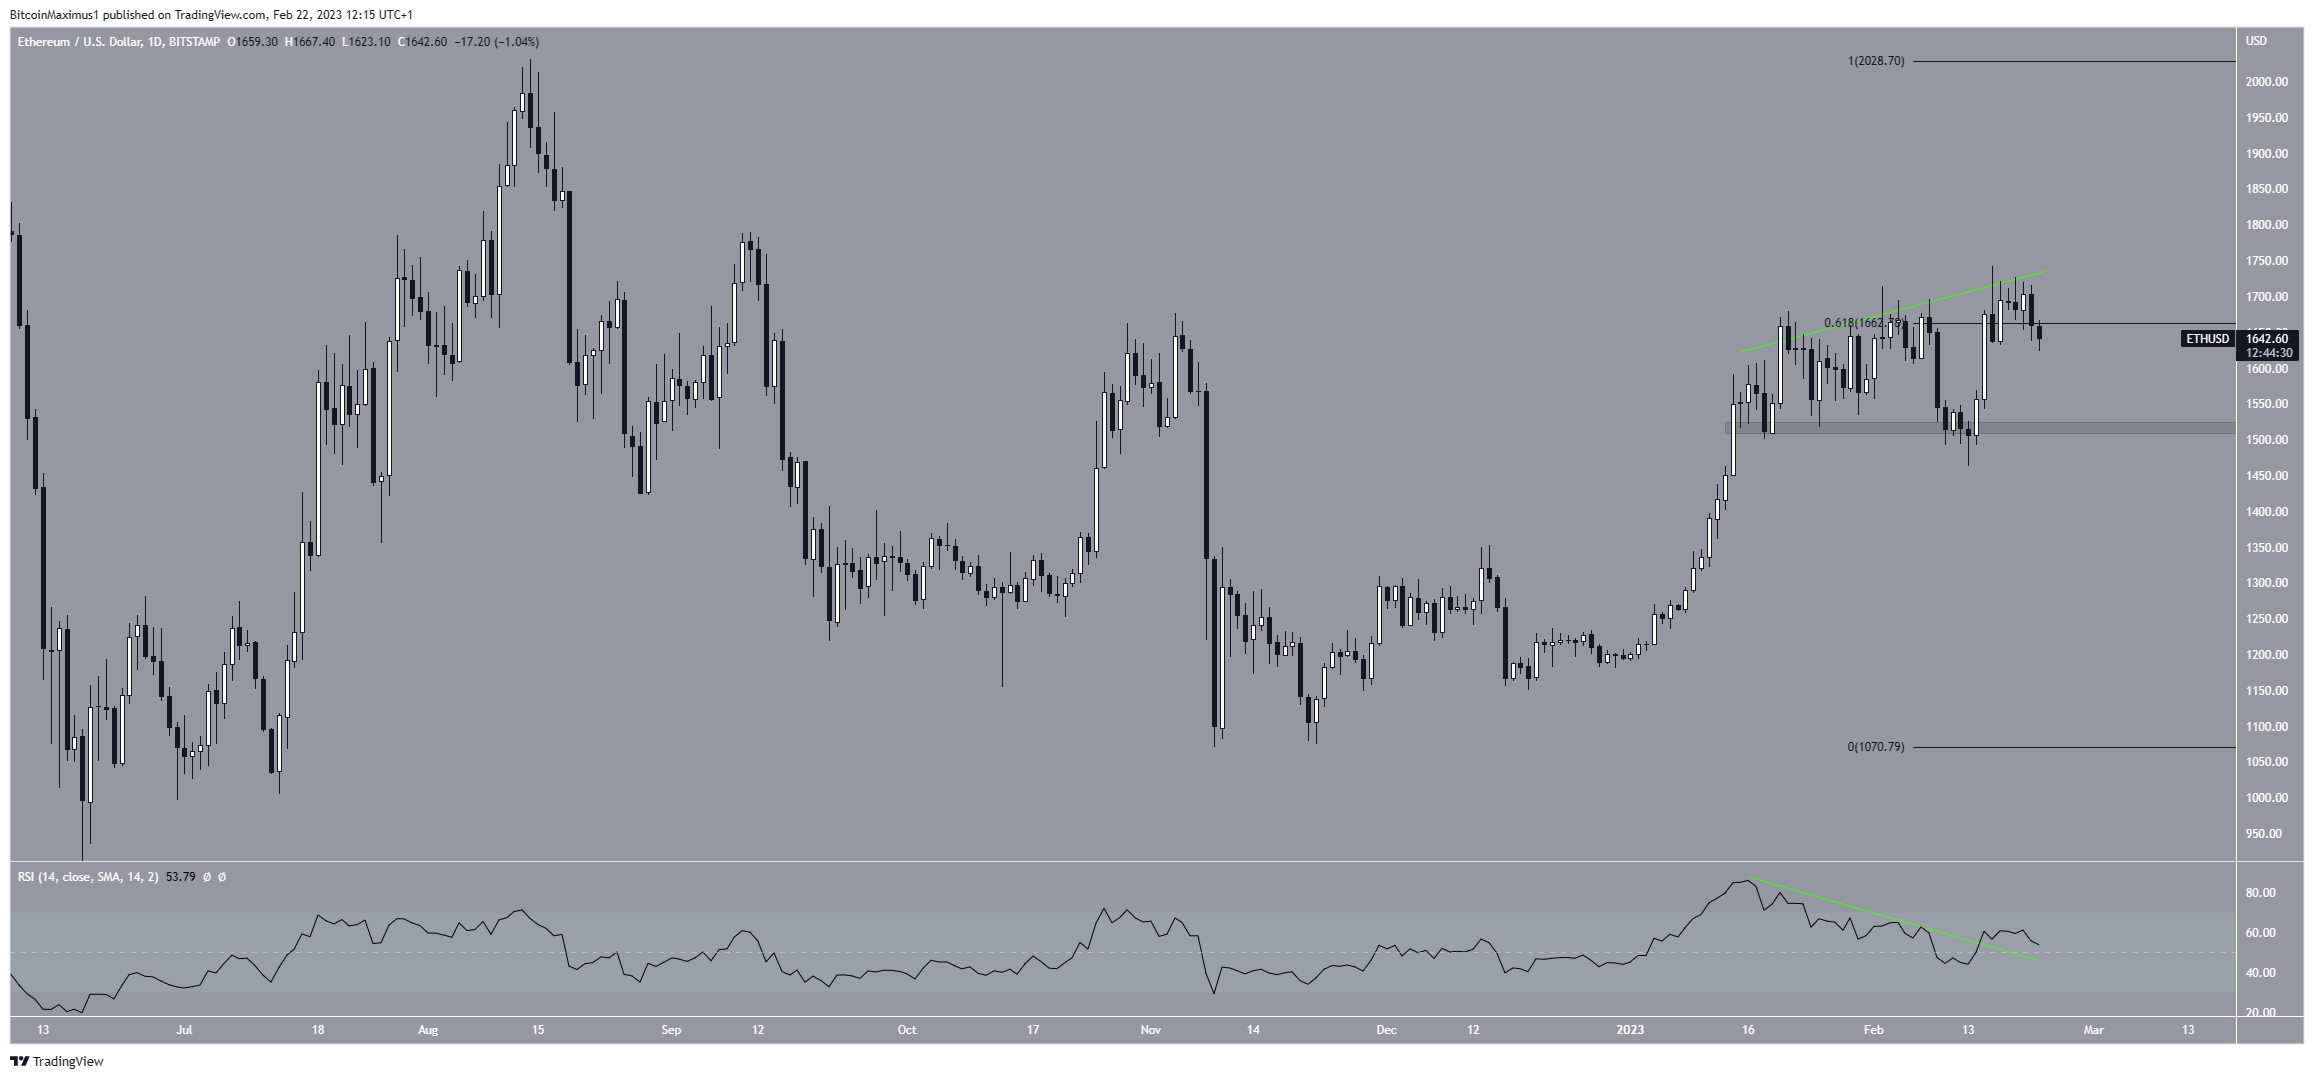
The Ethereum price trades inside the 0.618 Fib retracement resistance level at $1,660. This crucial level has acted as the main resistance since November 2022. Moreover, besides being a Fib resistance, it is also a horizontal resistance area. While the ETH price moved above it several times, it has failed to reach a close above this resistance.
Indicator readings are interesting. While the daily RSI generated bearish divergence (green line), it has now broken out from its bearish trend line. Since it is also above 50, the RSI reading can be considered bullish. If the ETH price continues to increase, the next resistance would be at $2,000. On the other hand, a rejection could lead to a drop toward the closest support at $1,520.
Due to the bullish readings from the weekly time frame and the RSI breakout, an increase toward $2,000 is the most likely scenario.
To conclude, the most likely Ethereum price forecast is an increase toward $2,000. However, a breakdown below $1,520 would negate this bullish outlook and could cause a fall toward $1,200.
For BeInCrypto’s latest crypto market analysis, click here.


