


The Ethereum (ETH) price created a bullish candlestick yesterday and could soon attempt breaking out above $1,650.
There was both negative and positive news for Ethereum this week. A report by DappRadar shows that the Ethereum network non-fungible token (NFT) market cap fell by 60% in 2022.
Ethereum’s founder Vitalik Buterin sent $150,000 in ETH to victims in Turkey and Syria. ETH, which is the native token of the Ethereum blockchain, price decreased considerably after whales sold 350,000 ETH tokens.
Ethereum Price Approaches Crucial Level
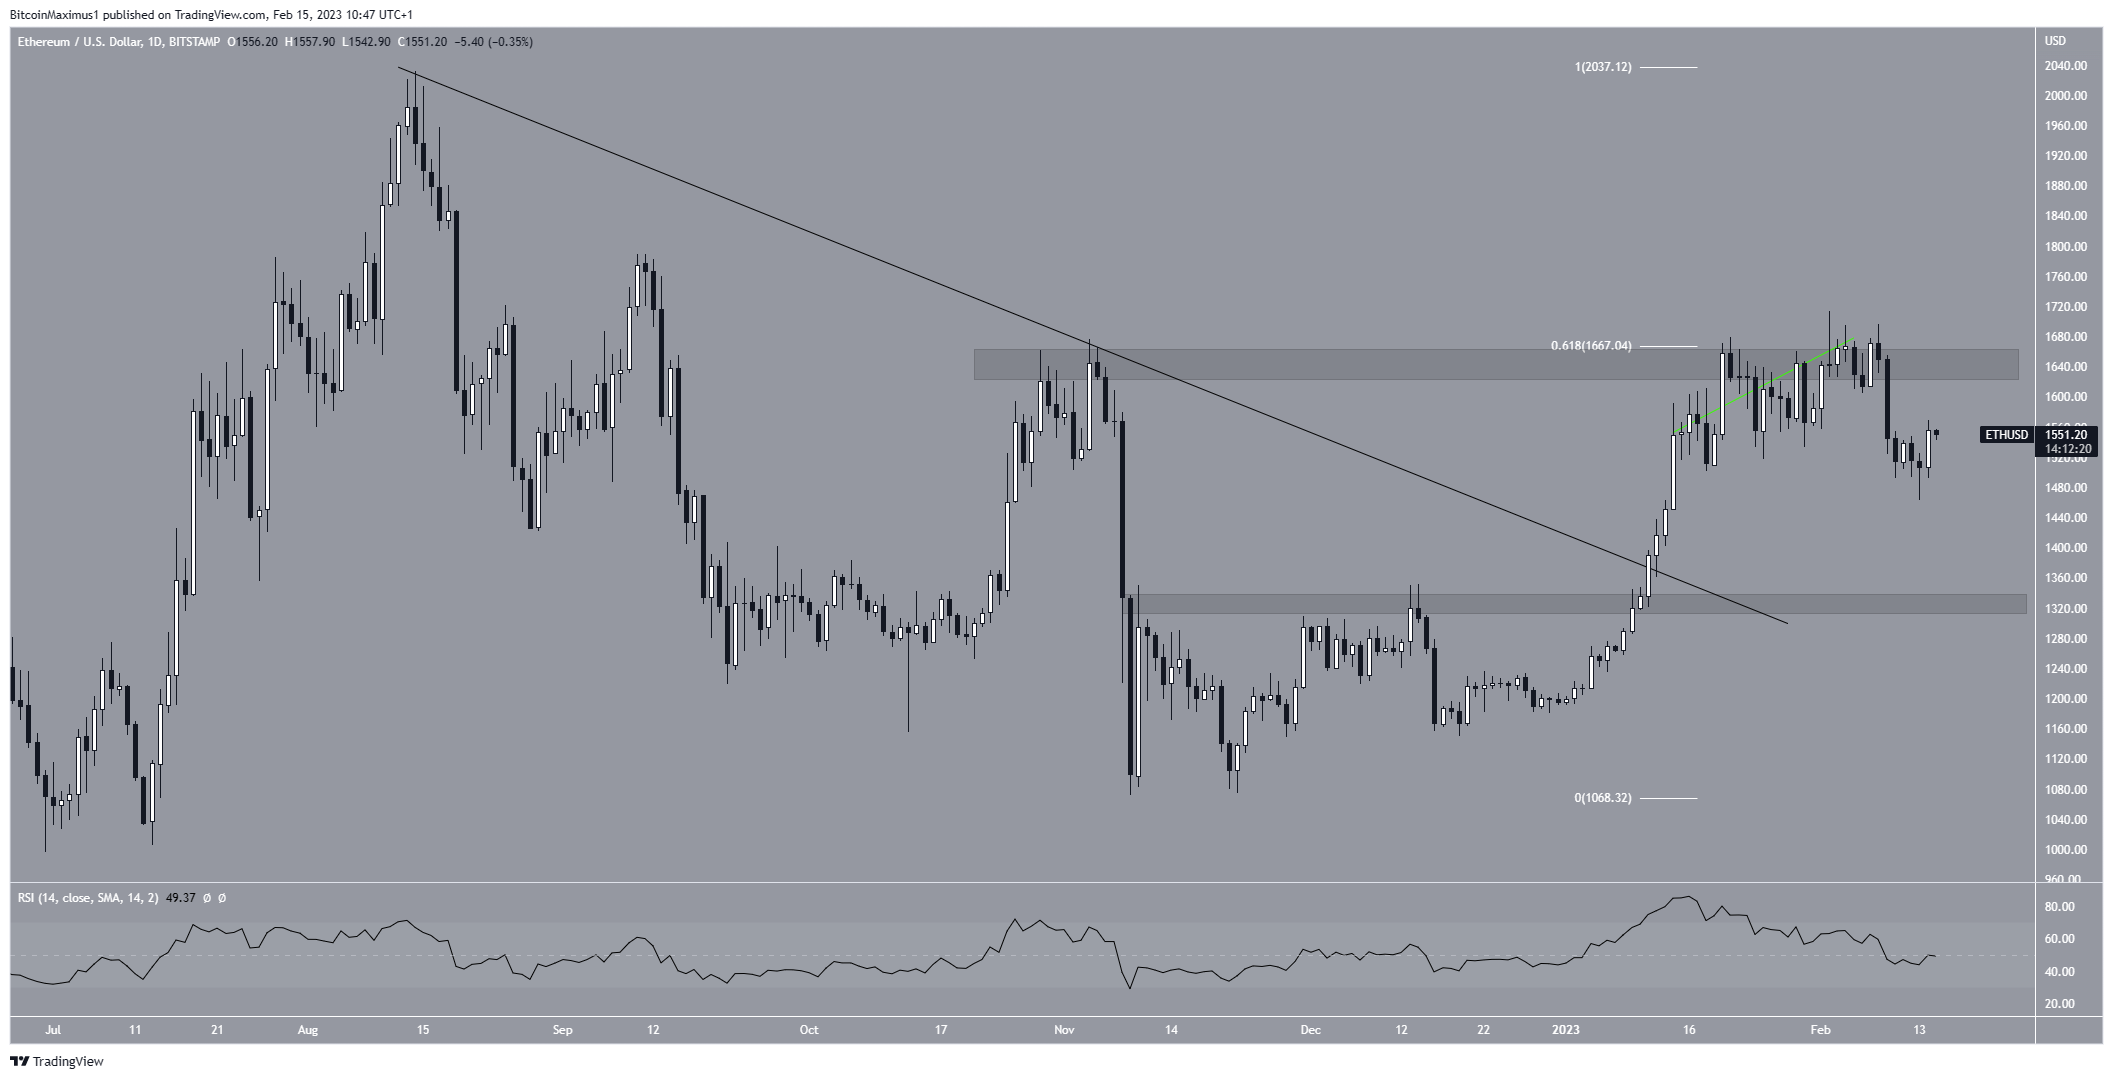
Since breaking out from a descending resistance line on January 11, the price of Ethereum has risen rapidly. The rise resulted in a high of $1,715 on Feb. 2. However, the ETH token price formed a shooting star candlestick (red icon), validating the $1,650 level as resistance. This is a critical resistance area because it is created by the 0.618 Fib retracement level as well as a horizontal resistance area.
The entire decrease was preceded by a bearish divergence in the daily RSI. Now, the indicator is at 50, a sign of a neutral trend. However, the price action over the last two days has been bullish. The ETH price created a bullish engulfing candlestick on Feb. 14, following a long lower wick the day before.
Therefore, the price may make another attempt at breaking out above $1,650. If successful, it could increase to $2,000.
On the other hand, if the movement loses momentum, the next closest support would be at $1,320.
Ethereum Price Gives Short-Term Bullish Signs
The four-hour chart provides two bullish signs.
Firstly, the price broke out from a descending resistance line. Secondly, the RSI generated bullish divergence. If the price breaks out above the current resistance at $1,560, it could increase toward the long-term resistance at $1,650.
On the other hand, if it breaks down below the descending resistance line, Ethereum could fall toward the $1,320 level.
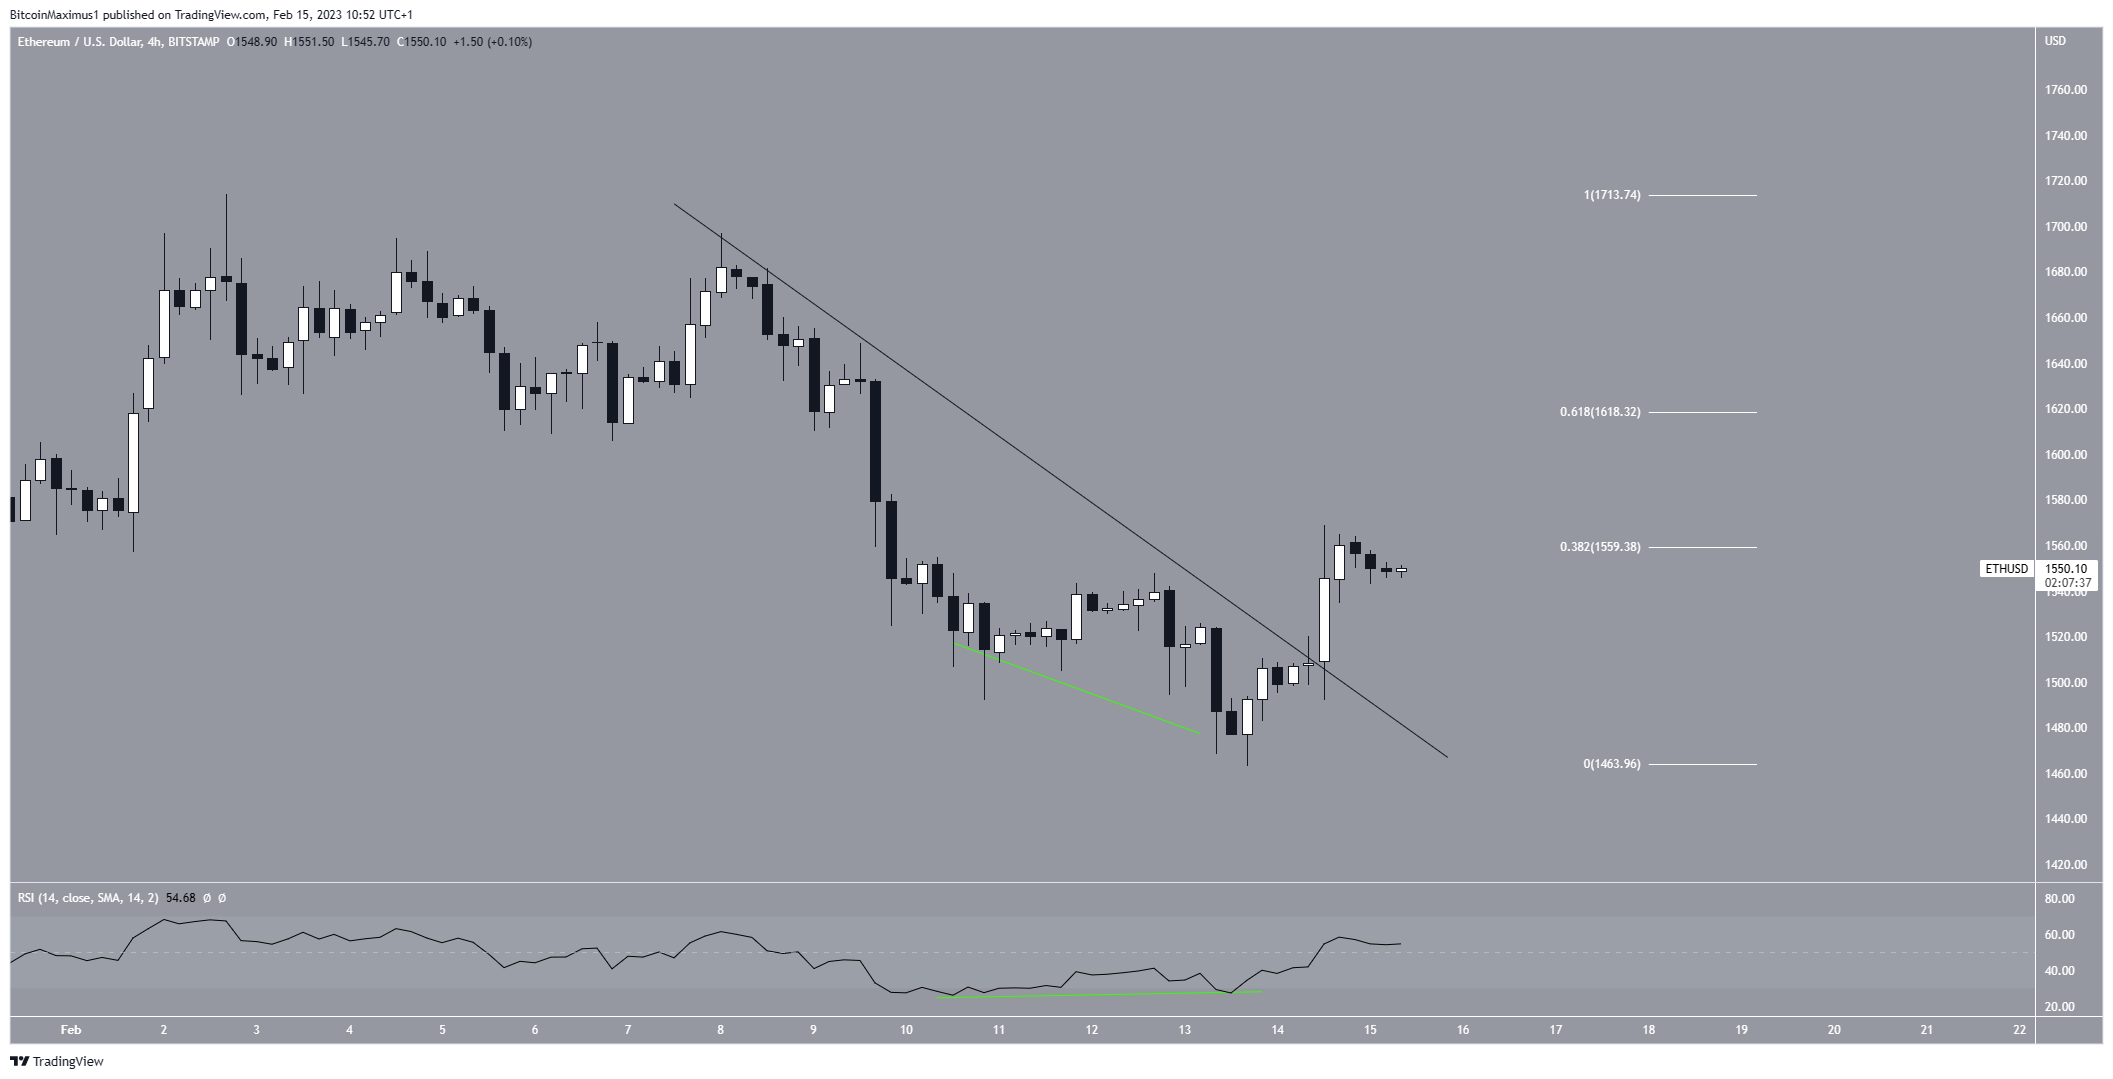
To conclude, the most likely ETH price forecast is an attempt at breaking out above $1,650. If successful, this could lead to an increase toward $2,000. On the other hand, if the ETH price breaks down below $1,450, it could fall to $1,320.
For BeInCrypto’s latest crypto market analysis, click here.



