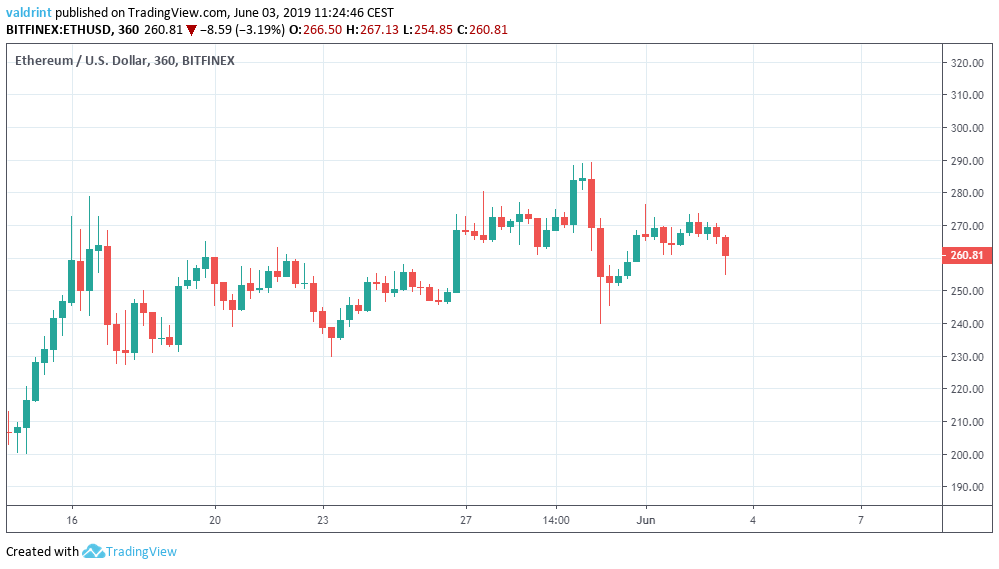
The Ethereum price (ETH) began an upward move on May 15. It reached a high of $279 the next day. After a gradual decrease, a slightly higher high of $289 was reached on May 30.
Since then, the price has been decreasing. Where will it go next? Keep reading to find out.
Ethereum Price: Trends and Highlights for June 3
- The Ethereum price reached a high of $289 on May 30.
- It is trading inside an ascending channel.
- There is bearish divergence developing in the RSI and the MACD.
- There is support near $228 and $202.
Ascending Channel
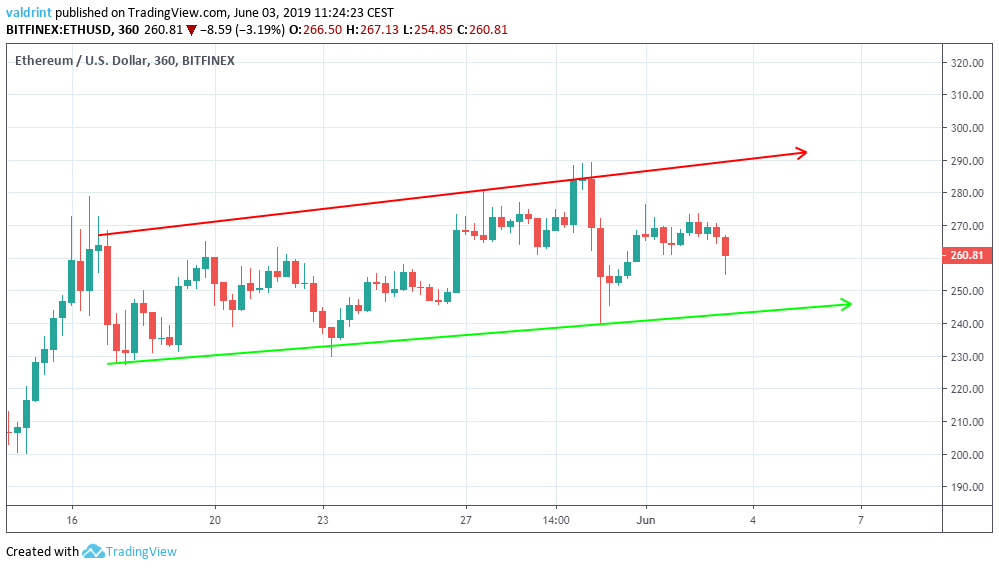
On May 16, ETH/USD reached a high of $279.1. A rapid decrease took it to a low of $227.2 the next day. The price has been increasing since, trading inside the ascending channel outlined below:
At the time of writing, the price was trading in the middle of the channel.
Will it reach move towards the support or resistance lines?
A look at technical indicators is required in order to answer that question.
Bearish Divergence
The Ethereum price is analyzed at daily intervals alongside the RSI and the MACD below:  The Ethereum price reached a high of $279.0 on May 15. Since then, it has been trading inside an ascending channel and has reached several higher highs.
However, both the RSI and the MACD have been generating lower values. This is known as bearish divergence and often precedes price decreases.
Furthermore, the MACD has made a bearish cross and is falling.
Finally, candlesticks with values higher than $270 have been characterized by long upper wicks. This has been especially evident during the highs of May 16 and 30, respectively. This is an indication that there is selling pressure in the market.
The use of these indicators makes it likely that the price will decrease towards the support line of the channel and eventually break down.
Reversal Areas
In case of a possible breakdown, two support areas are traced below:  The closest support is found near $228. This, however, is a minor support area and we do not believe it can initiate a reversal.
A more significant support area is found near $200. If the price breaks down from the channel, we believe it will eventually reach this area.
This, however, is not a short-term target, since the Ethereum price has been trading inside the channel for the past 18 days. Nevertheless, we believe that the price will reach the support line of the channel in the very near future.
Summary
To conclude, we believe that the price of Ethereum will soon begin to decrease, reach the support line of the channel, and eventually break down.
Do you think the Ethereum price (ETH) will break down from the channel? Let us know your thoughts in the comments below.
Disclaimer: This article is not trading advice and should not be construed as such. Always consult a trained financial professional before investing in cryptocurrencies, as the market is particularly volatile.
Disclaimer
In line with the Trust Project guidelines, this price analysis article is for informational purposes only and should not be considered financial or investment advice. BeInCrypto is committed to accurate, unbiased reporting, but market conditions are subject to change without notice. Always conduct your own research and consult with a professional before making any financial decisions. Please note that our Terms and Conditions, Privacy Policy, and Disclaimers have been updated.


