


Be[in]Crypto takes a look at the price movement for seven different cryptocurrencies, including Ethereum (ETH), which is trading inside a long-term symmetrical triangle.
BTC
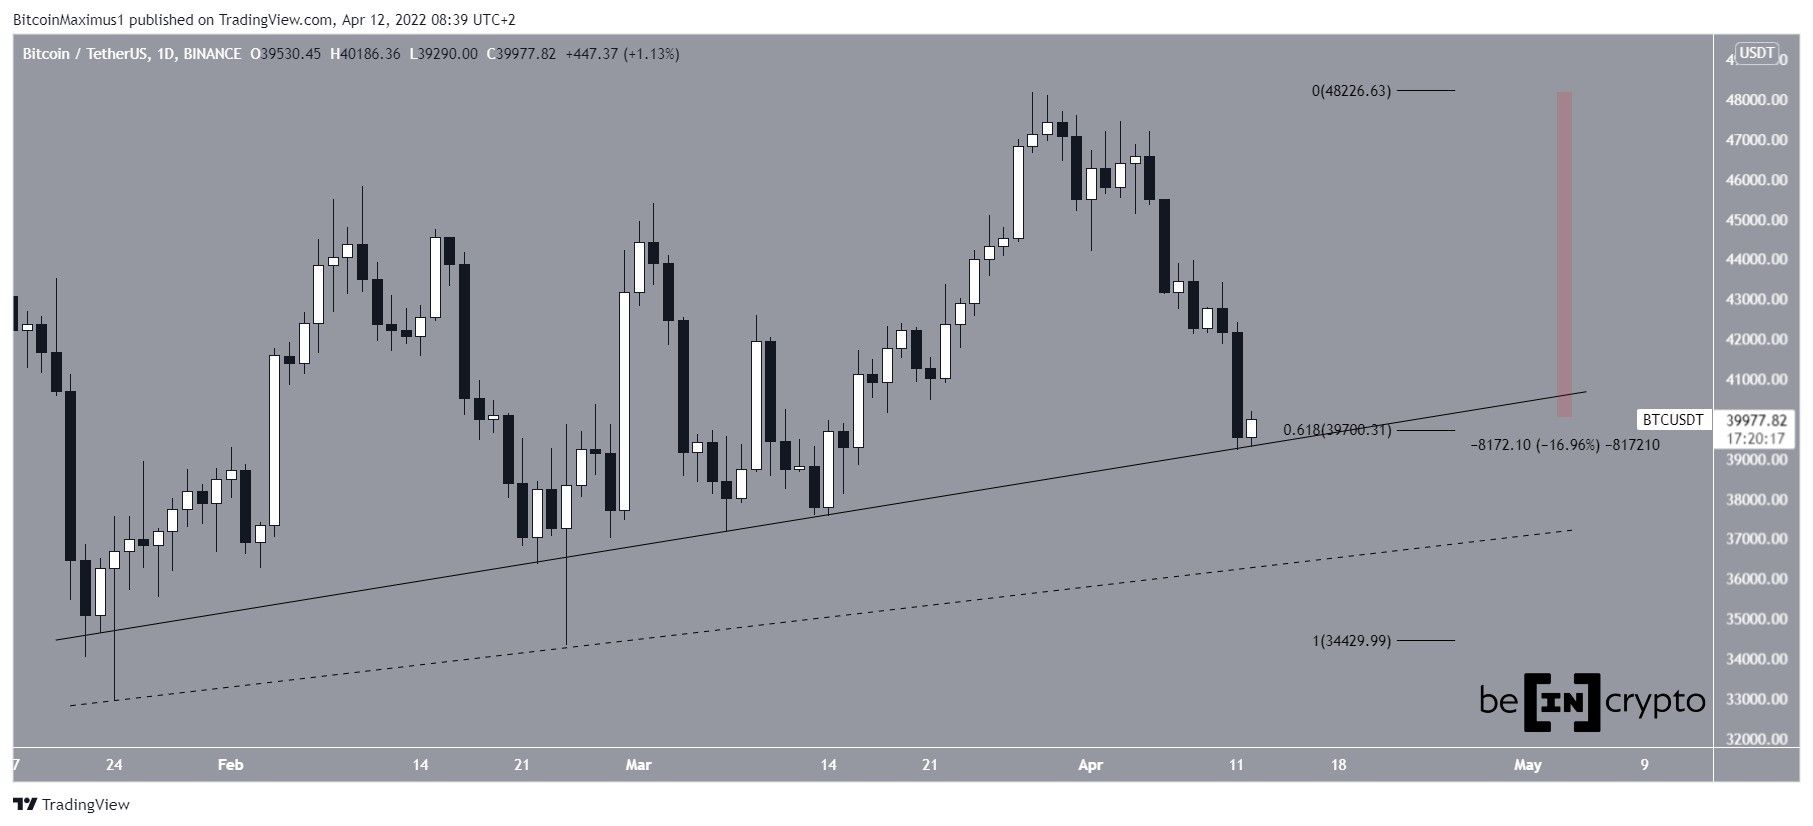
BTC has been falling since March 28. The downward movement has so far led to a low of $39,218 on April 11. This caused a bounce at an ascending support line and the 0.618 Fib retracement support level at $39,700.
However, an upward movement has yet to transpire.
Measuring from the March 28 high, BTC has decreased by 17%.
ETH
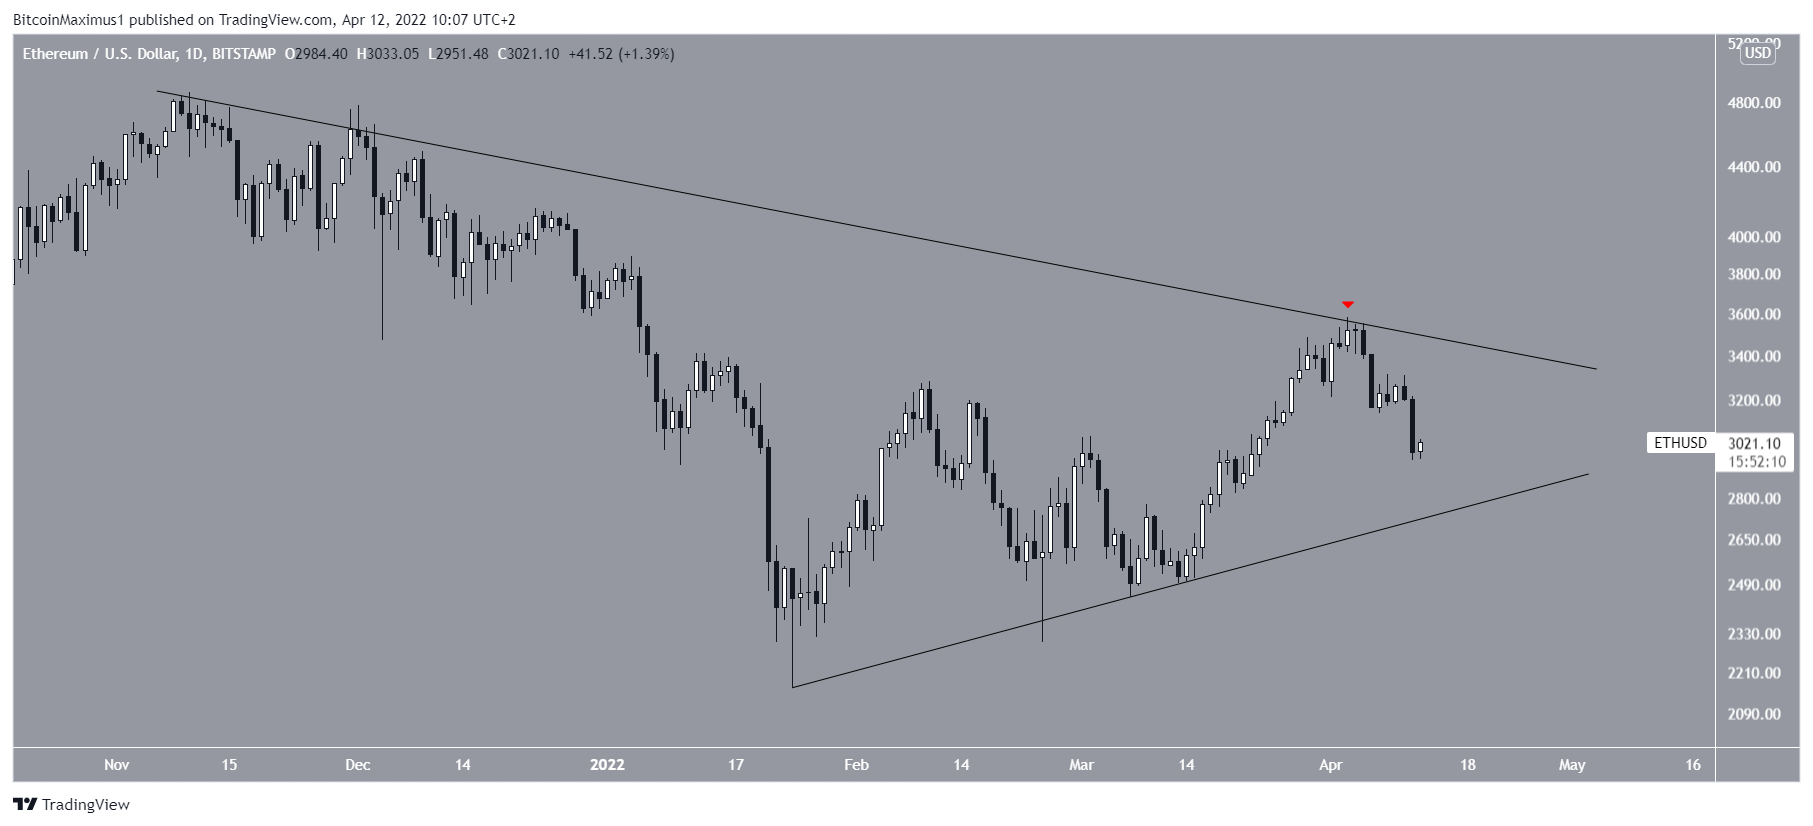
ETH has been falling since April 3. The rejection validated a descending resistance line (red icon) which has been in place since Nov 10.
So far, ETH reached a low of $2,948 on April 1.
If the downward movement continues, the closest support area would be at $2,800. This would validate an ascending support line that has been in place since the Jan bottom. When combined with the descending resistance line, it would also create a symmetrical triangle.
XRP
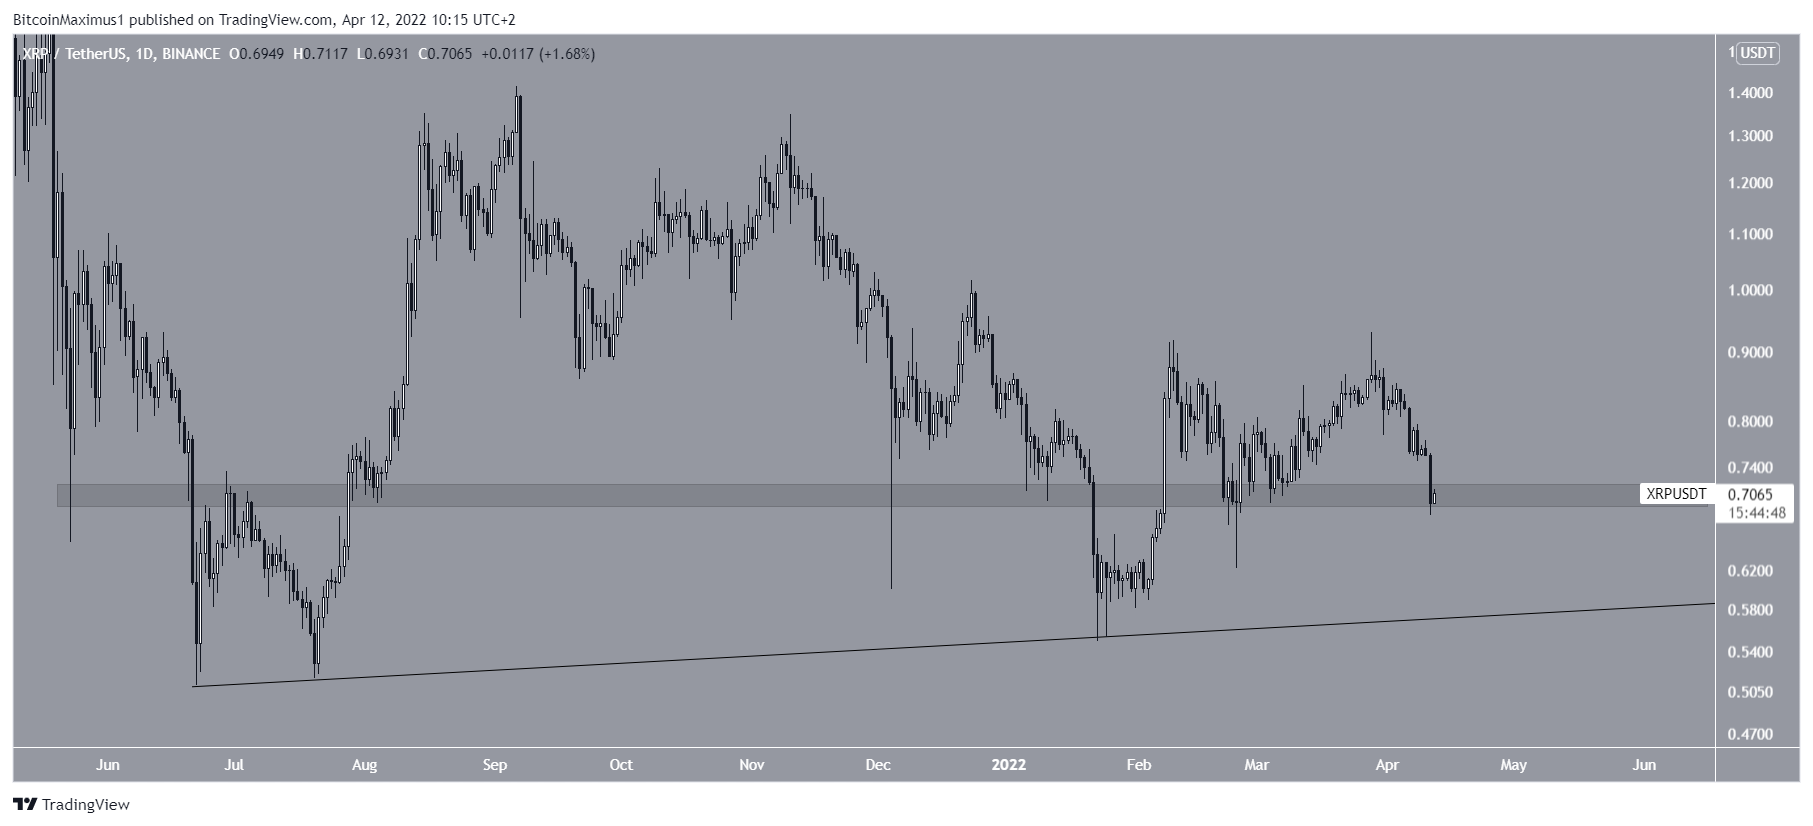
Similar to BTC, XRP has been falling since March 28. The downward movement has so far led to a low of $0.68 on April 11.
The low was made inside the $0.70 horizontal support area, where XRP is currently trading.
If the price breaks down from this area, the next closest support would be at $0.58. It is created by an ascending support line that has been in place since June 2021.
BADGER
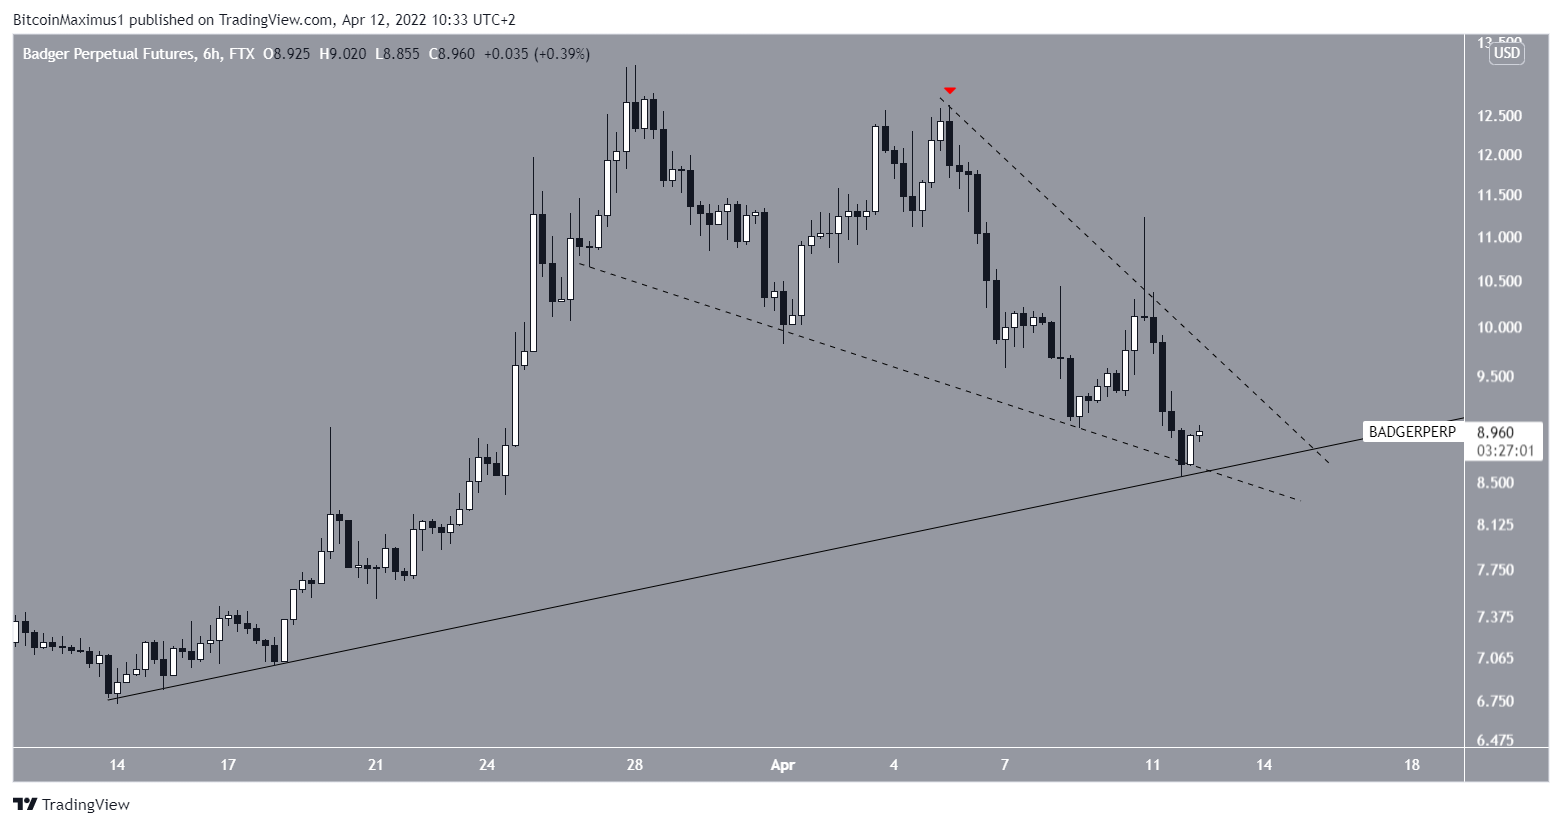
BADGER has been falling since reaching a high of $13.17 on March 28. It created a lower high on April 5 and accelerated its rate of decrease afterward.
The downward movement led to a low of $8.53 on April 11.
The price bounced afterward, potentially validating an ascending support line that has been in place since March 14.
It is also possible that BADGER is trading inside a descending wedge (dashed), which is considered a bullish reversal pattern. If so, an eventual breakout from it would be likely.
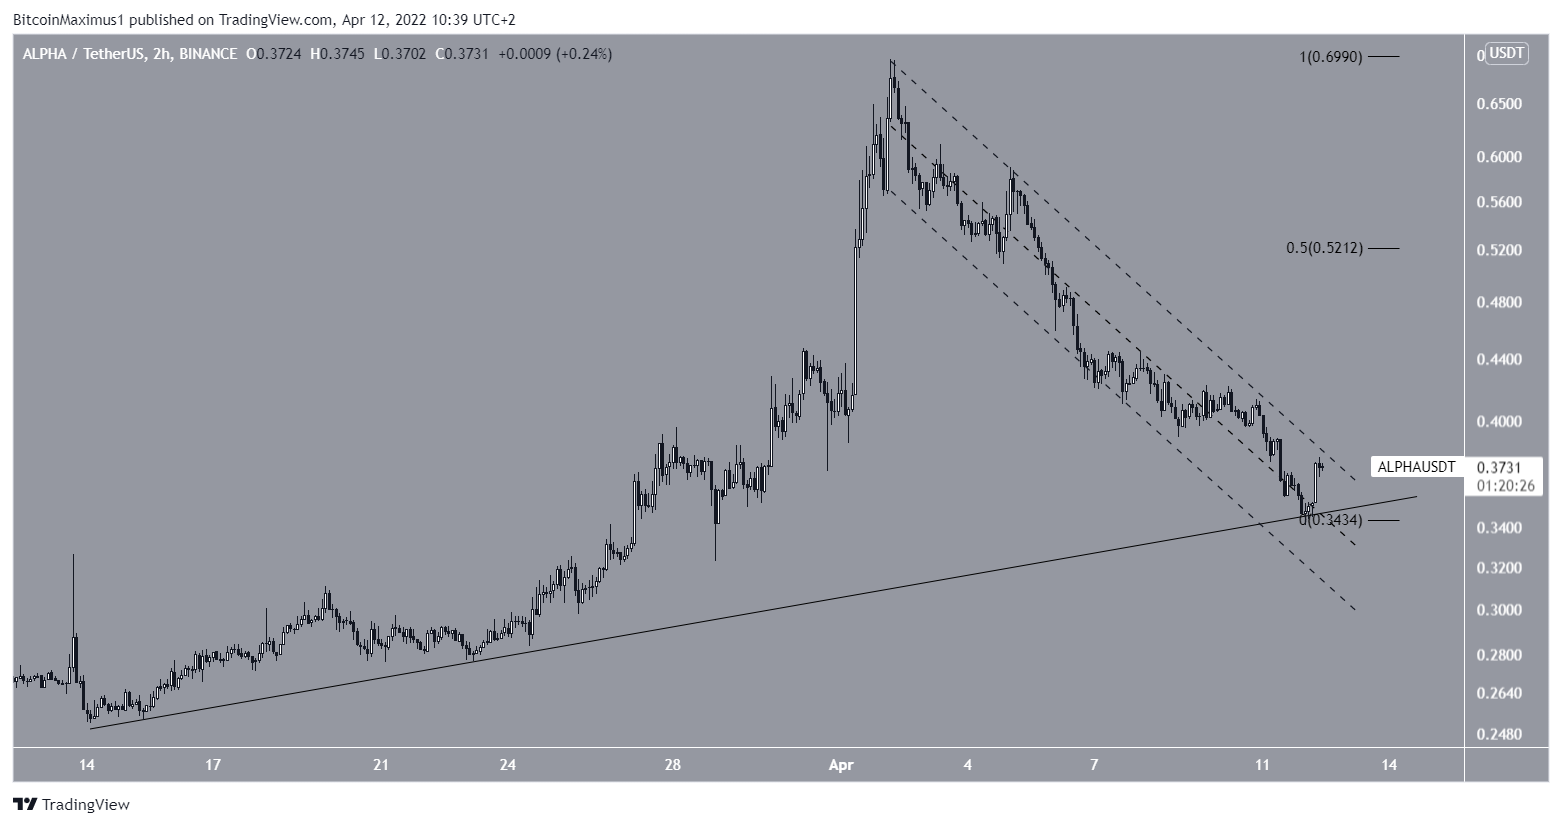
ALPHA
ALPHA has been falling inside a short-term descending parallel channel since April 2. The downward movement led to a low of $0.34 on April 12.
Descending parallel channels usually contain corrective movements. Therefore, an eventual breakout from it would be expected. If one occurs, the next closest resistance would be at $0.52, created by the 0.5 Fib retracement resistance level.
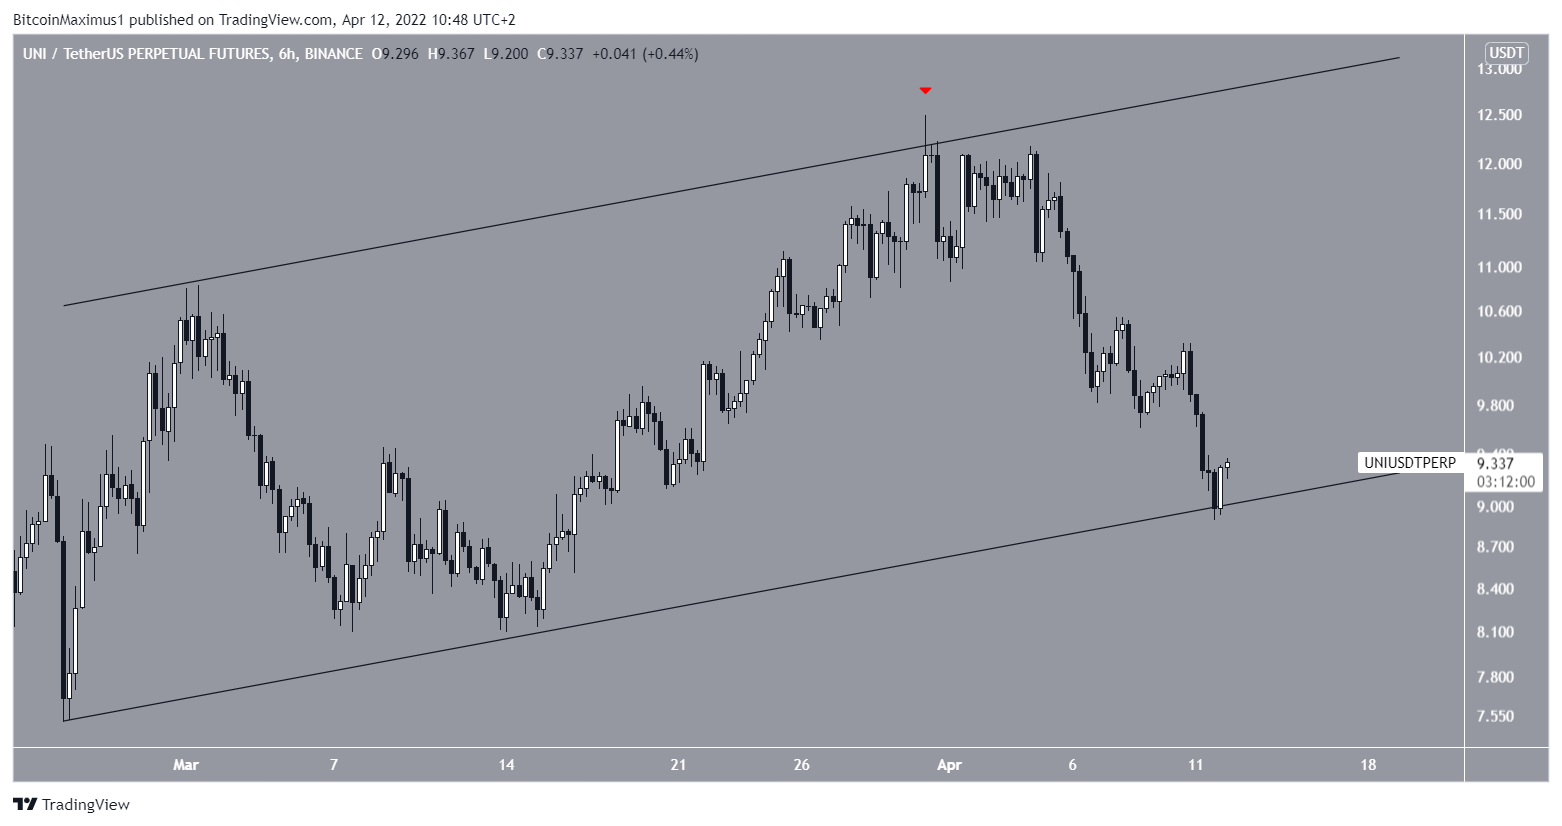
UNI
UNI has been increasing inside an ascending parallel channel since Feb 24. It was rejected by the resistance line of the channel on March 31 (red icon) and has been falling since.
The decrease led to a low of $8.89 on April 11. This caused the third validation of the support line of the channel.
A potential breakdown from the channel could lead to new yearly lows.
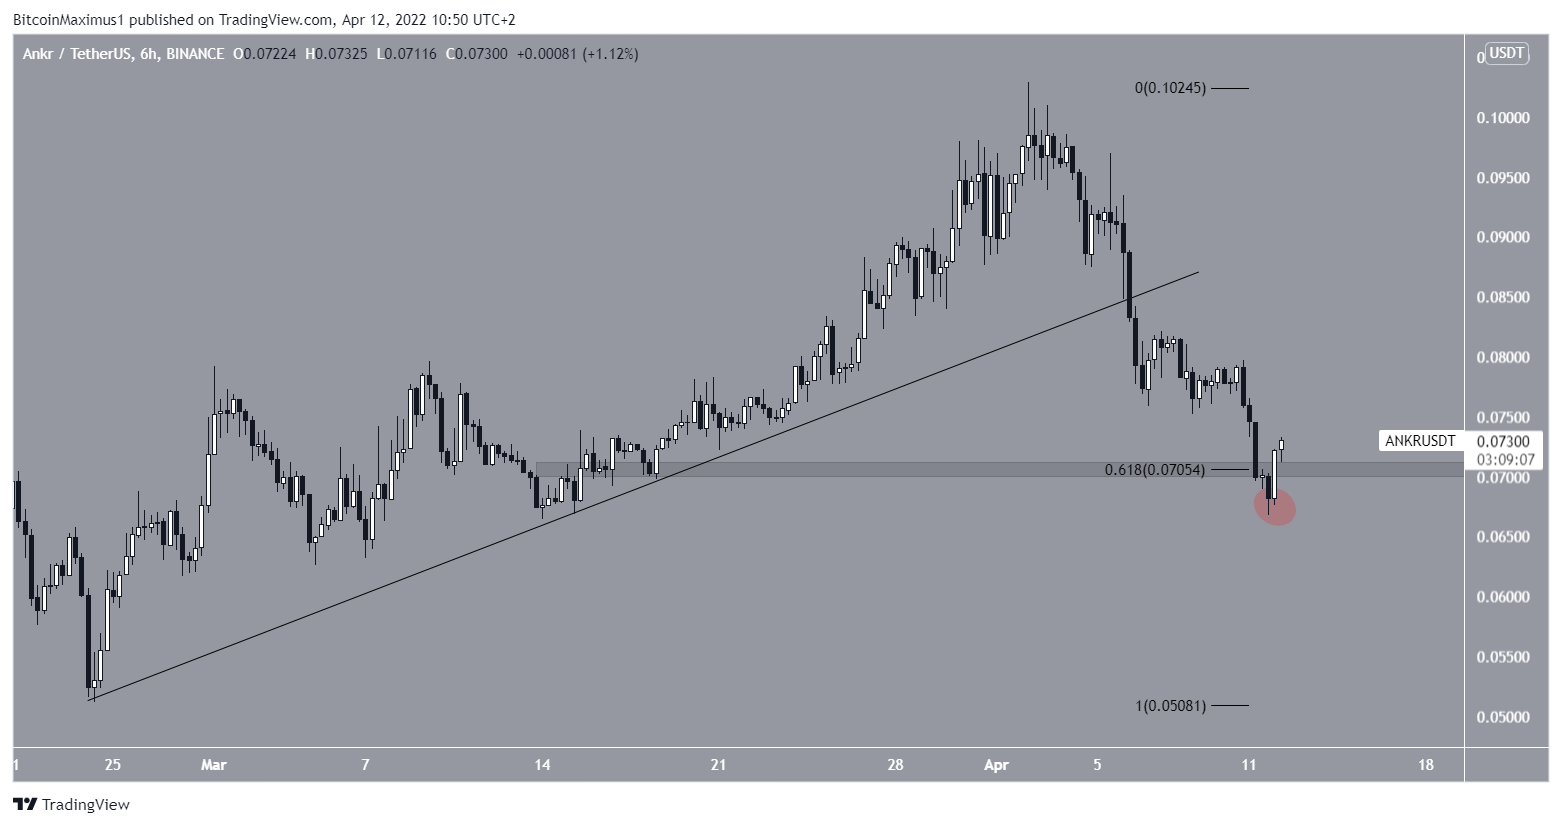
ANKR
ANKR had been increasing alongside an ascending support line since Feb 24. The upward movement led to a high of $0.10 on April 2.
However, the price has been falling since and broke down from the support line on April 6.
After bouncing below it, ANKR reclaimed the 0.618 Fib retracement support level of $0.07. If the area holds, this would be a bullish development.
For Be[in]Crypto’s latest Bitcoin (BTC) analysis, click here


