


The Ethereum price has reached a significant resistance area, and a breakout above would mark an end to the nearly seven-month downward trend.
The price has been increasing since December 18, having done so my slightly more than 30%. Failure to break out above this resistance area would mark an end to the short-term upward move and initiate a price correction.
Technical Analyst & Chartist @TheCryptoCactus outlined the Ethereum price and stated that it has likely reached a bottom since it has turned the $142 area into strong support. While he expects strong resistance near $150, the long-term trend should be bullish.
$ETH Update
This chart has been a blessing for the past few weeks, clear now that price has turned the $142 region into support. The chance that price has already bottomed is very high…
Expect $150 to be strong resistance, but overall still expecting the macro trend to be up. pic.twitter.com/vWf43Jj3pB
— Cactus (@thecryptocactus) January 14, 2020
Will Ethereum break out above $150? If so, how high will it increase? Keep reading below if you are interested in finding out.
Descending Channel
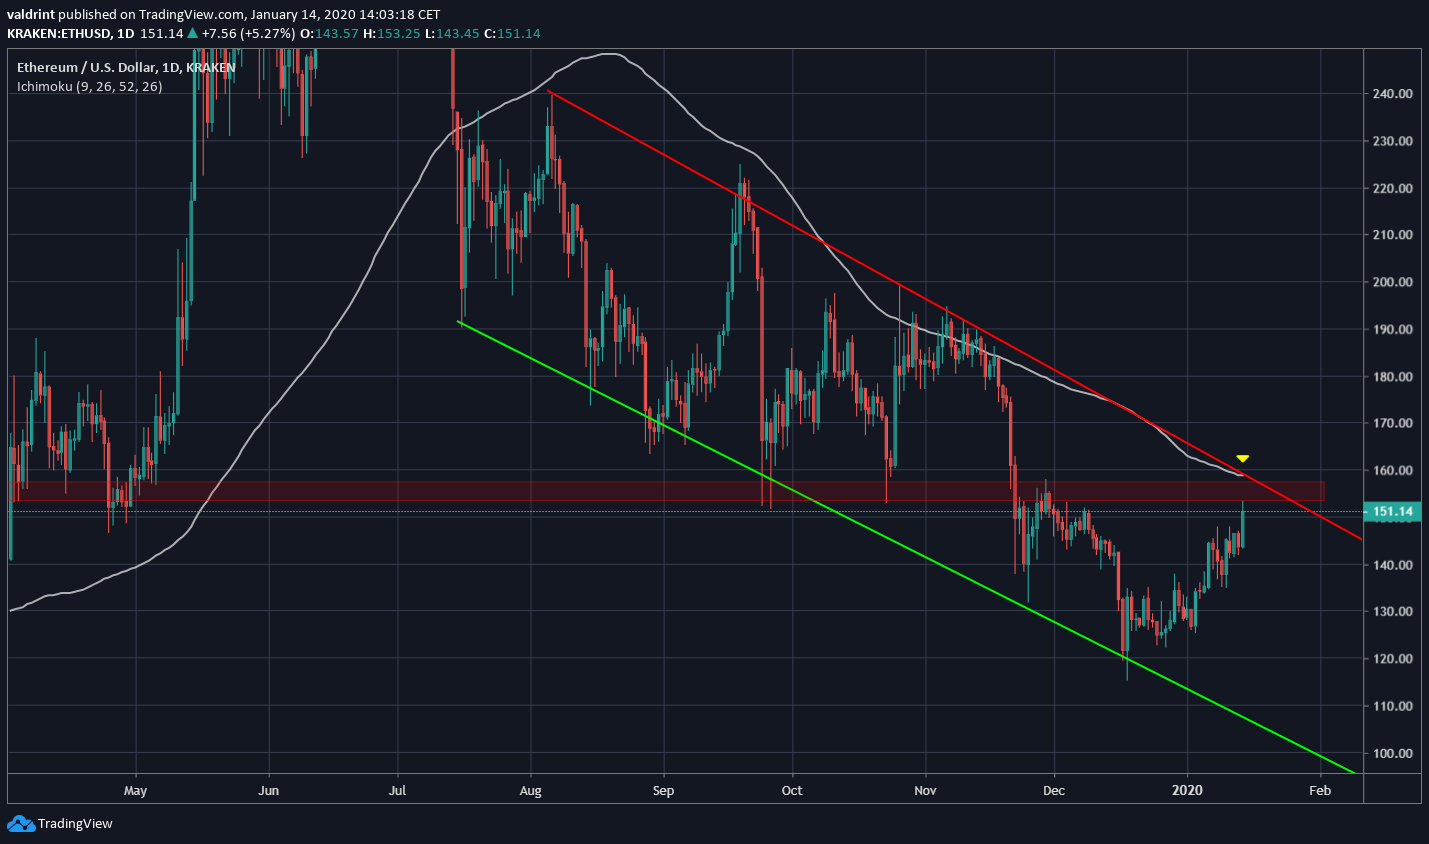
The Ethereum price has been trading inside a descending channel since July 16, 2019. Both the resistance and support lines have been validated several times.
The resistance area outlined in the tweet is very significant but seems to be closer to $155 than $150. However, this should vary slightly from one exchange to another.
In addition to having previously acted as support, it also coincides with the 100-day moving average (MA) and the descending resistance line of the channel. A breakout above it would confirm that the downward trend throughout the descending channel has come to an end.
Ethereum Parabolic Support
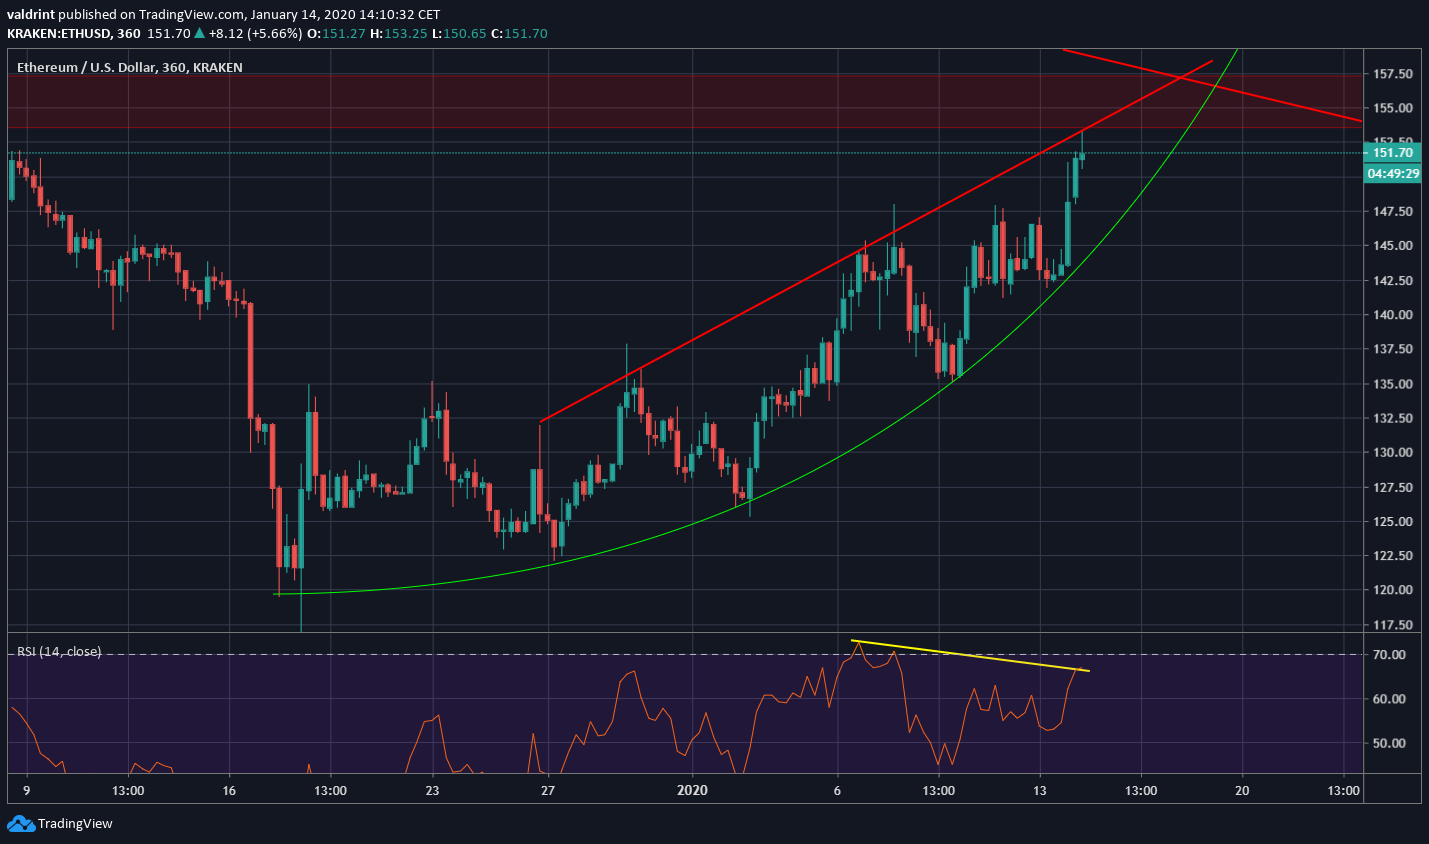
Since the upward move began, the ascending support line has become parabolic, which is unsustainable in the long-run. On top of this, the price is following an ascending resistance line. Both lines will soon coincide with the $155 resistance line.
Therefore, the most likely scenario is that the price continues to increase inside this pattern until it reaches $155 and then breaks down. This scenario is supported by the growing bearish divergence in the RSI, which is visible up until the six-hour time-frame.
If the price breaks down, which seems likely, the area that is expected to provide support to the price is found at $136. Afterward, the ETH price should make another attempt at breaking out.
In our previous long-term analysis, we stated that ETH will likely be in a bullish market in 2020, a possibility that would be confirmed by a breakout above the descending channel. While this has yet to occur, we believe the price will soon break out.
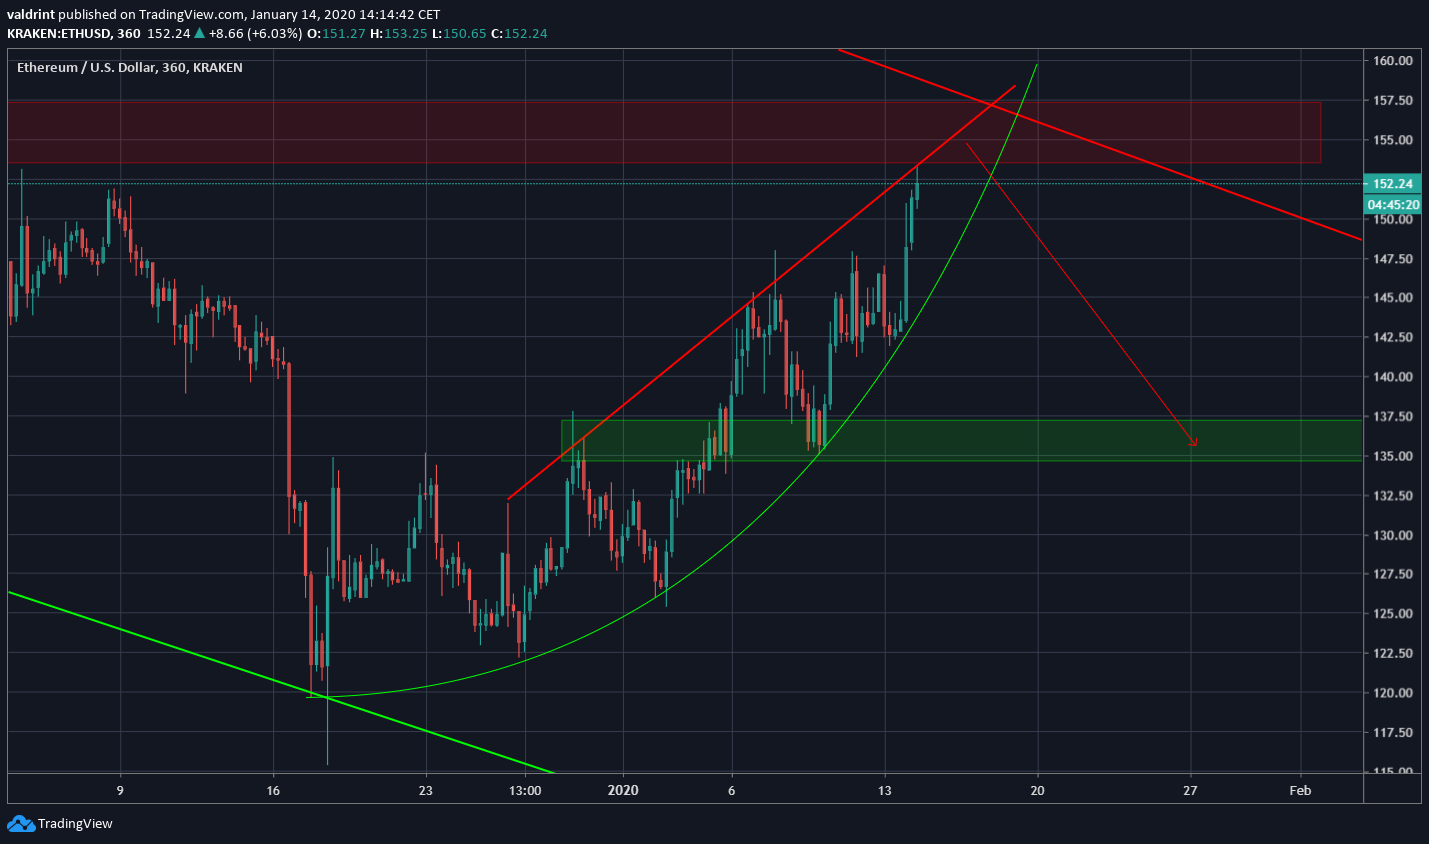
To conclude, the Ethereum price has reached a significant resistance area, out of which we do not believe it will break out on the first try. To the contrary, the price is likely to decrease towards $136, before making another attempt at breaking out.


