


![Will Ethereum’s Bullish Market Cycle Begin In 2020? [Premium Analysis]](/_mfes/post/_next/image/?url=https%3A%2F%2Fassets.beincrypto.com%2Fimg%2FWpnO77ntkQWr4voU5DN09urRYhA%3D%2Fsmart%2Fda48c08ab780447ca9301c0a31a5289f&w=1920&q=75)
The Ethereum price has reached a significant support area. In order for the price to confirm its bottom, a breakout above the descending channel would be necessary.
The Ethereum price has decreased by 62 percent since June 26. It has reached a strong support area which is a very suitable level for the initiation of a reversal. However, technical indicators have yet to confirm this possibility.
Cryptocurrency trader and analyst @davethewave tweeted that the believes that the ETH price has possibly finished correcting and might have reached a bottom. The main reasons for this were the touch of the 0.786 Fib level with a long lower wick and the average rate of increase.
Freebie from my alts page.
And that ladies and gentlemen may have been the bottom in ETH. May it be a happy and prosperous new year.🥳 pic.twitter.com/TJZW4SNbLe
— dave the wave🌊🌓 (@davthewave) December 30, 2019
Let’s take a closer look at the ETH price and determine if the price has actually reached a bottom or if it will continue decreasing further.
Long-Term Ethereum Bottom
The weekly chart outlines the entire upward move that began in December 2018. After the Ethereum price reached a high of $360, it began the current correction which is still ongoing.
The price has reached the 0.786 Fib level at $130 and created two lower wicks in a row. Besides being Fib support, this area previously supported the price in February/March 2019.
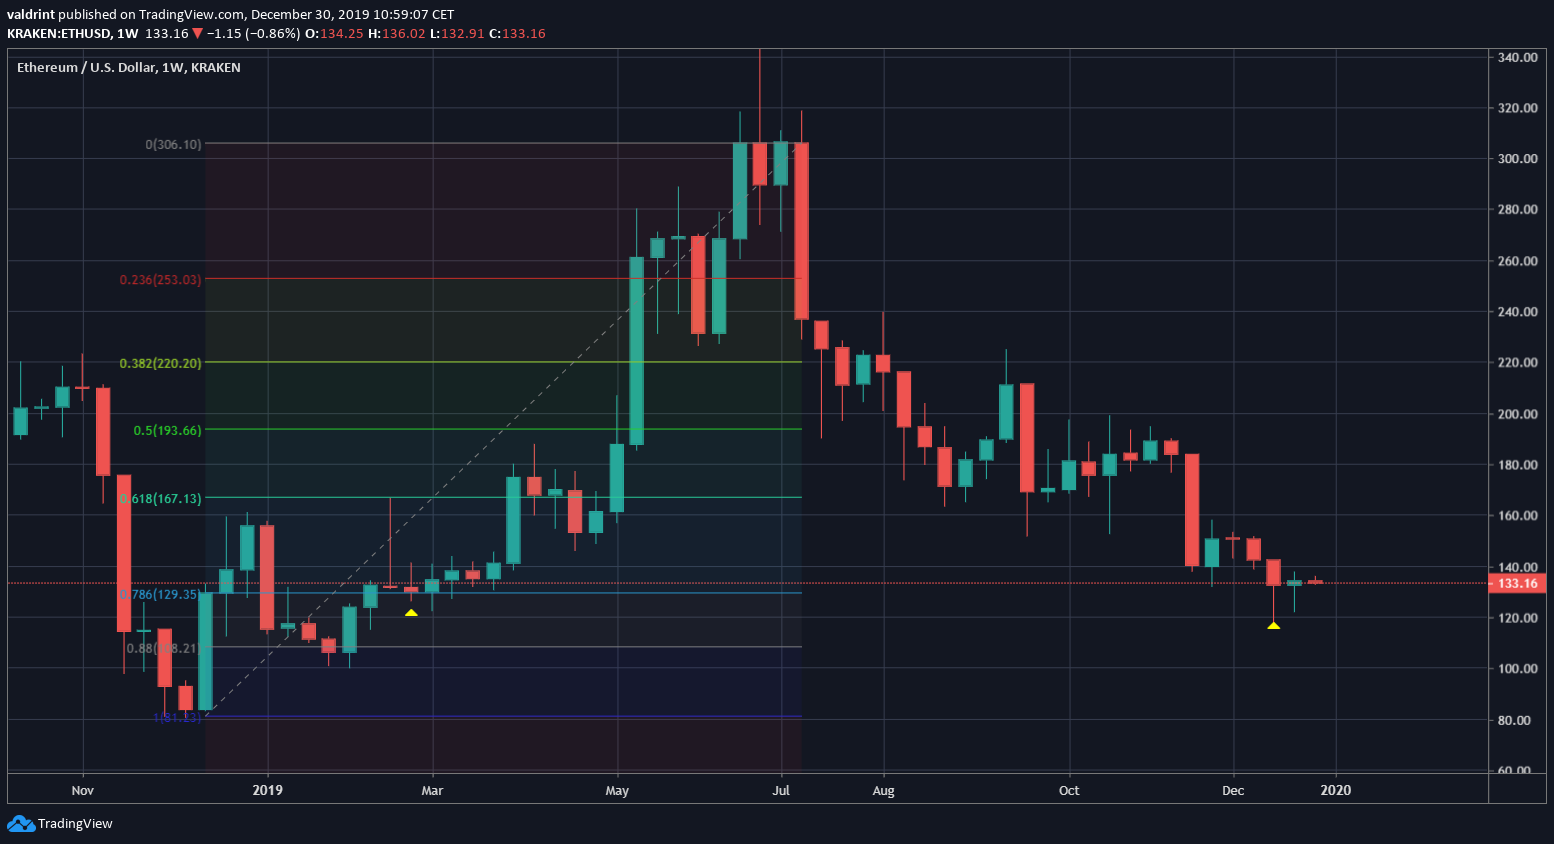
The RSI shows that while the Ethereum price is likely to make a bottom soon, we still do not have confirmation that it has done so.
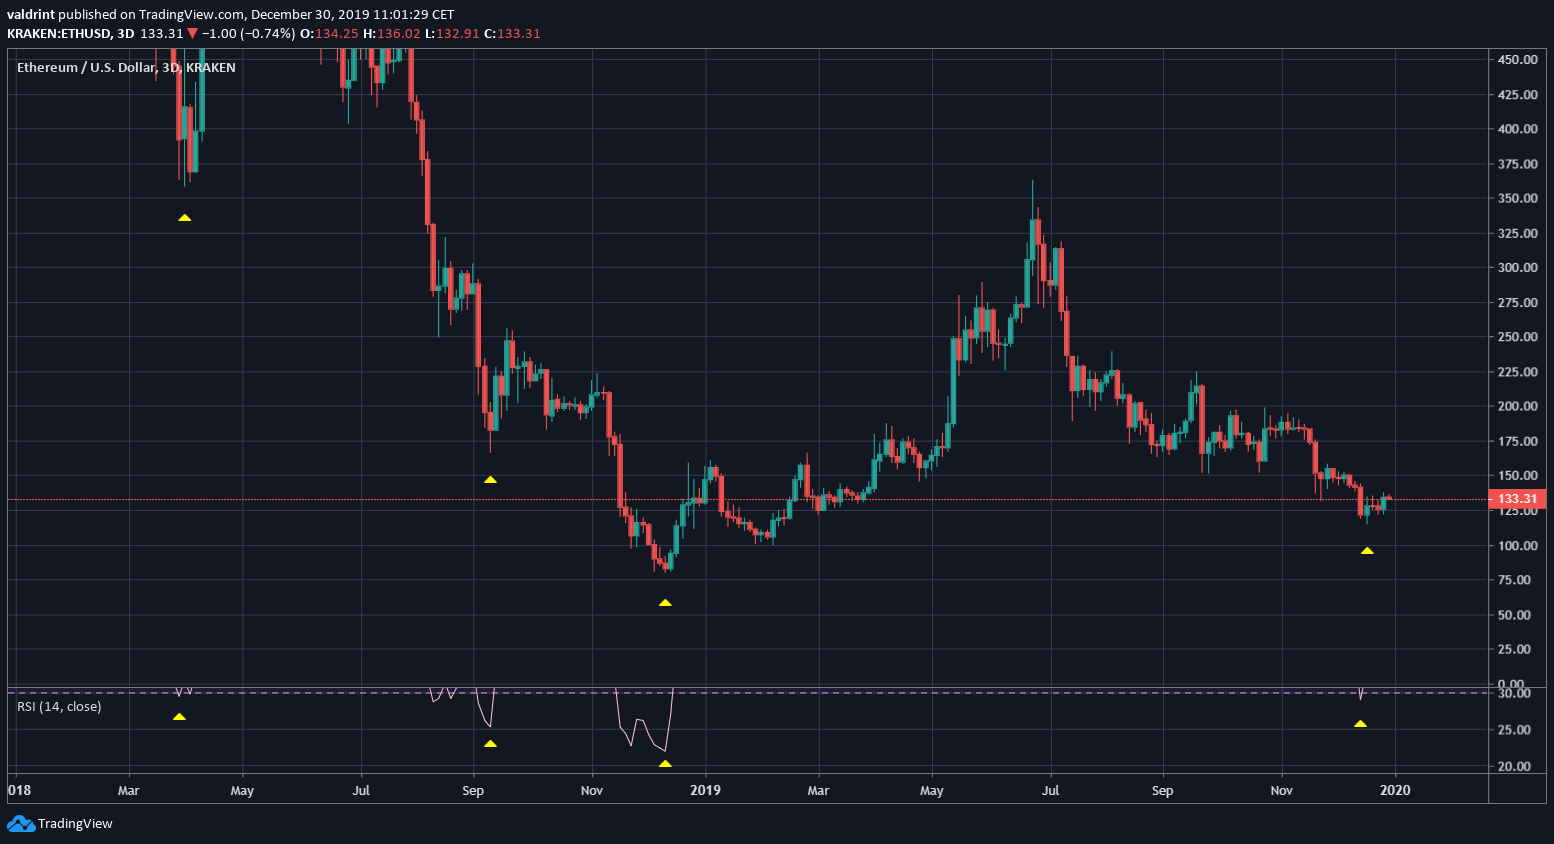
The three-day RSI has been oversold four times since 2018. Each time, an upward move of a different magnitude was initiated. However, as was the case in September and December 2018, the price first made a lower low before initiating an upward move.
If the same pattern repeats itself, the price would make a low near $100 before eventually moving upward.
Descending Channel
The Ethereum price has been trading inside a descending channel since July 2019. It initially found support above $160, before the price broke down. This area now acts as resistance and is coinciding with the resistance line of the channel.
Additionally, we can see two support areas, one at $120 and the other at $100. If the price were to decrease towards the second, it would represent a similar movement to that described in the previous section.
However, as long as the price continues decreasing at the rate predicted by the channel, it could still be considered to be in a downward trend.

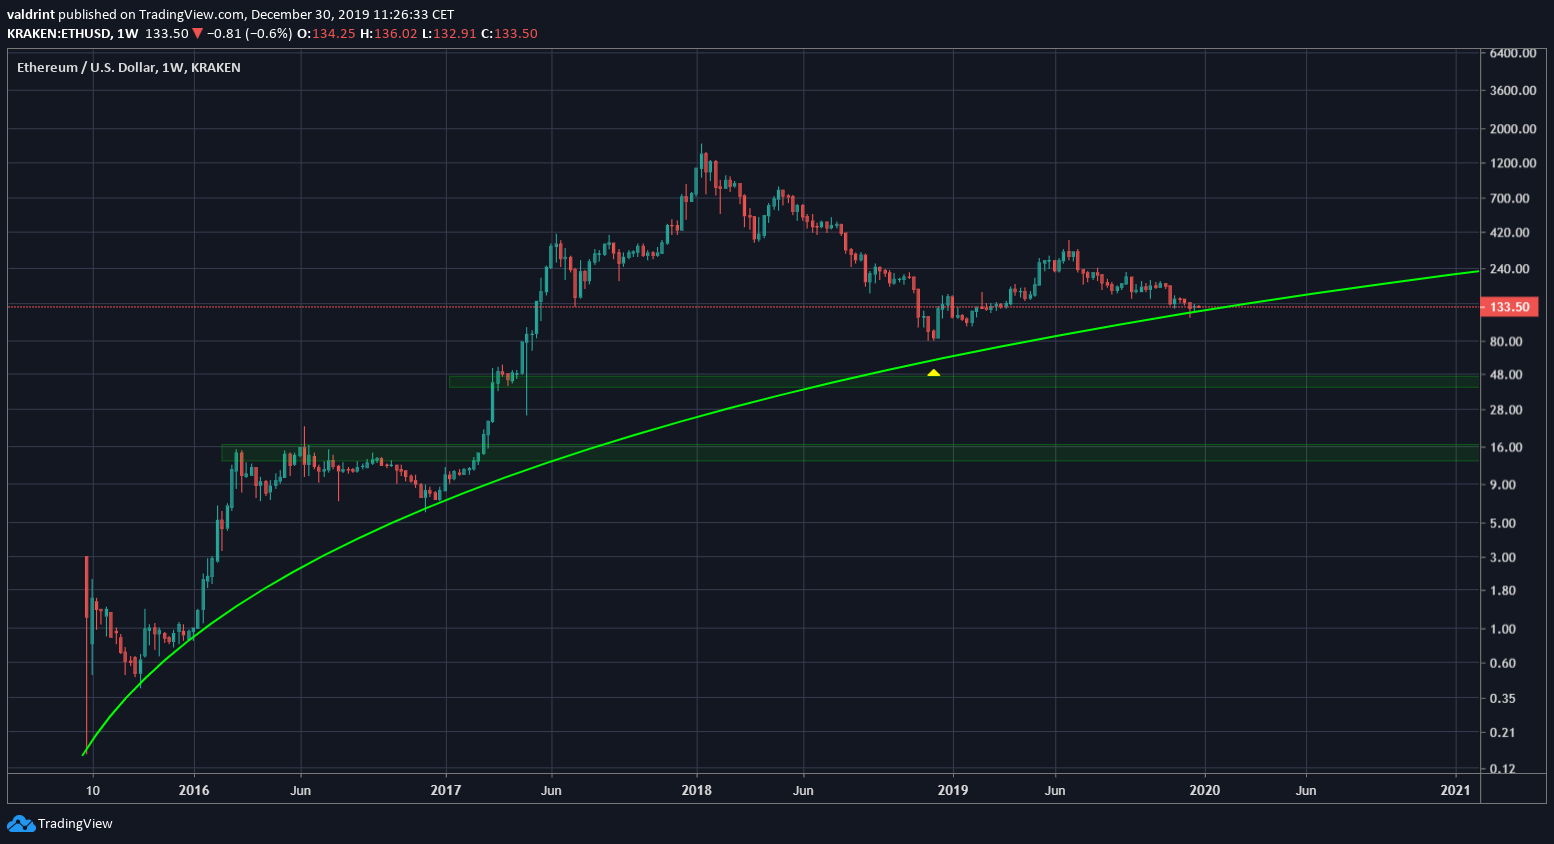
Logarithmic Curve
Using the logarithmic chart, we can draw an ascending support line that measures Ethereum’s rate of increase since 2015. However, the line is not perfect, since it does not record the low of December 2018. In order for the line to remain intact, the price would have to gradually begin increasing.
While the MACD is decreasing, it is doing so with less power. A bullish MACD cross would likely confirm that the price has reached a bottom.
A breakdown below the support line and the $100 support area previously outlined would likely take the price to $40 and eventually $16. We do not believe this is likely.
To conclude, the Ethereum price has retraced to a significant support area. However, there are no signs yet that it has made a bottom. A breakout from the descending channel or a bullish cross in the MACD would act as confirmation that Ethereum has begun a new upward trend.
