

The Ethereum Classic (ETC) price has been lagging behind a number of other similar large-cap coins, failing to recoup the majority of its Sept 4 losses.
Even though technical indicators are bullish, ETC is still continuing to clock lower daily lows.
ETC Long-Term Support Levels
Since December of 2018, the ETC price has traded above $3.50, creating a very strong horizontal support level. Conversely, the price has run into resistance at $8.15, the 0.5 Fib level of the previous decrease between February and March of 2020. Technical indicators on the weekly chart are slightly bullish. The weekly RSI has generated a hidden bullish divergence but the stochastic oscillator looks to be nearing a bearish cross.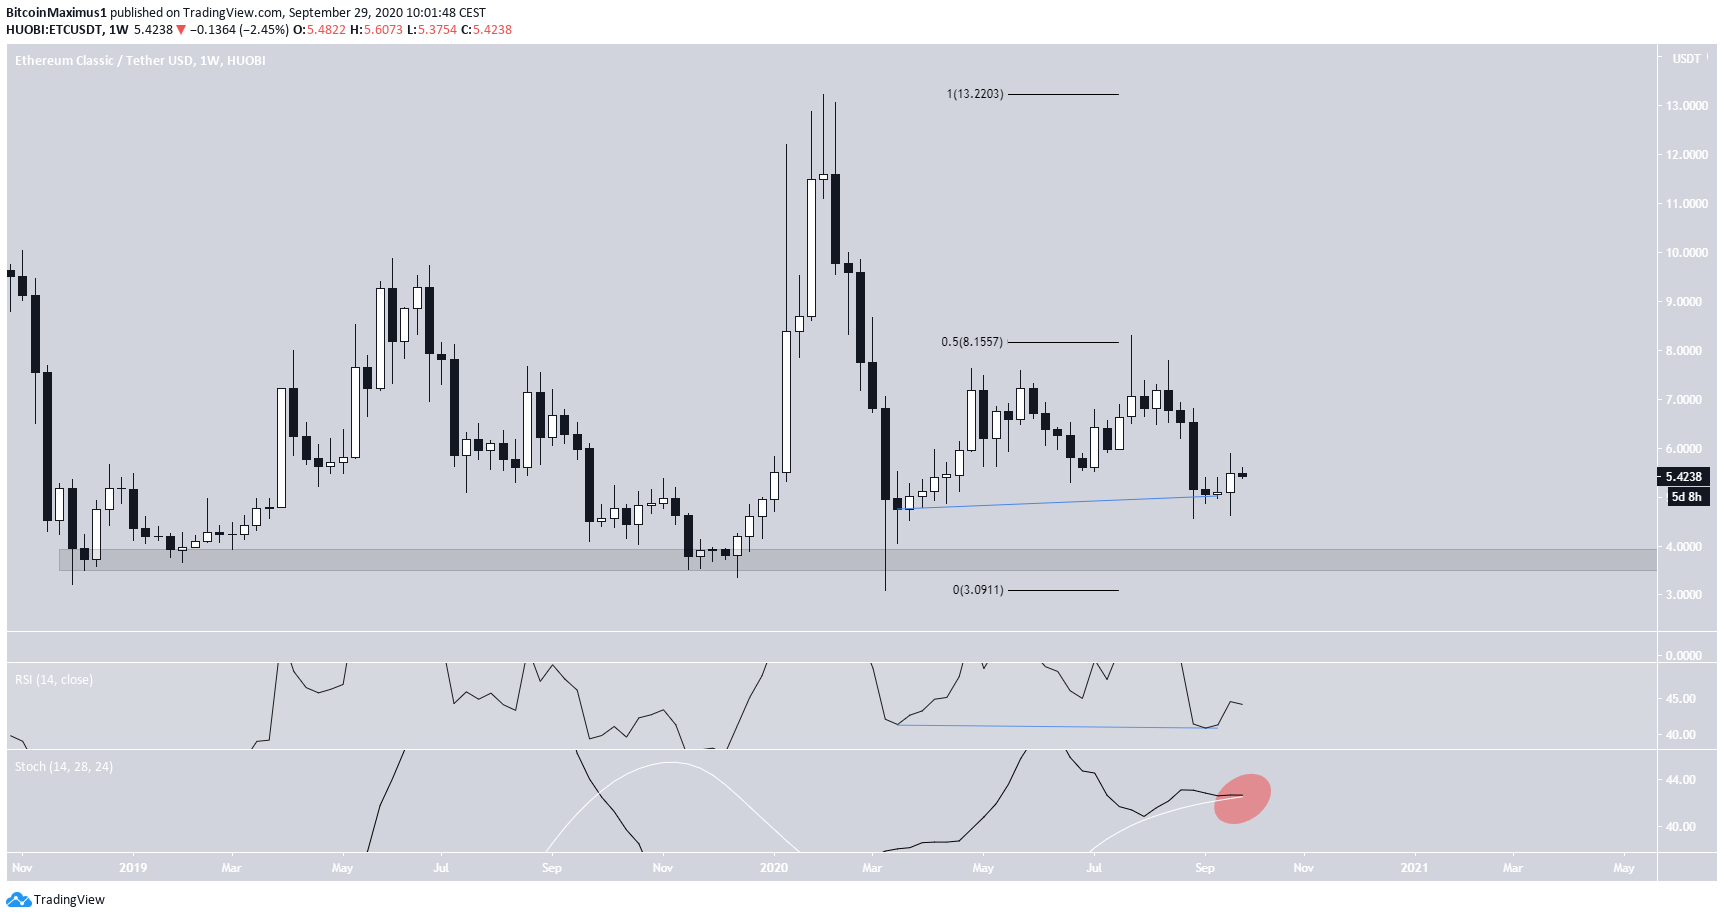
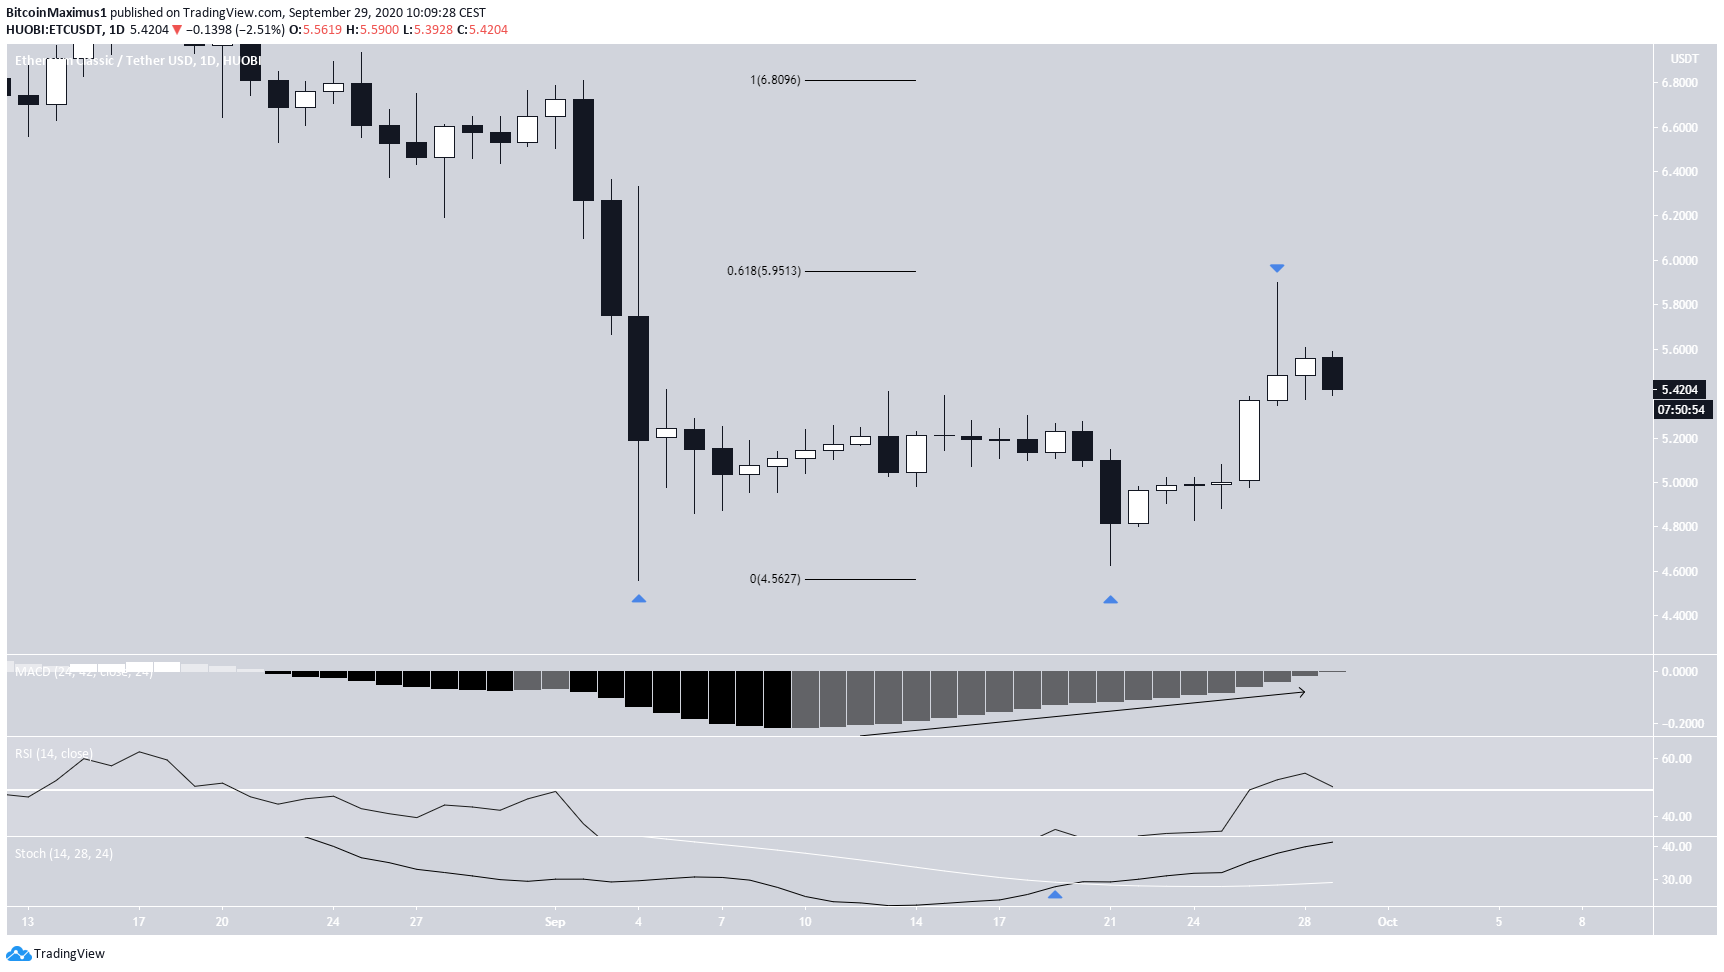
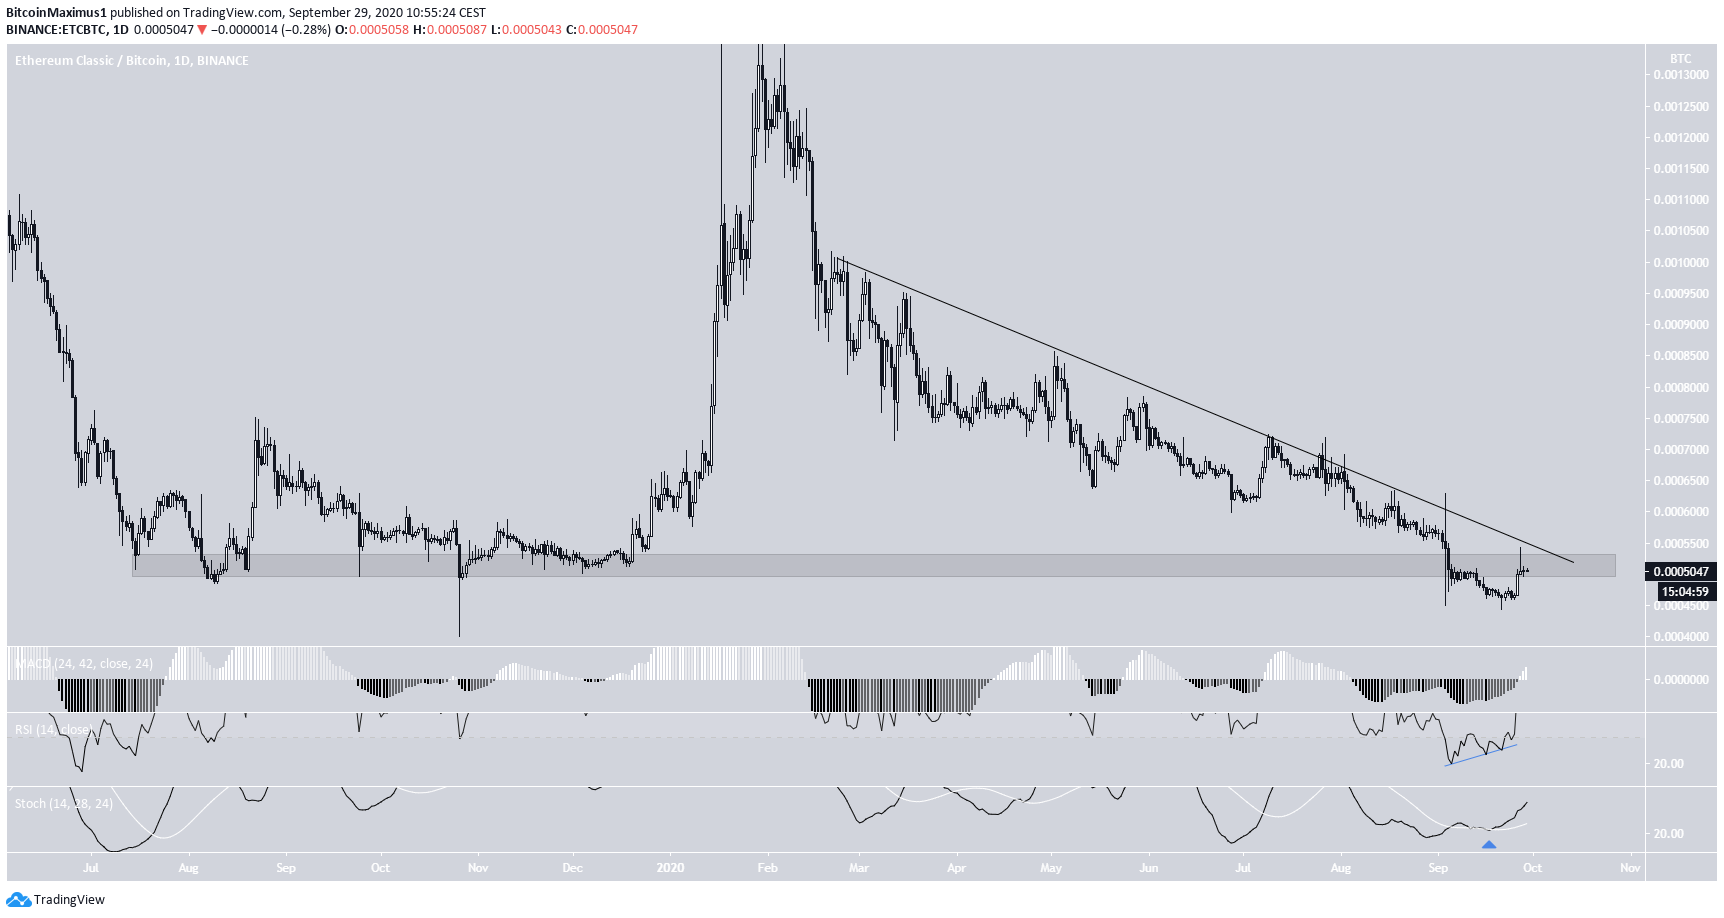
Double-Bottom
The daily chart shows that the price has successfully completed a double-bottom pattern near $4.60 on Sept 4 and 21. The double-bottom is normally considered a bullish reversal pattern. After hitting the bottom, ETC increased but was rejected at the 0.618 Fib level at $5.95, leaving a long upper-wick in its wake. Technical indicators are bullish:- The MACD is increasing, having almost crossed into positive territory.
- The Stochastic Oscillator has made a bullish cross and is moving upwards.
- The RSI is above 50
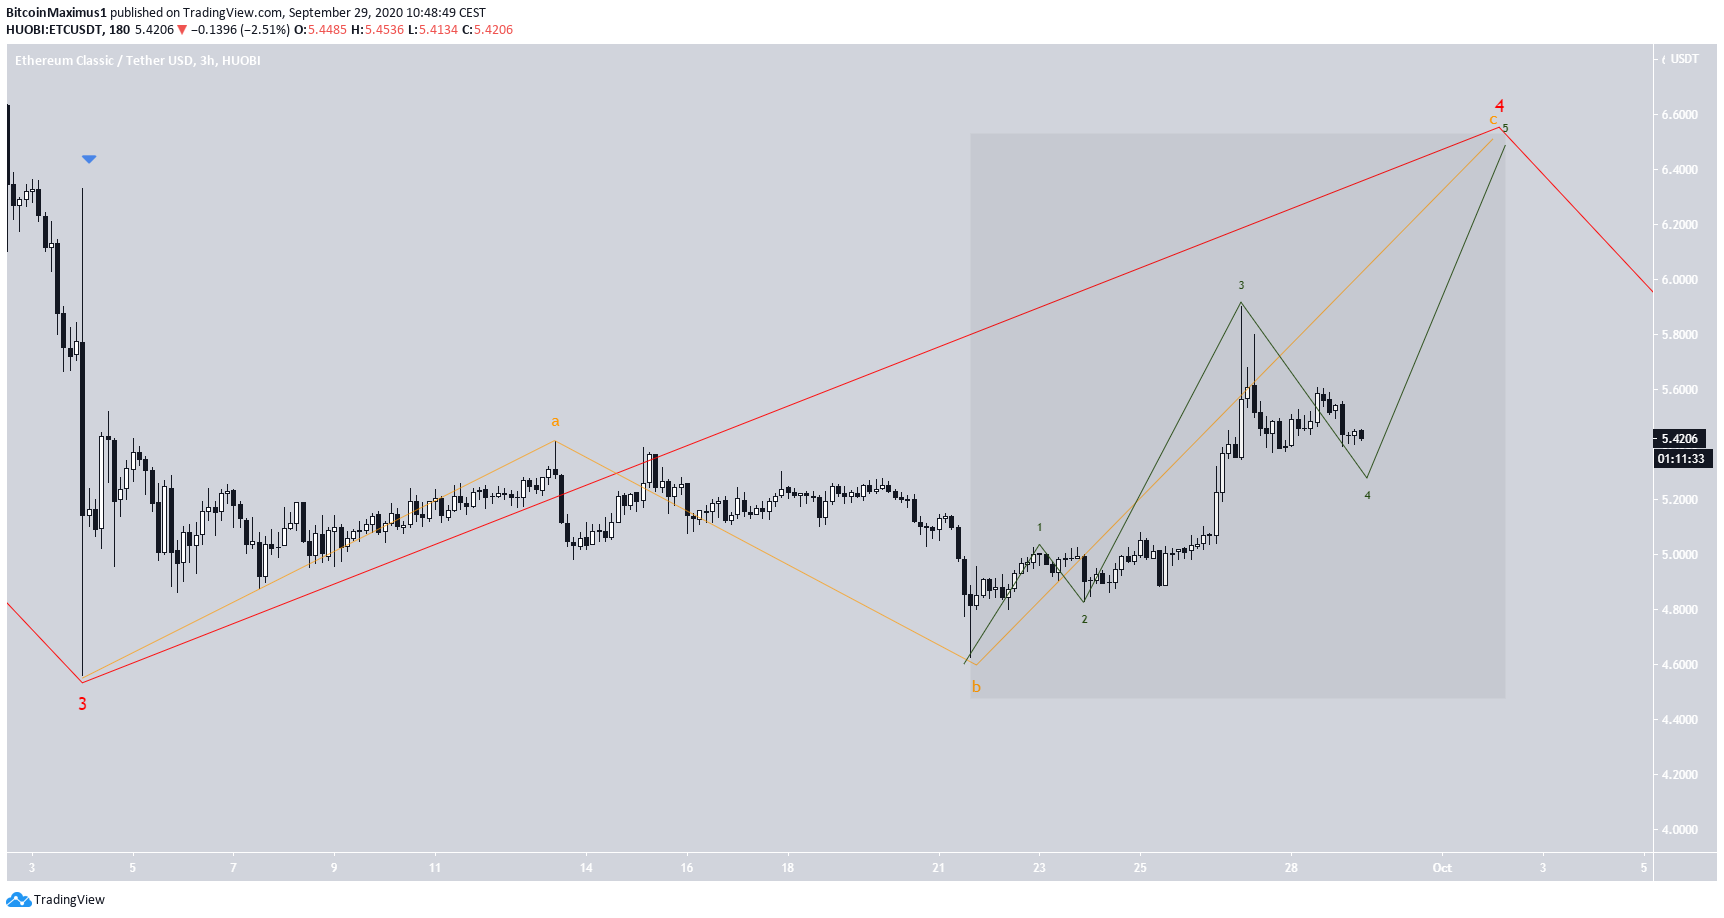
Wave Count
Despite the bullishness from technical indicators, the wave count seems to be bearish. It seems that the price is in the process of completing a bearish impulse (shown in orange below), and is currently in its fourth wave. An increase above the wave 1 low at $6.50 would invalidate this particular wave count.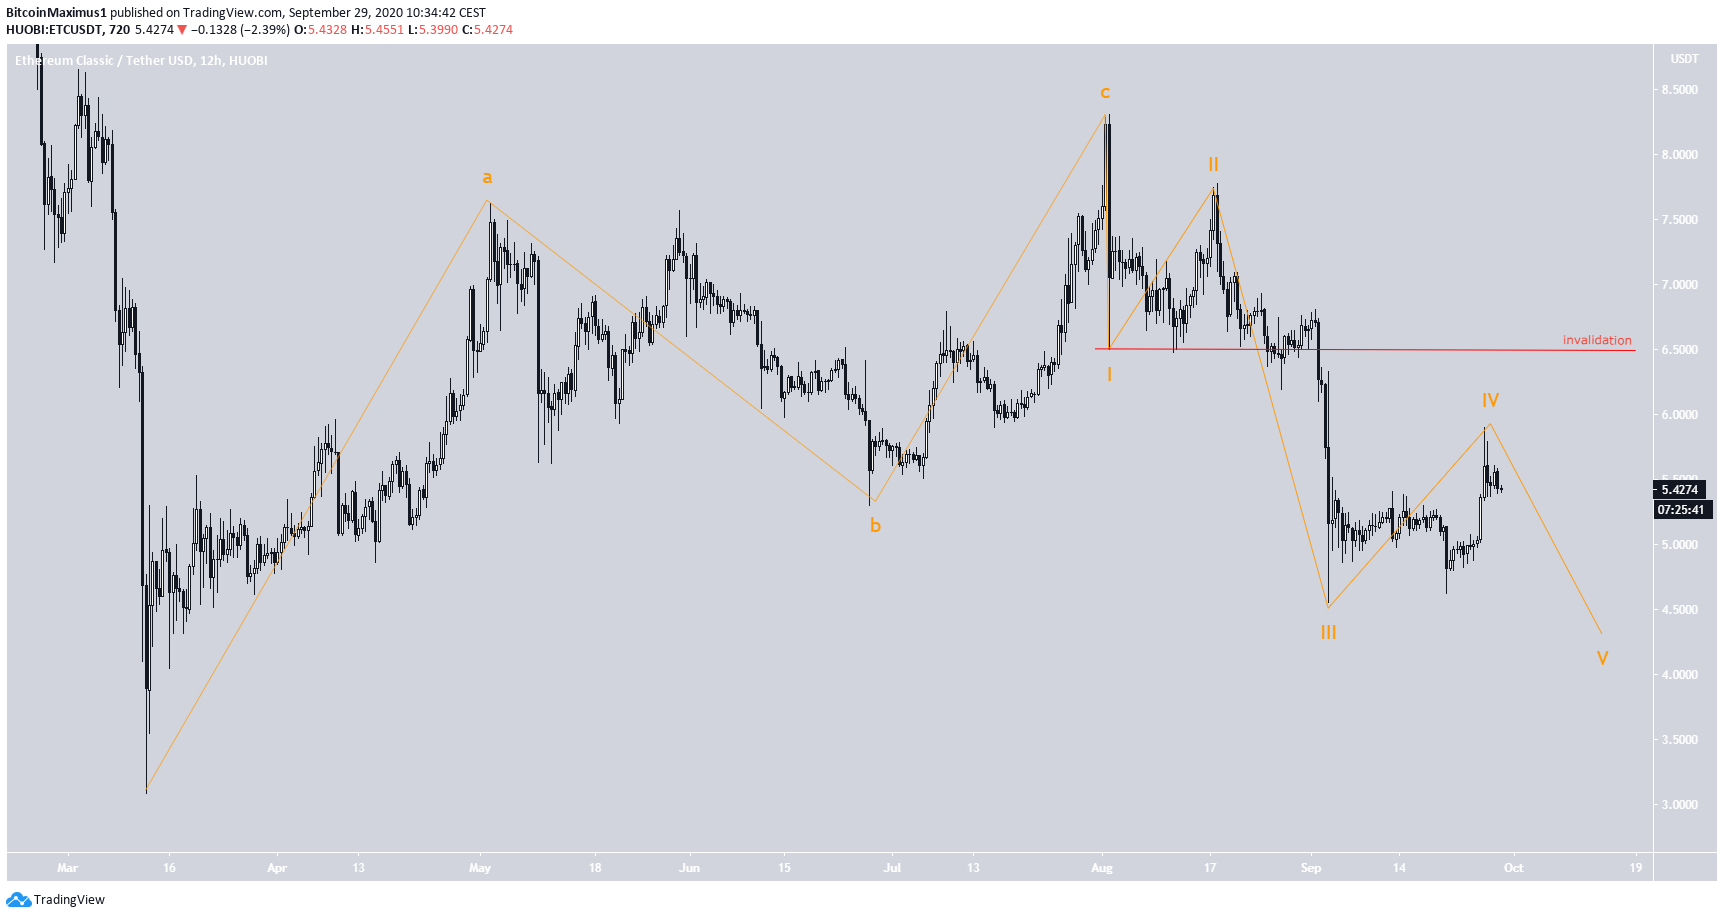
ETC/BTC
Cryptocurrency trader @CryptoToni_ tweeted an ETC chart, suggesting that the price will increase all the way to the range high at ₿0.0015.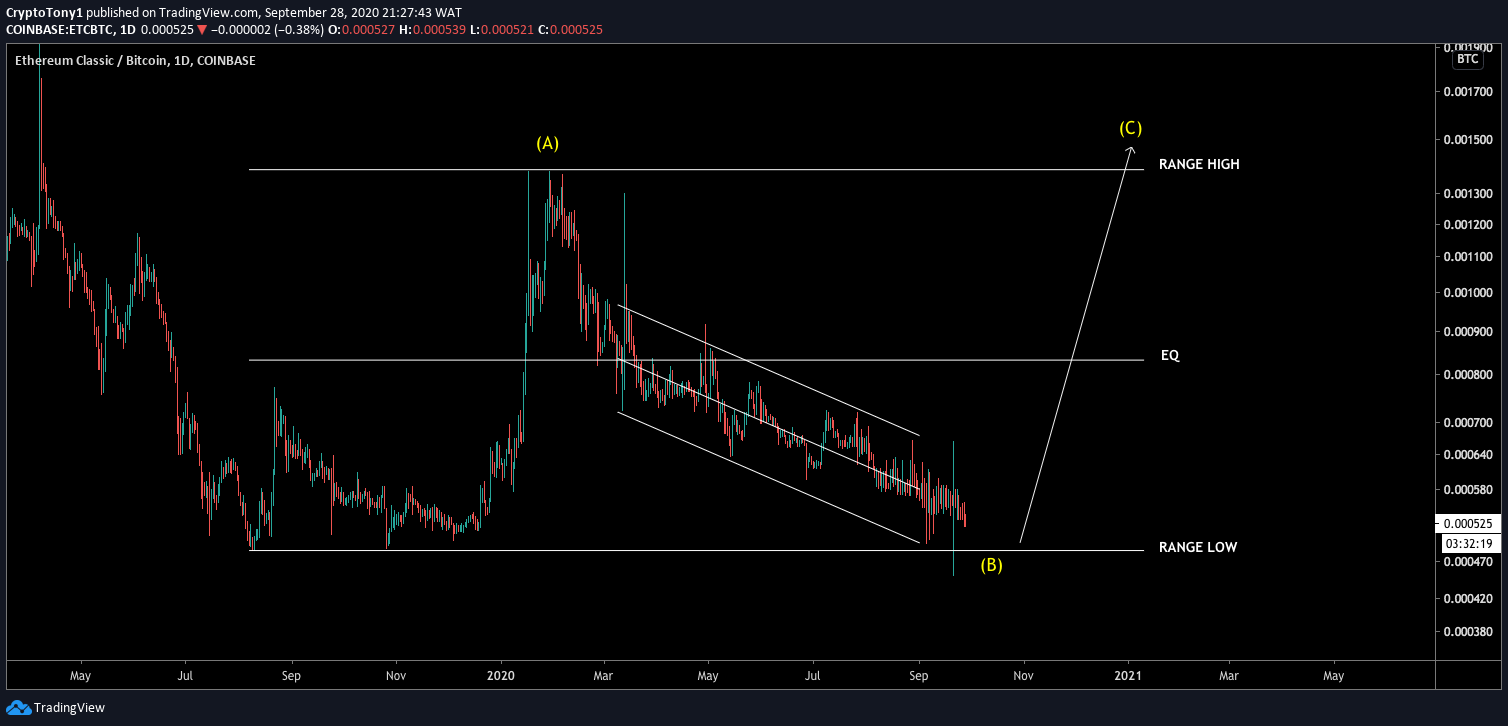
Disclaimer
In line with the Trust Project guidelines, this price analysis article is for informational purposes only and should not be considered financial or investment advice. BeInCrypto is committed to accurate, unbiased reporting, but market conditions are subject to change without notice. Always conduct your own research and consult with a professional before making any financial decisions. Please note that our Terms and Conditions, Privacy Policy, and Disclaimers have been updated.

Valdrin Tahiri
Valdrin discovered cryptocurrencies while he was getting his MSc in Financial Markets from the Barcelona School of Economics. Shortly after graduating, he began writing for several different cryptocurrency related websites as a freelancer before eventually taking on the role of BeInCrypto's Senior Analyst.
(I do not have a discord and will not contact you first there. Beware of scammers)
READ FULL BIO
Sponsored
Sponsored