


The Bitcoin (BTC) price is approaching a crucial resistance area at $11,150 but was rejected prior to getting there.
After a short-term decrease, BTC is expected to make another attempt at breaking out.
Bitcoin Approaches Resistance
The Bitcoin price has been following a descending resistance line since it reached a local high of $12,473 on Aug 17. BTC has validated this resistance twice since.
The price is currently approaching this resistance line once again. The line also coincides with the $11,150 area, which previously acted as support but turned to resistance on Sept 19.
A breakout above this resistance line and the $11,150 area would confirm that the trend is bullish.
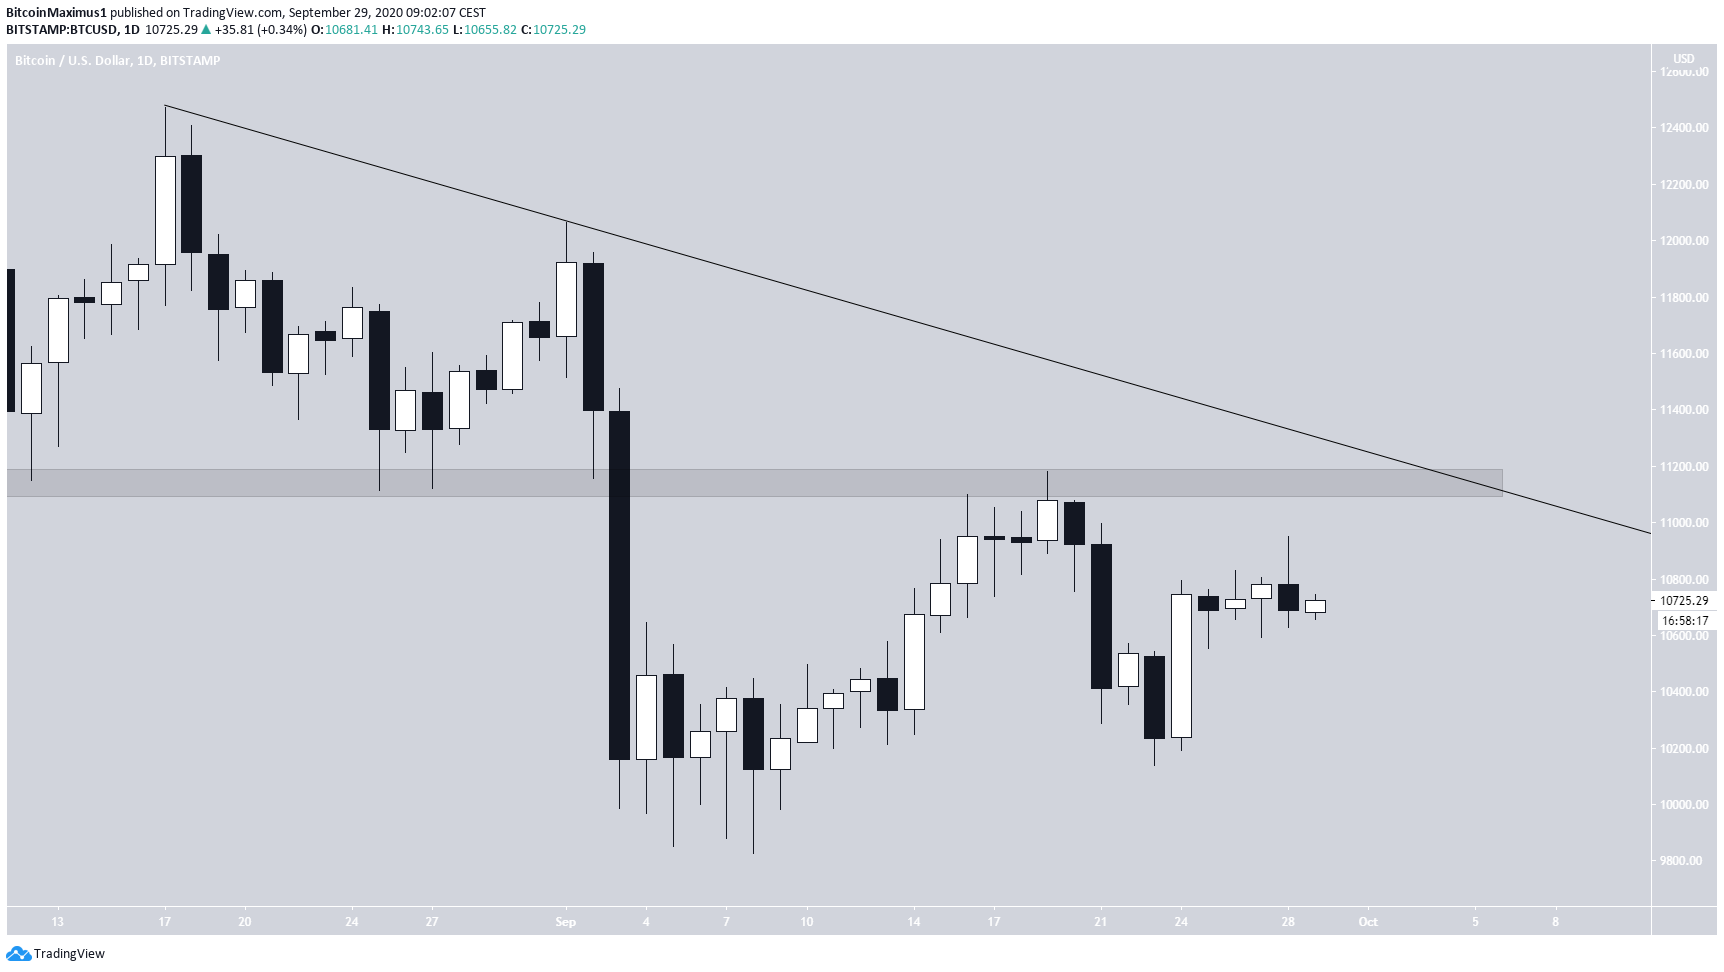
The shorter-term chart shows that the price was twice rejected by the 0.786 Fib level of the previous decrease at $10,955 and has begun to retrace.
The $10,550 area is expected to provide support since it’s both the 0.5 Fib level of the entire upward move and a previous resistance area. As long as this zone holds, the possibility of continuation remains high.

Wave Count
It is likely that on Sept 9 BTC began a bullish impulse (shown in orange below). It looks to have already completed waves 1 and 2 and has likely begun the third.
Preliminary targets for the top of the third wave are found at $12,180, $12,880, and $13,380 (the 1.61, 2.27, and 3.61 Fib levels of sub-wave 1).
The sub-waves are shown in blue in the chart below:

The sub-wave count shows that BTC is currently correcting in sub-wave 2, which is transpiring inside an A-B-C formation (shown in red below). The formation is expected to end between the 0.5 and 0.618 Fib levels between $10,450-$10,550, but its exact shape depends on if the A portion has three or five waves.
BTC has yet to reach the 1.382 Fib time level (shown in blue), so it’s unlikely that the corrective period has ended.
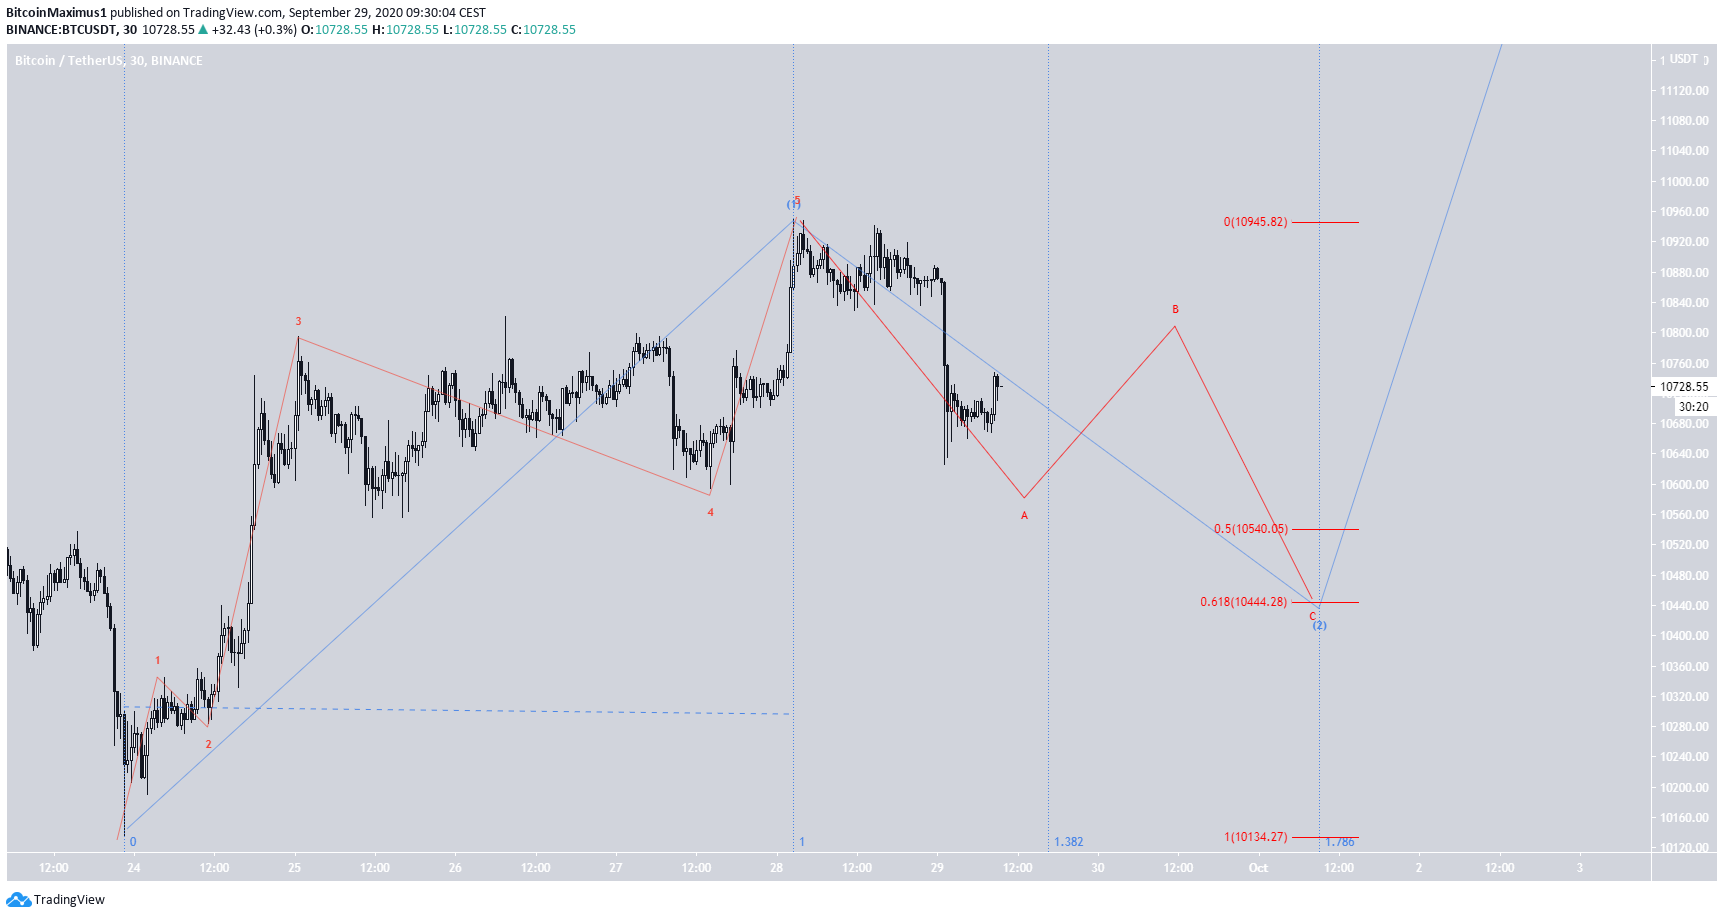
To conclude, while it is likely that BTC has begun an upward move, a short-term correction is expected before the price continues upwards.
For BeInCrypto’s previous Bitcoin analysis, click here!


