
The Ethereum Classic (ETC) price has been lagging behind a number of other similar large-cap coins, failing to recoup the majority of its Sept 4 losses.
Even though technical indicators are bullish, ETC is still continuing to clock lower daily lows.
ETC Long-Term Support Levels
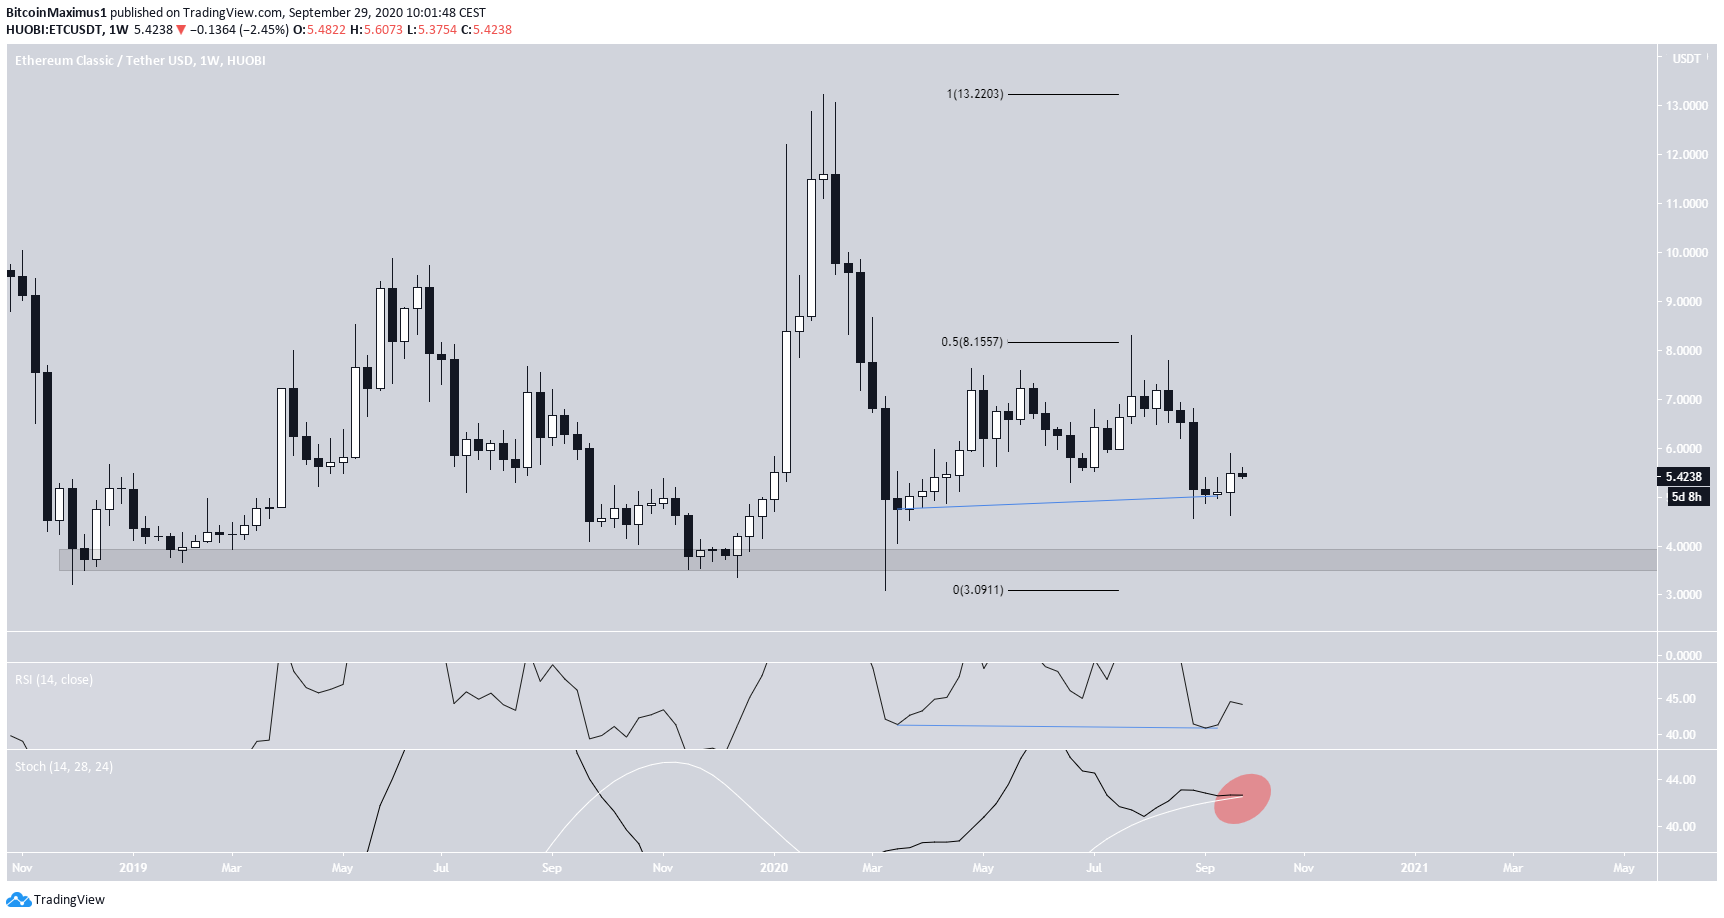
Since December of 2018, the ETC price has traded above $3.50, creating a very strong horizontal support level. Conversely, the price has run into resistance at $8.15, the 0.5 Fib level of the previous decrease between February and March of 2020.
Technical indicators on the weekly chart are slightly bullish. The weekly RSI has generated a hidden bullish divergence but the stochastic oscillator looks to be nearing a bearish cross.
Double-Bottom
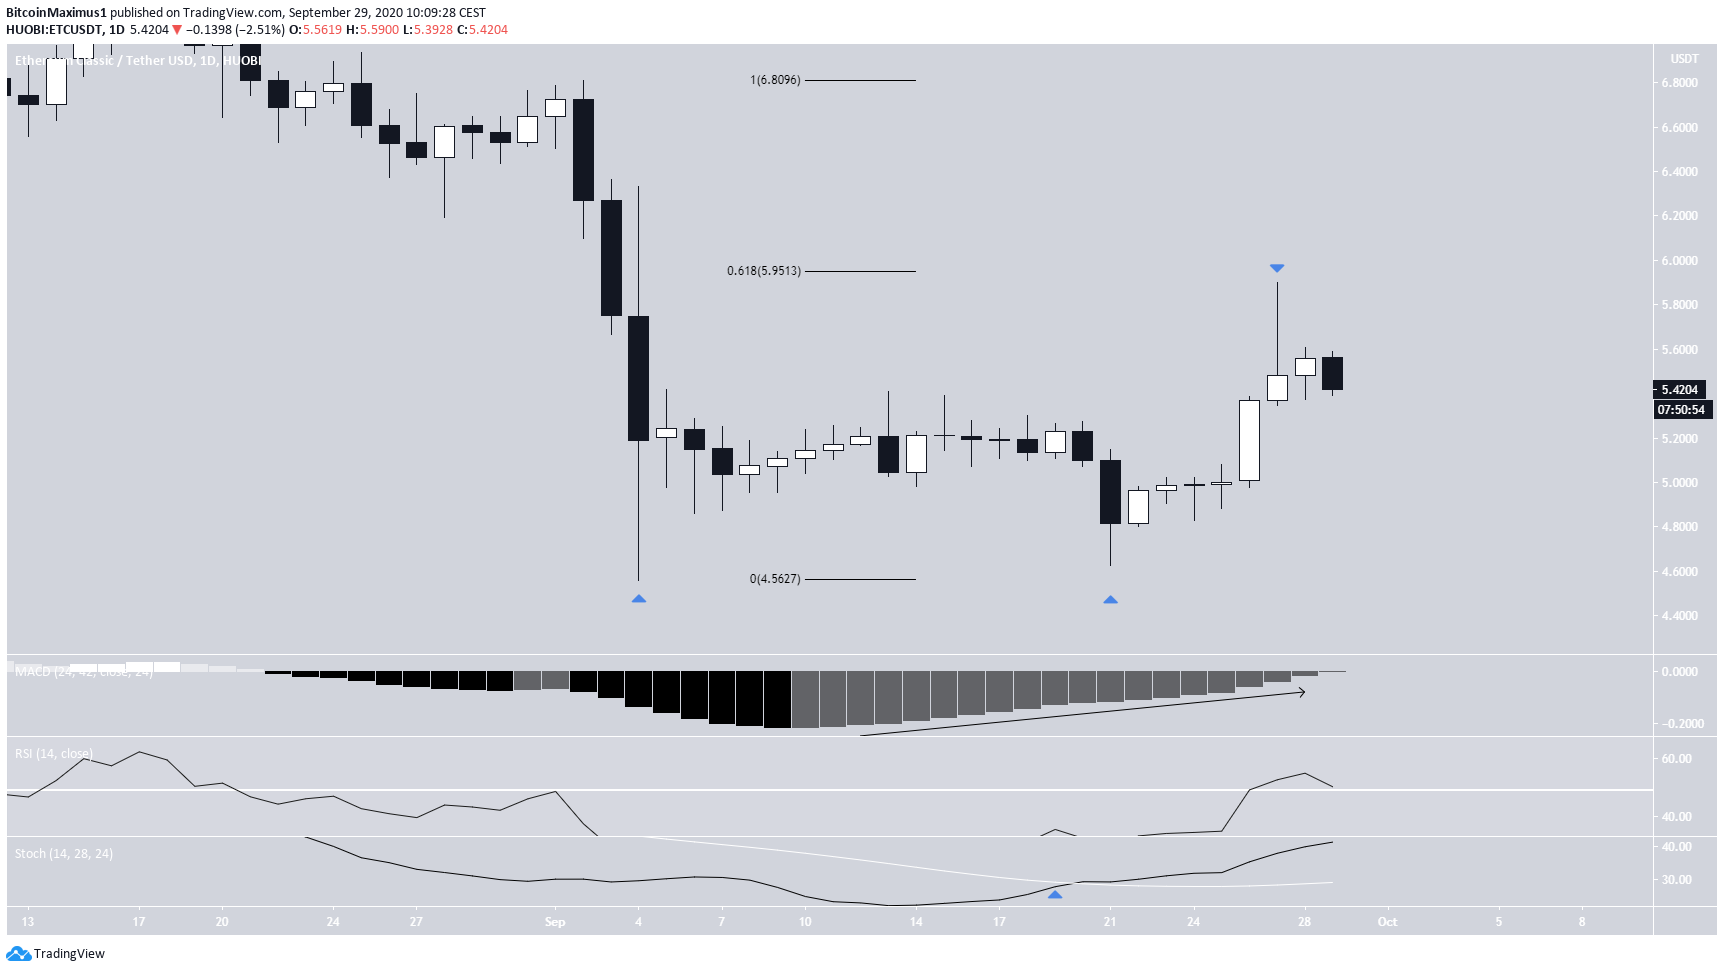
The daily chart shows that the price has successfully completed a double-bottom pattern near $4.60 on Sept 4 and 21. The double-bottom is normally considered a bullish reversal pattern.
After hitting the bottom, ETC increased but was rejected at the 0.618 Fib level at $5.95, leaving a long upper-wick in its wake.
Technical indicators are bullish:
- The MACD is increasing, having almost crossed into positive territory.
- The Stochastic Oscillator has made a bullish cross and is moving upwards.
- The RSI is above 50
These are signs that the price is likely to continue heading upwards. with the first resistance area being found at $6.80.
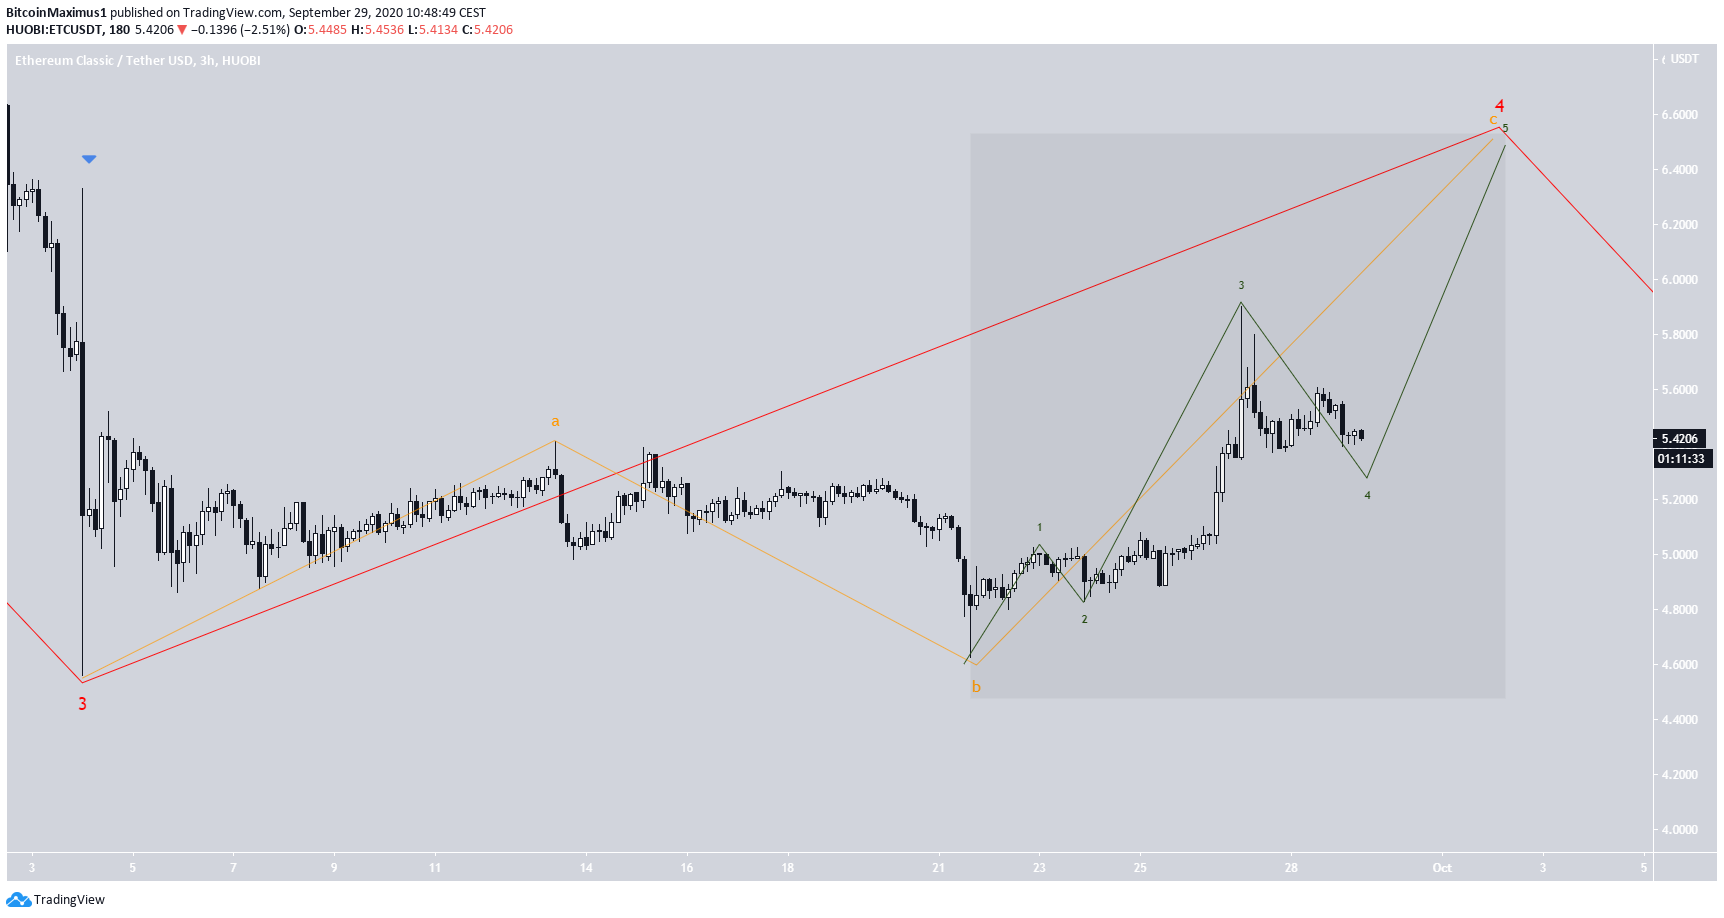
Wave Count
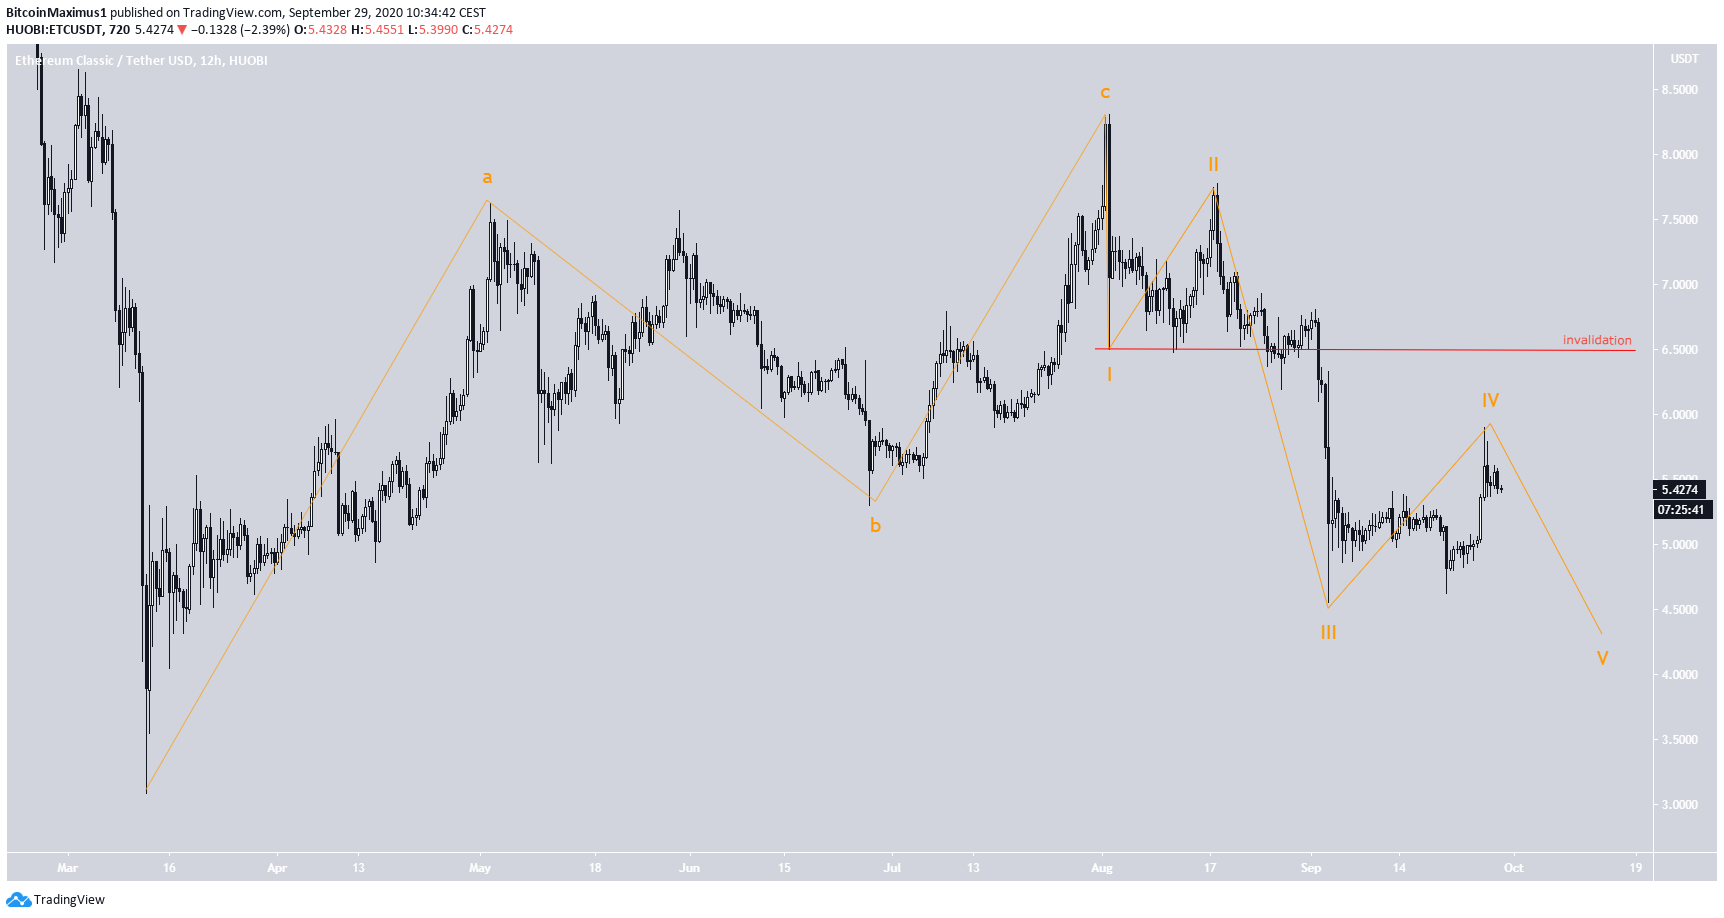
Despite the bullishness from technical indicators, the wave count seems to be bearish. It seems that the price is in the process of completing a bearish impulse (shown in orange below), and is currently in its fourth wave.
An increase above the wave 1 low at $6.50 would invalidate this particular wave count.
The bullish scenario suggests that the bearish impulse is just a part of wave C (in blue below), and should continue moving upwards after completion. However, even this count still predicts that there is another move down before the price eventually resumes its upward movement.
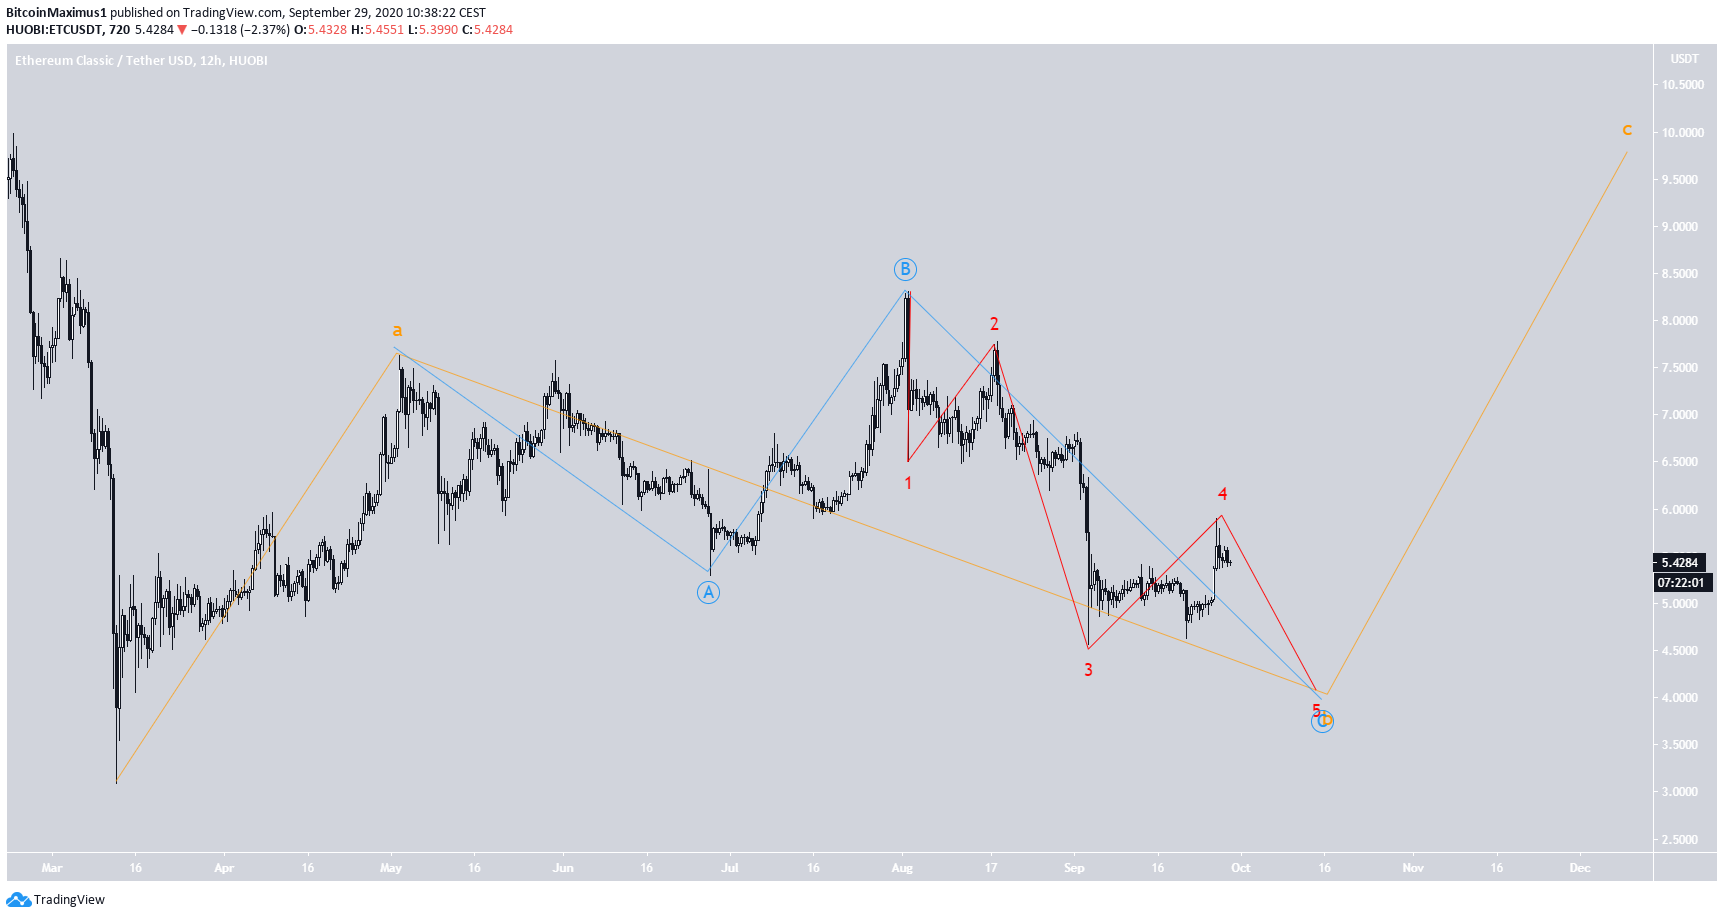
A closer look at wave 4 of the bearish impulse (red) reveals that the price is likely nearing the end of the movement.
The highlighted part looks impulsive (green), so it’s likely that this is sub-wave C (orange) which would complete the wave near $6.50.
The only way in which this could be the beginning of a new upward move is if the massive candlestick (blue arrow) with long wicks on both sides was the beginning of the impulse, but that cannot be determined at the current time.
ETC/BTC
Cryptocurrency trader @CryptoToni_ tweeted an ETC chart, suggesting that the price will increase all the way to the range high at ₿0.0015.
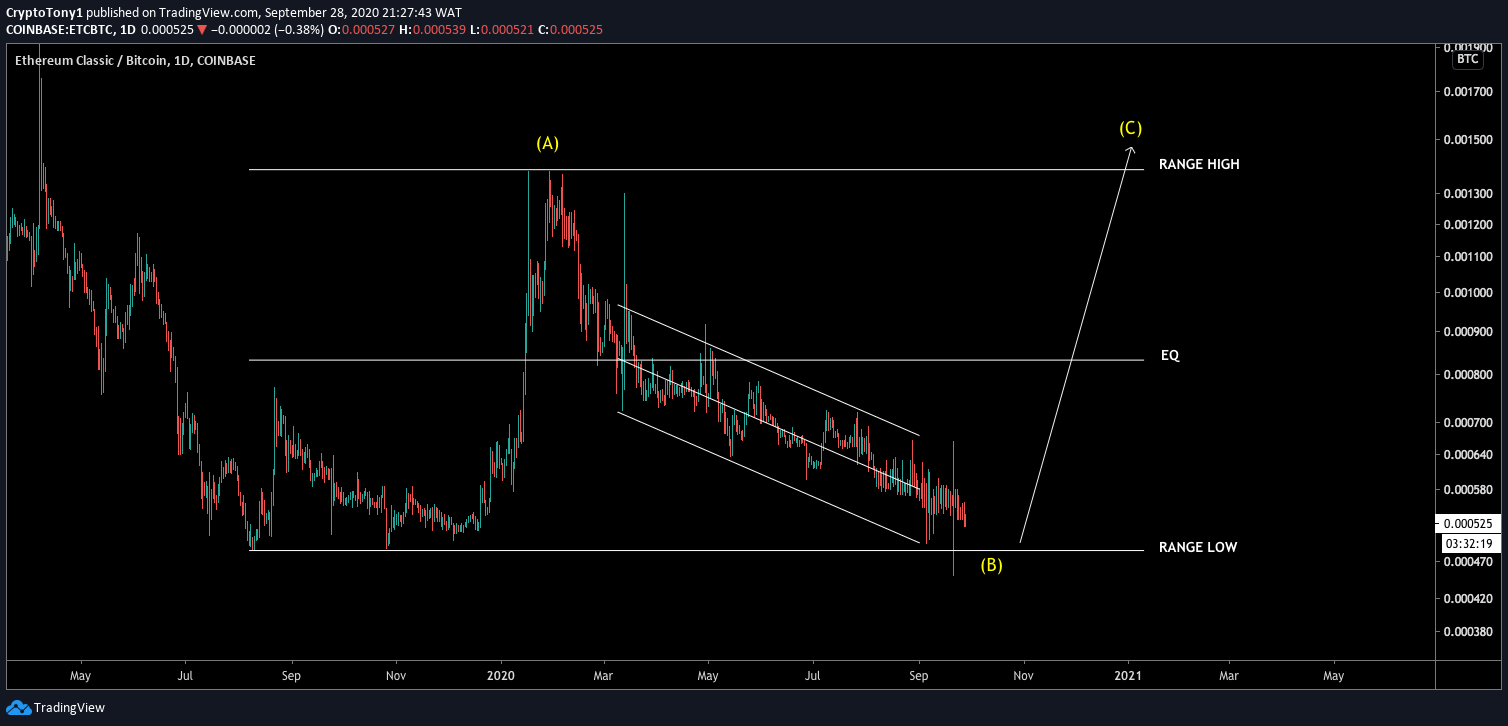
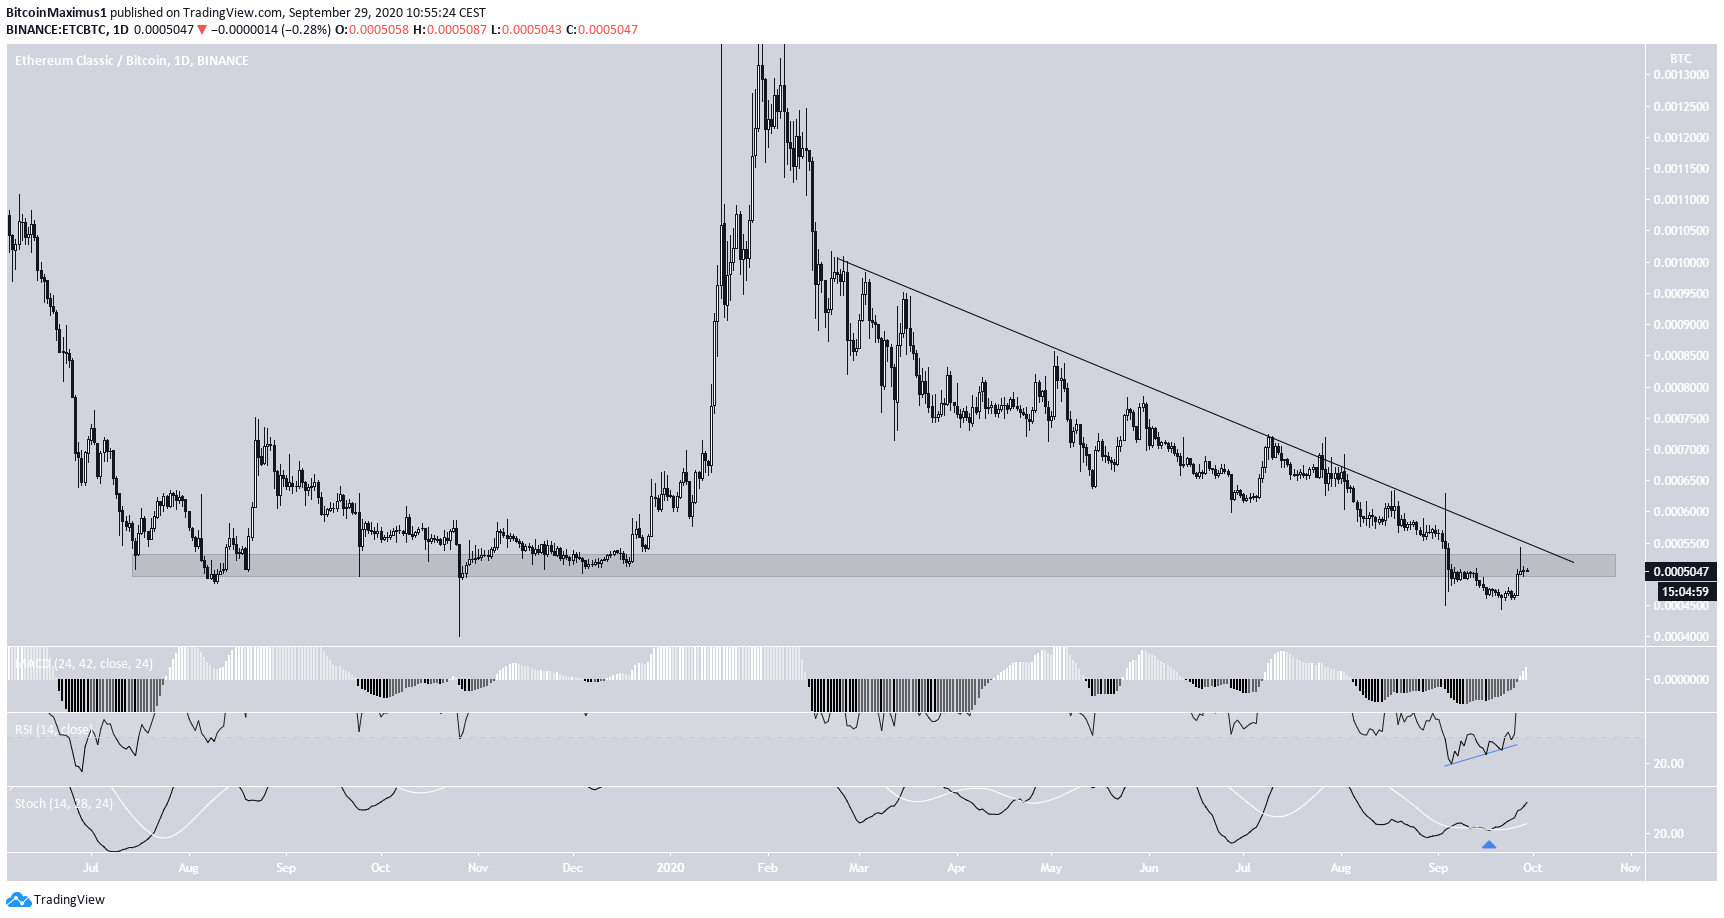
However, ETC has fallen slightly below the range low since. Therefore, it first has to reclaim the range low at 51,000 satoshis in order to be considered bullish, and ideally break out from the descending resistance line it is following.
While technical indicators are bullish due to the bullish cross/divergence and positive MACD, the bearishness in price action makes it difficult to come to a definitive conclusion on the direction of the trend.
For BeInCrypto’s latest Bitcoin (BTC) analysis, click here!
