
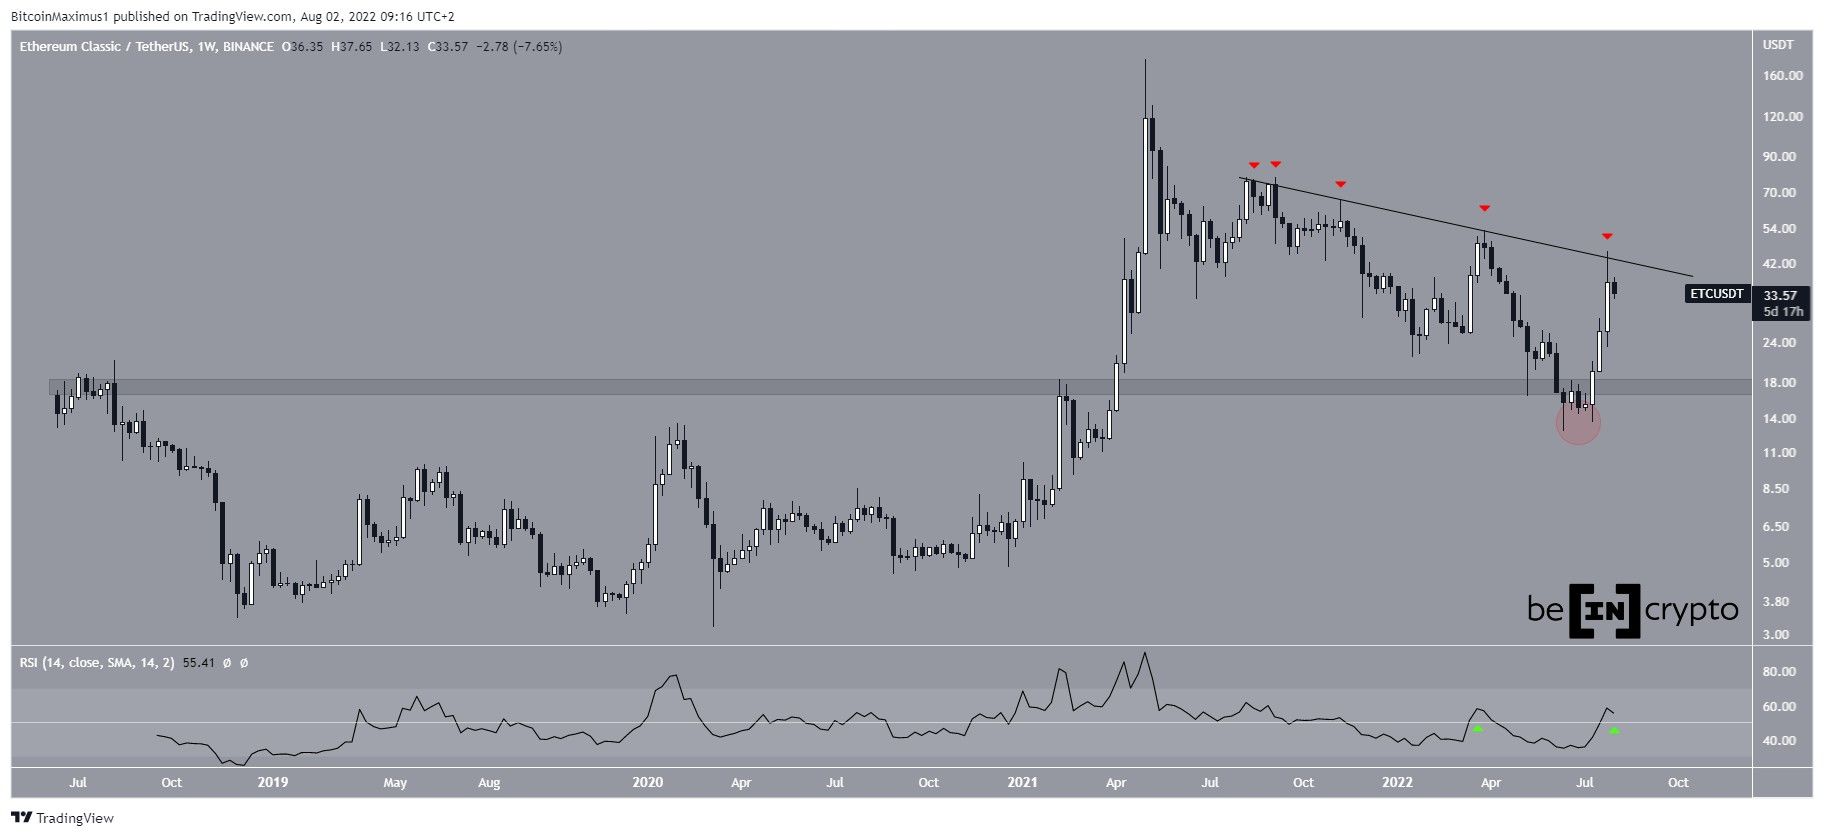
Ethereum Classic (ETC) likely initiated a bullish trend reversal on June 18. However, it has been falling since July 29, potentially retracing in response to the entire preceding upward movement.
ETC has been falling since reaching an all-time high price of $179.83 in May 2021. The downward movement has so far led to a low of $12.47 in June.
The downward movement seemed to cause a breakdown from the $17 horizontal area. This is a crucial area since it had acted as resistance throughout 2018-2021. However, ETC bounced shortly afterwards and reclaimed the area, rendering the previous breakdown as only a deviation (red circle).
The upward movement took the price to a descending resistance line that has been in place since Aug. There, it made its fifth breakout attempt (red icons). Since lines get weaker each time they are touched, an eventual breakout from this line is likely.
Furthermore, the weekly RSI has moved above 50 (green icon). It remains to be seen if the indicator manages to hold on above this line or falls below it, similar to what occurred in April. If it manages to hold on above 50 and the price breaks out from the resistance line, it would confirm that a long-term bullish reversal is in place.
Ongoing upward movement
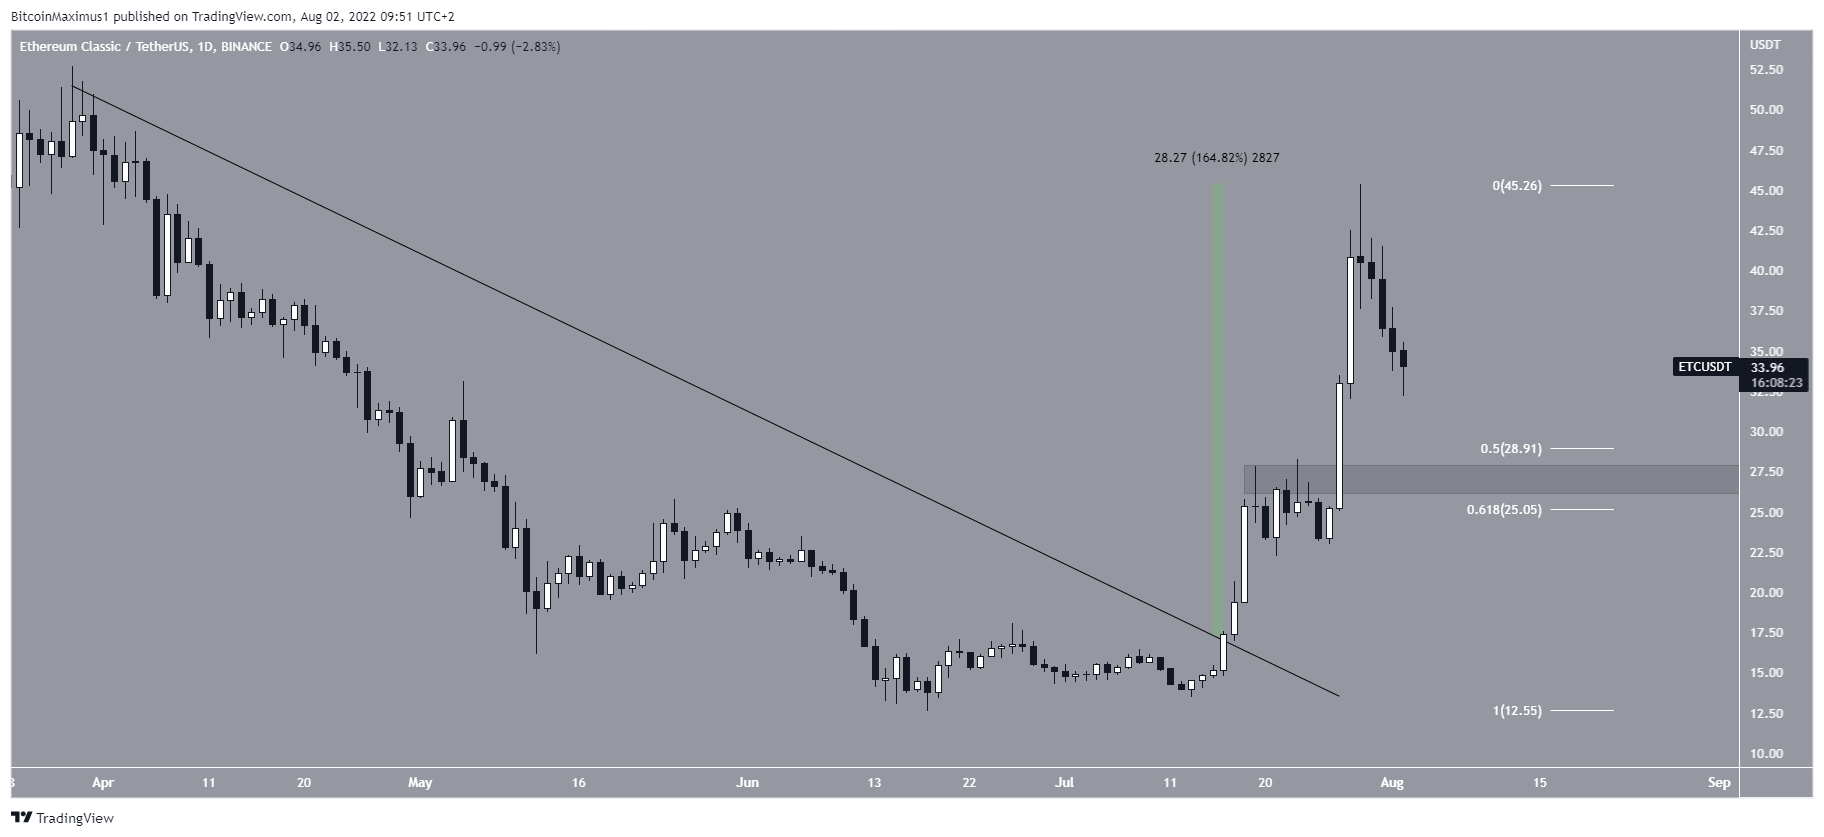
The daily chart shows that ETC broke out from a shorter-term descending resistance line on July 15. Afterward, it proceeded to increase by 165% in a period of 14 days. This led to a high of $45.36 on July 29.
However, the price has been decreasing since. It is currently approaching the 0.5-0.618 Fib retracement support area between $25 and $29. This also coincides with a horizontal area that previously acted as support. So, it is likely that the price bounces once it gets there.
Furthermore, the daily RSI has moved above 50, a sign that is associated with bullish trends.
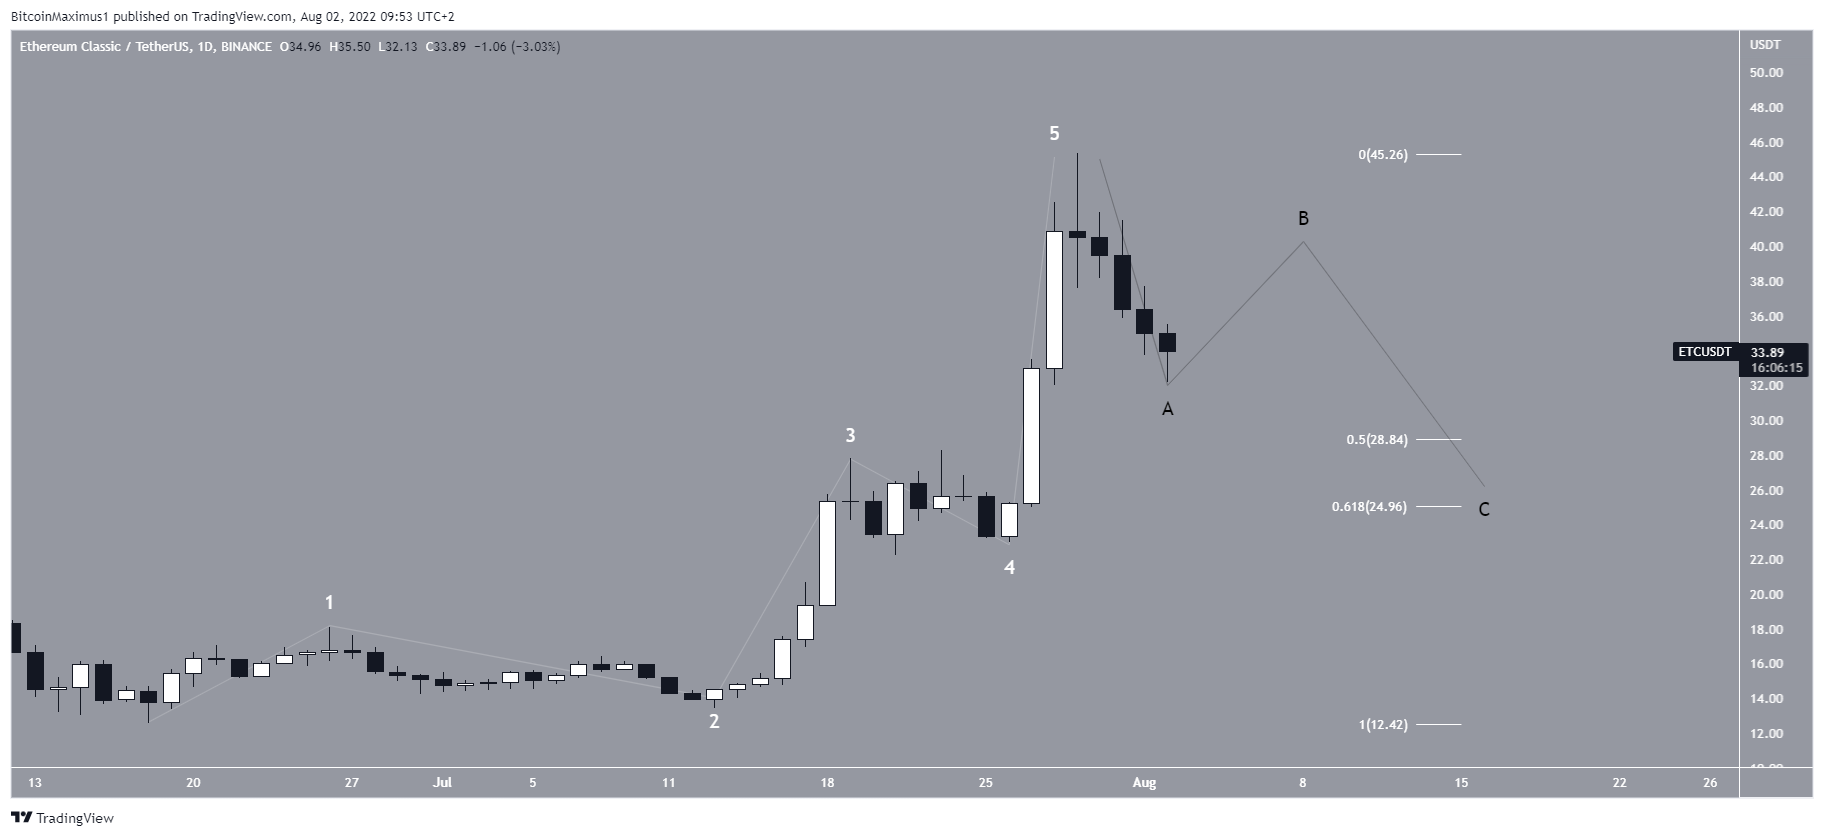
ETC wave count analysis
Cryptocurrency trader @Altstreetbet tweeted a chart of ETC, stating that it is the first large cap altcoin to begin a bullish count.
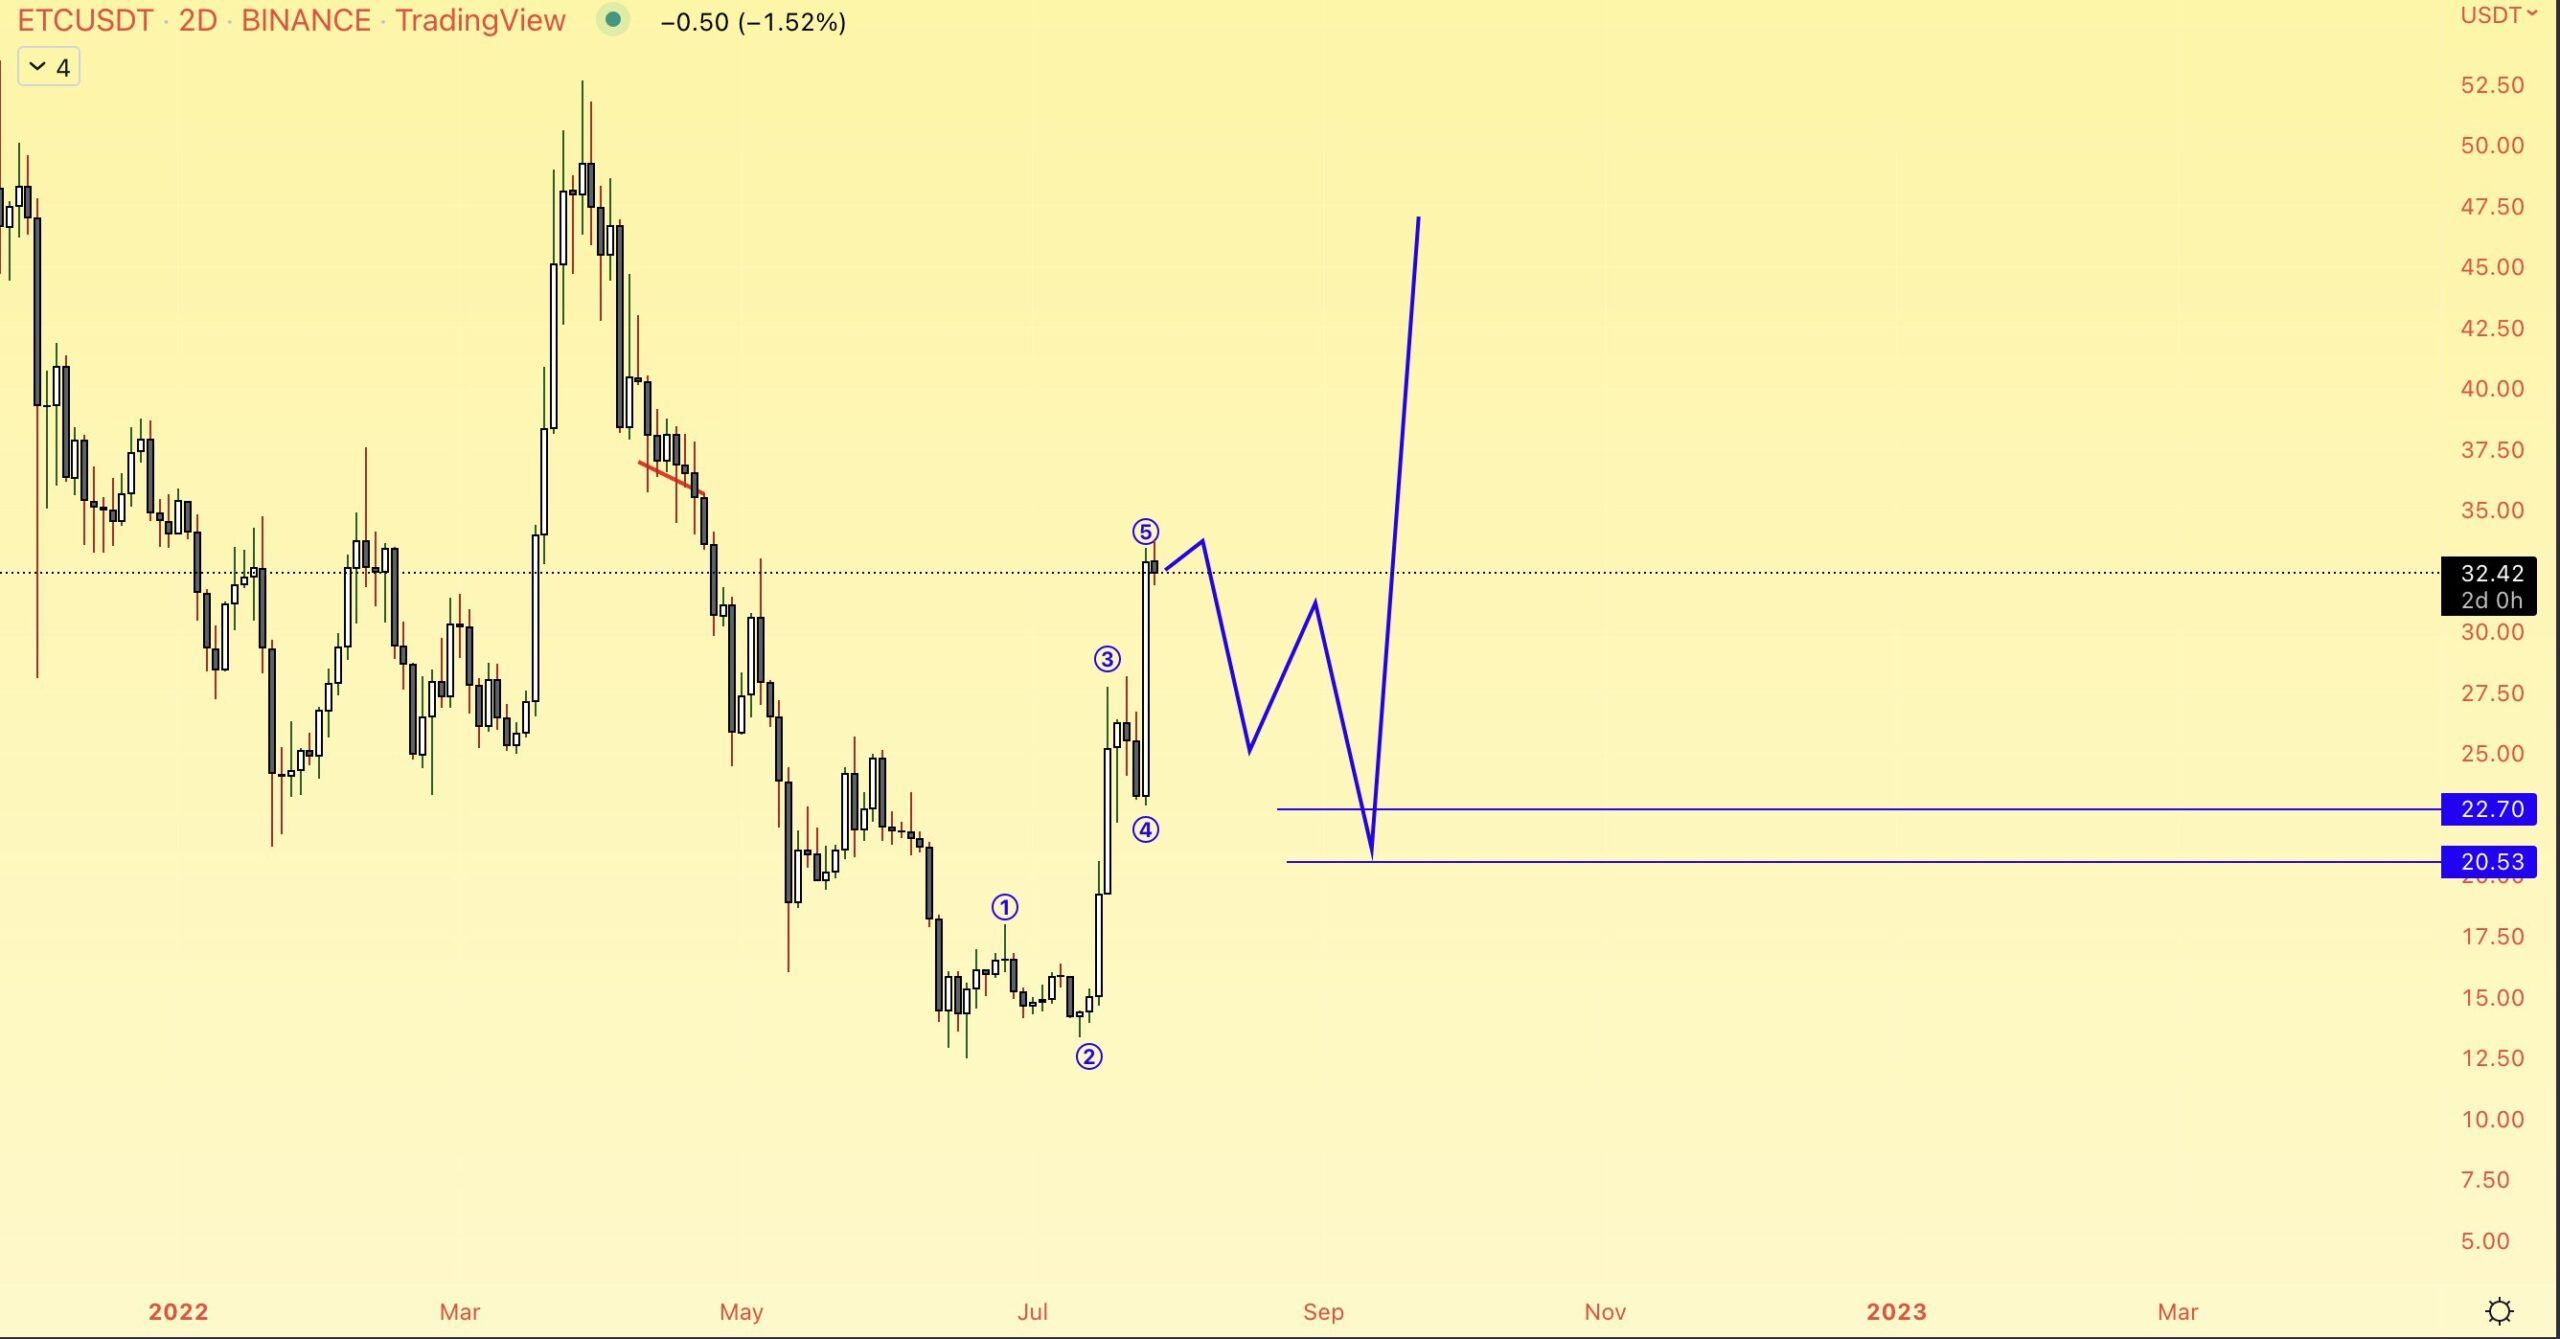
The most likely wave count suggests that since the June 18 low, ETC has completed a five-wave upward movement (white). Therefore, it has begun a new bullish trend.
The ongoing decrease is likely part of an A-B-C corrective structure (black). The most likely area for the correction to end would be between the 0.5-0.618 Fib retracement support levels at $25-$29.
For Be[in]Crypto’s latest Bitcoin (BTC) analysis, click here
