


While Ethereum Classic (ETC) is trading inside a short-term bullish pattern, it has yet to show any decisive bullish signs.
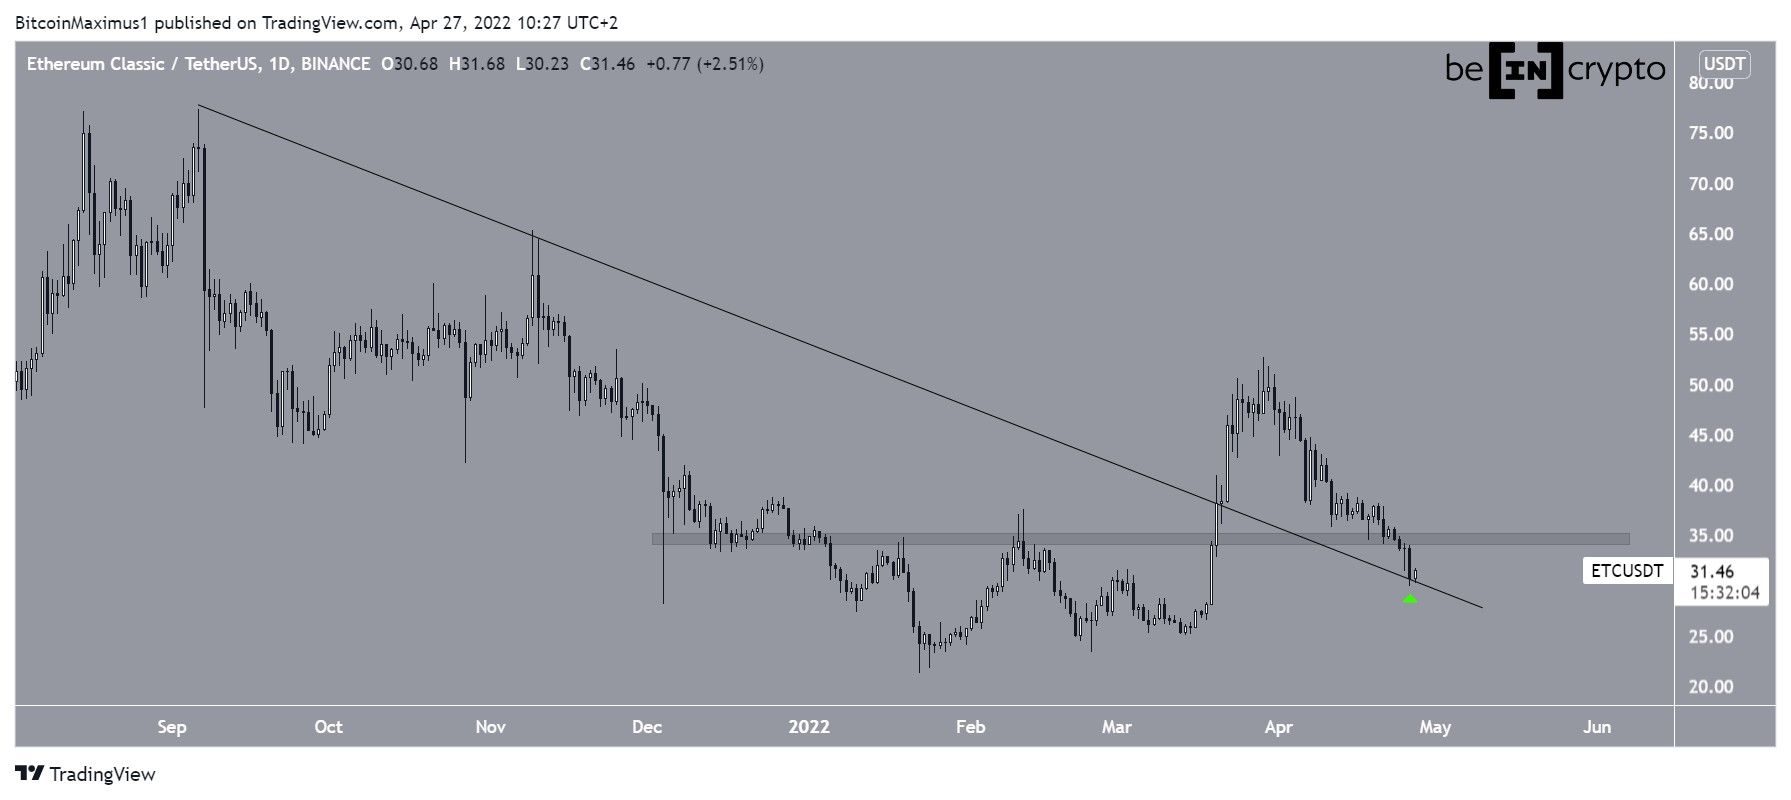
ETC has been decreasing underneath a descending resistance line since Sept 6. The downward movement led to a low of $21.20 on Jan 22.
The price has been moving upwards since, and managed to break out from the descending resistance line on March 20. This led to a high of $52.99 on March 26. But, the price has been falling since.
During the decrease, ETC broke down below the $34.50 area, which is now expected to provide resistance.
On April 26, the price reached a low of $29.88, potentially validating the previous descending resistance line as support (green icon).
Bearish ETC readings
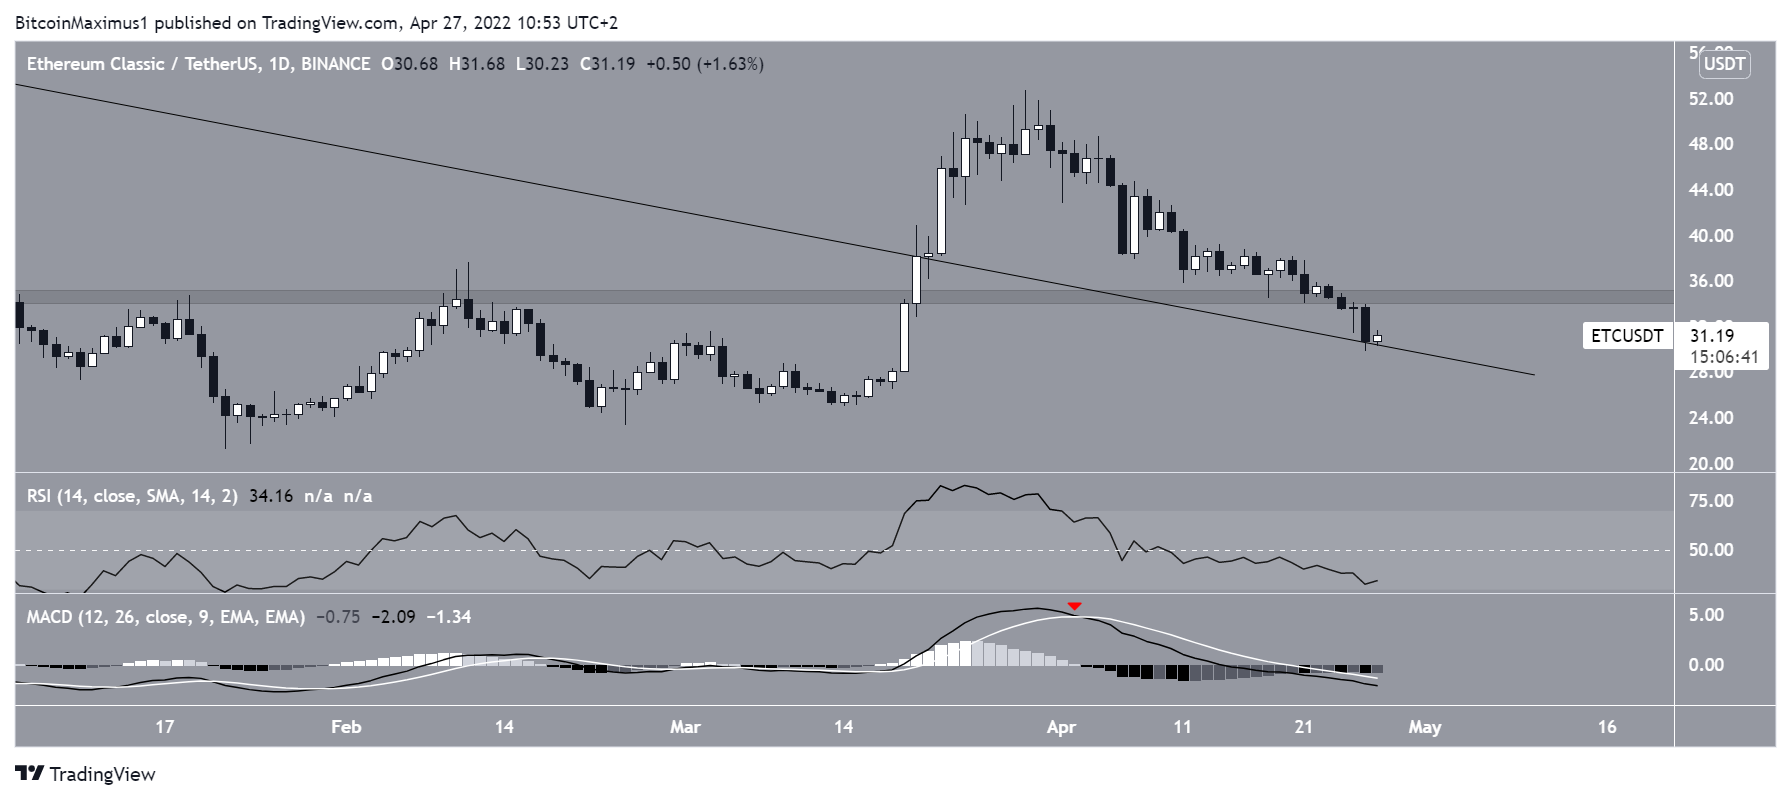
Despite the possibility of a bounce, technical indicators in the daily time frame are bearish. This is visible by the decreasing MACD and RSI.
The MACD has made a bearish cross (red icon) and has decreased well into negative territory. Both of these are considered signs of a bearish trend. Similarly, the RSI has decreased below 50 and is mired in a downtrend.
Therefore, daily time frame indicators are bearish.
Short-term movement
Cryptocurrency trader and investor @livercoin tweeted a chart of ETC, stating that the price could soon break out from a descending resistance line.
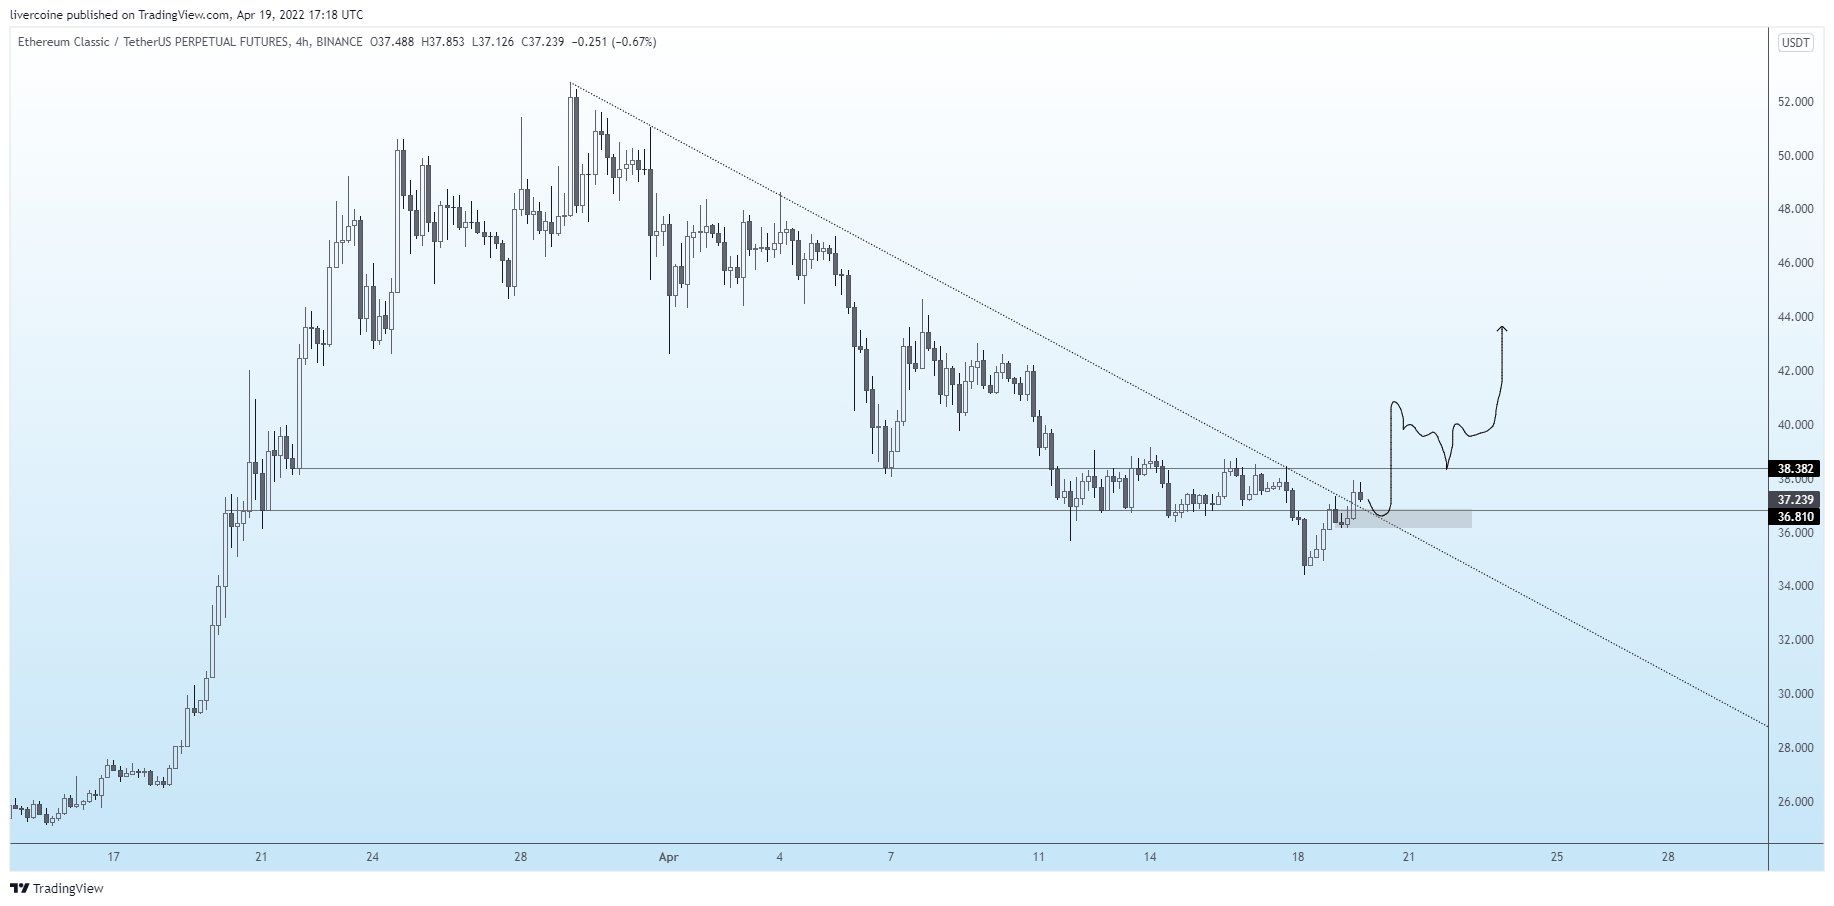
However, since the tweet, ETC has failed to break out from the line and has been rejected by it instead.
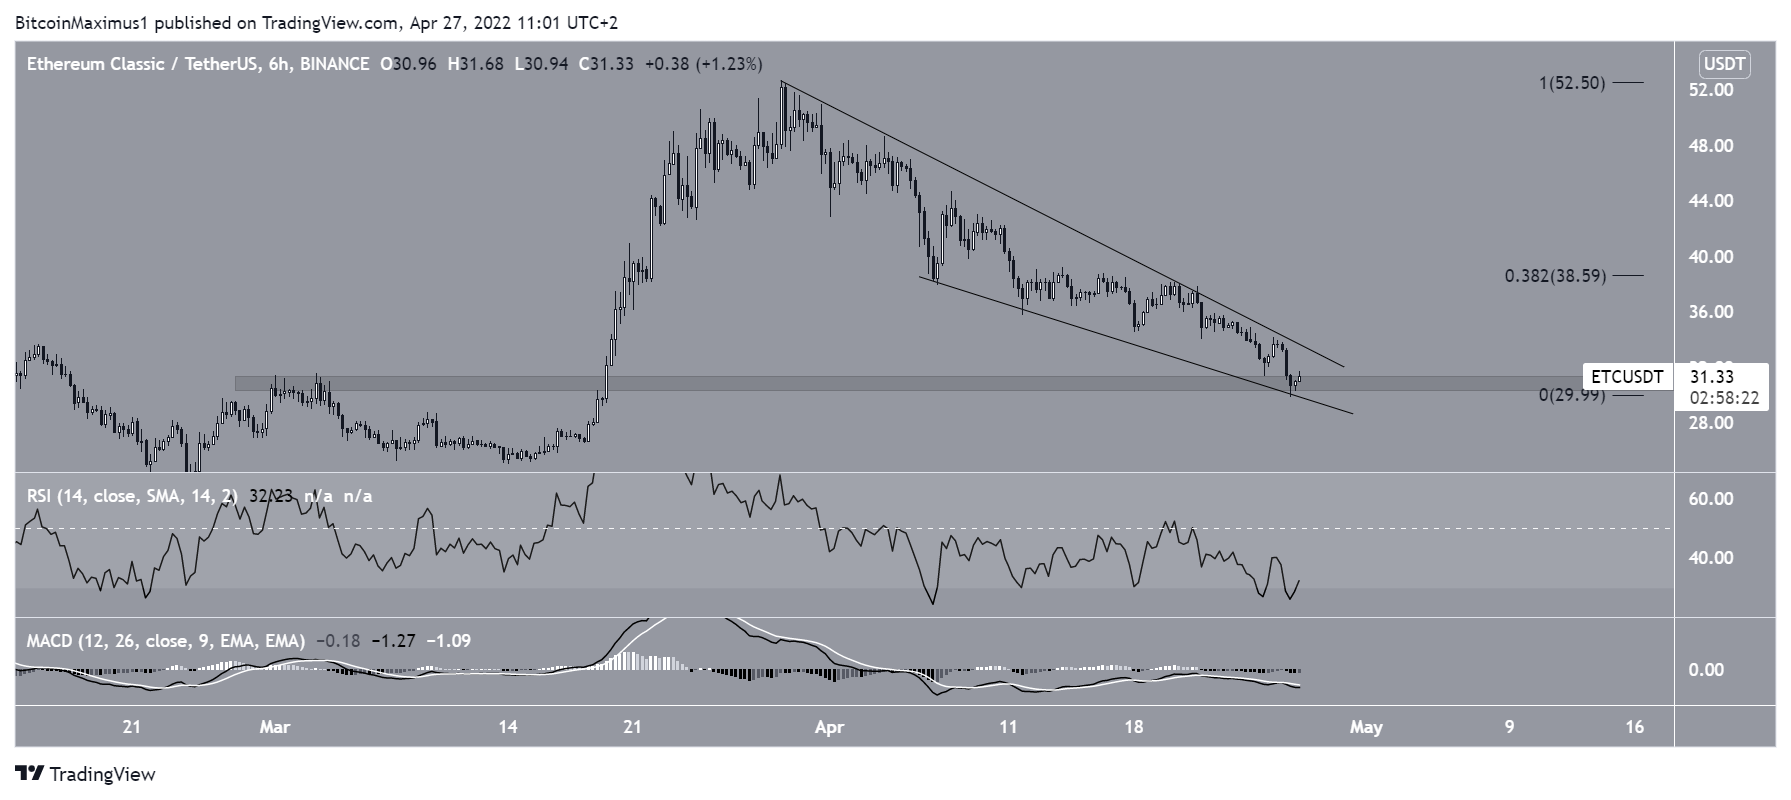
The descent has taken the shape of a descending wedge, which is considered a bullish pattern.
Additionally, ETC has reached the minor $31 horizontal support area.
If a breakout were to occur, the next closest resistance would be at $38.60. This is the 0.382 Fib retracement resistance level. Despite this, there are no bullish signs in place.
For Be[in]Crypto’s latest Bitcoin (BTC) analysis, click here


