


The Ethereum Classic (ETC) price is possibly in its final wave of an Elliott formation. The price could go as high as 73,000 satoshis, before initiating a correction.
The long-term outlook for ETC remains bullish since the price has created a double bottom. A breakout above the aforementioned resistance area would confirm the pattern.
Well-known cryptocurrency trader & investor Nico (@CryptoNTez) stated that the ETC price is in the process of moving above the current resistance level which coincides with the 200-day moving average (MA). In addition, he stated that he is looking for a retest of this area in order to renter the trade, with a target of 73,000 satoshis.
Pushing above ~63k sats resistance level making new HH & potential break from bullish flag..
Crossing above EMA200 on the daily chart with UCTS buy signals on the 1D-5D timeframes…
Volume risingLooking for a R/S Flip as entry with target at ~73k sats level (15%+)#ETC pic.twitter.com/IB1Xc9MktK
— Nico (@CryptoNTez) January 5, 2020
Let’s take a closer look at the ETC price and determine if it is likely to reach this target.
Double Bottom
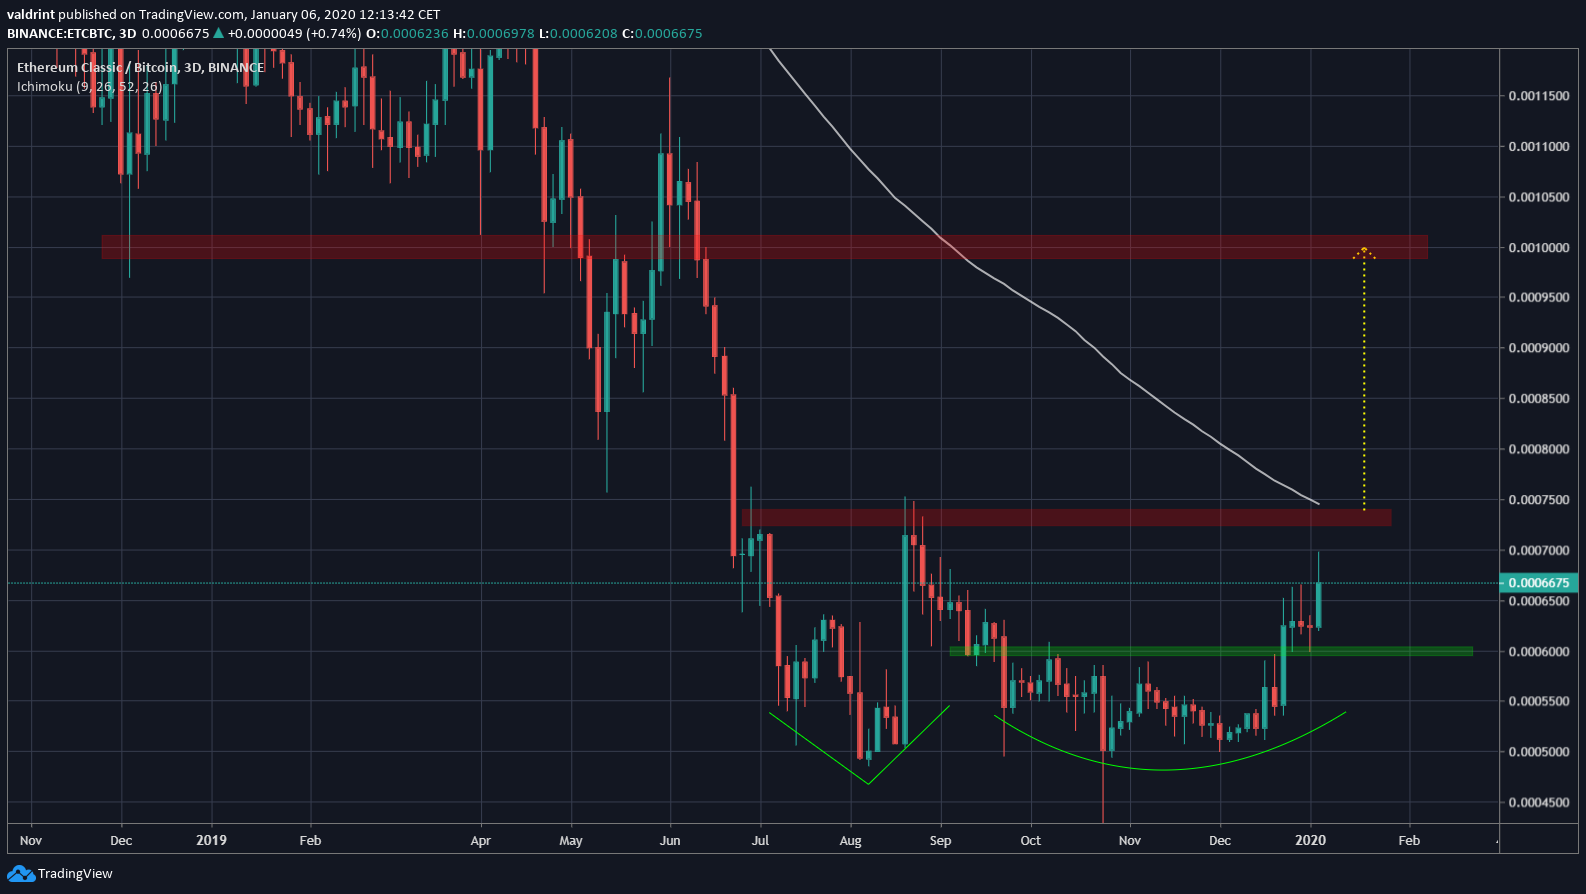
In the period from August-December, the ETC price has created a double bottom (Adam & Eve) near 50,000 satoshis. The main resistance area is found at 73,000 satoshis, a breakout from which would confirm the pattern. This resistance area is supported by the 300-day moving average (MA).
If the price increases the full height of the pattern, it will eventually reach 100,000 satoshis.
Accelerating Rate Of Increase
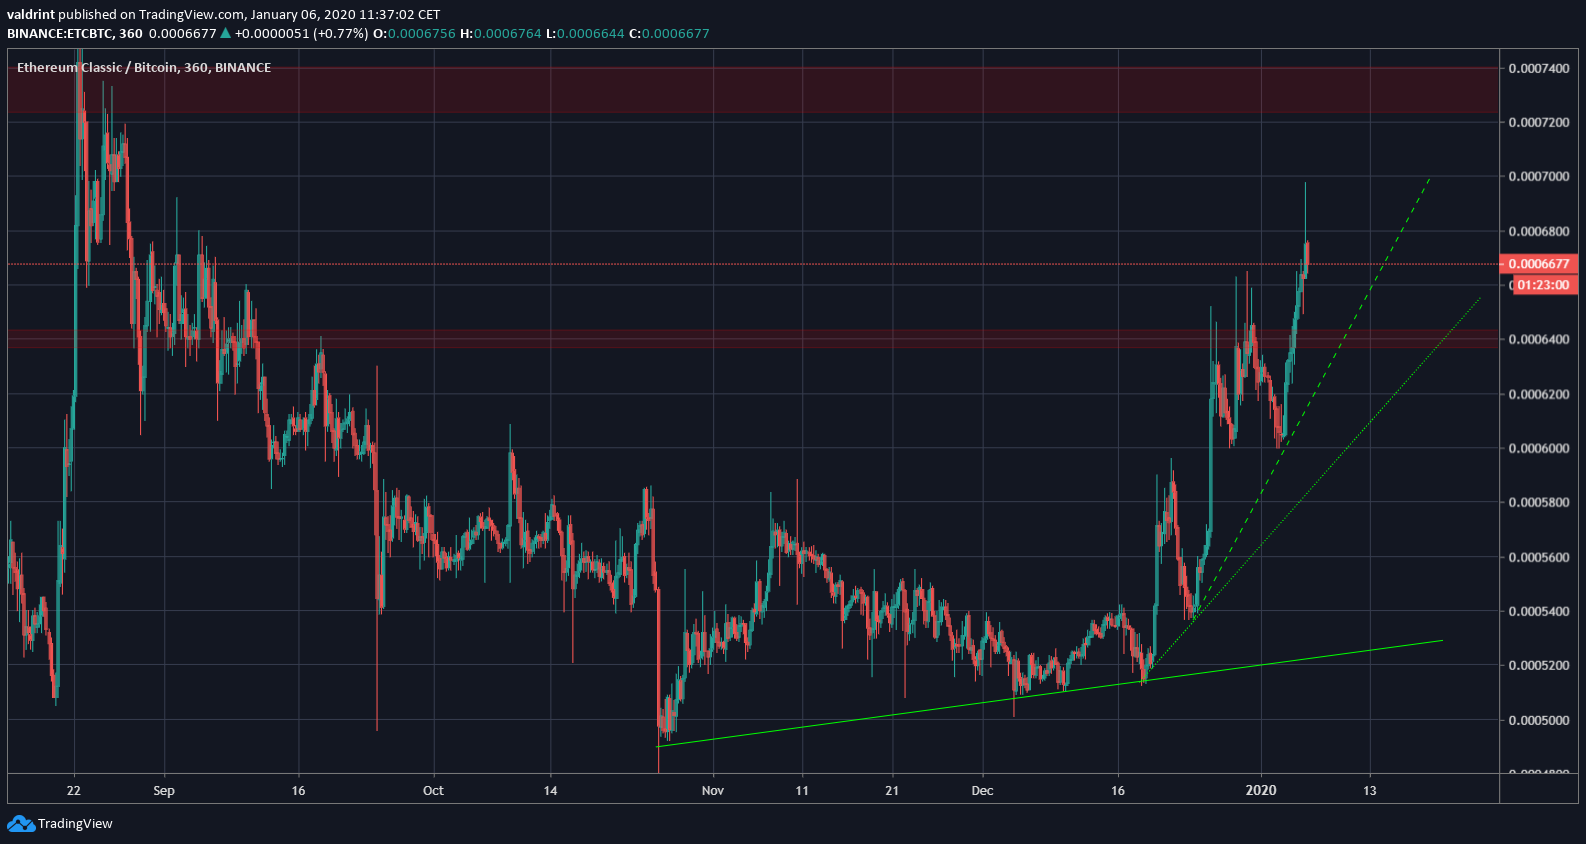
The ETC price has been increasing since October 26 and has made several higher lows.
However, ever time it has done so, it has accelerated its rate of increase, creating a much steeper ascending support line. The price is currently following the third such line.
This is unsustainable in the long-run and indicates that the price could either get parabolic until it reaches 73,000 satoshis or breaks down below the support line and follow a more gradually sloping rate of increase.
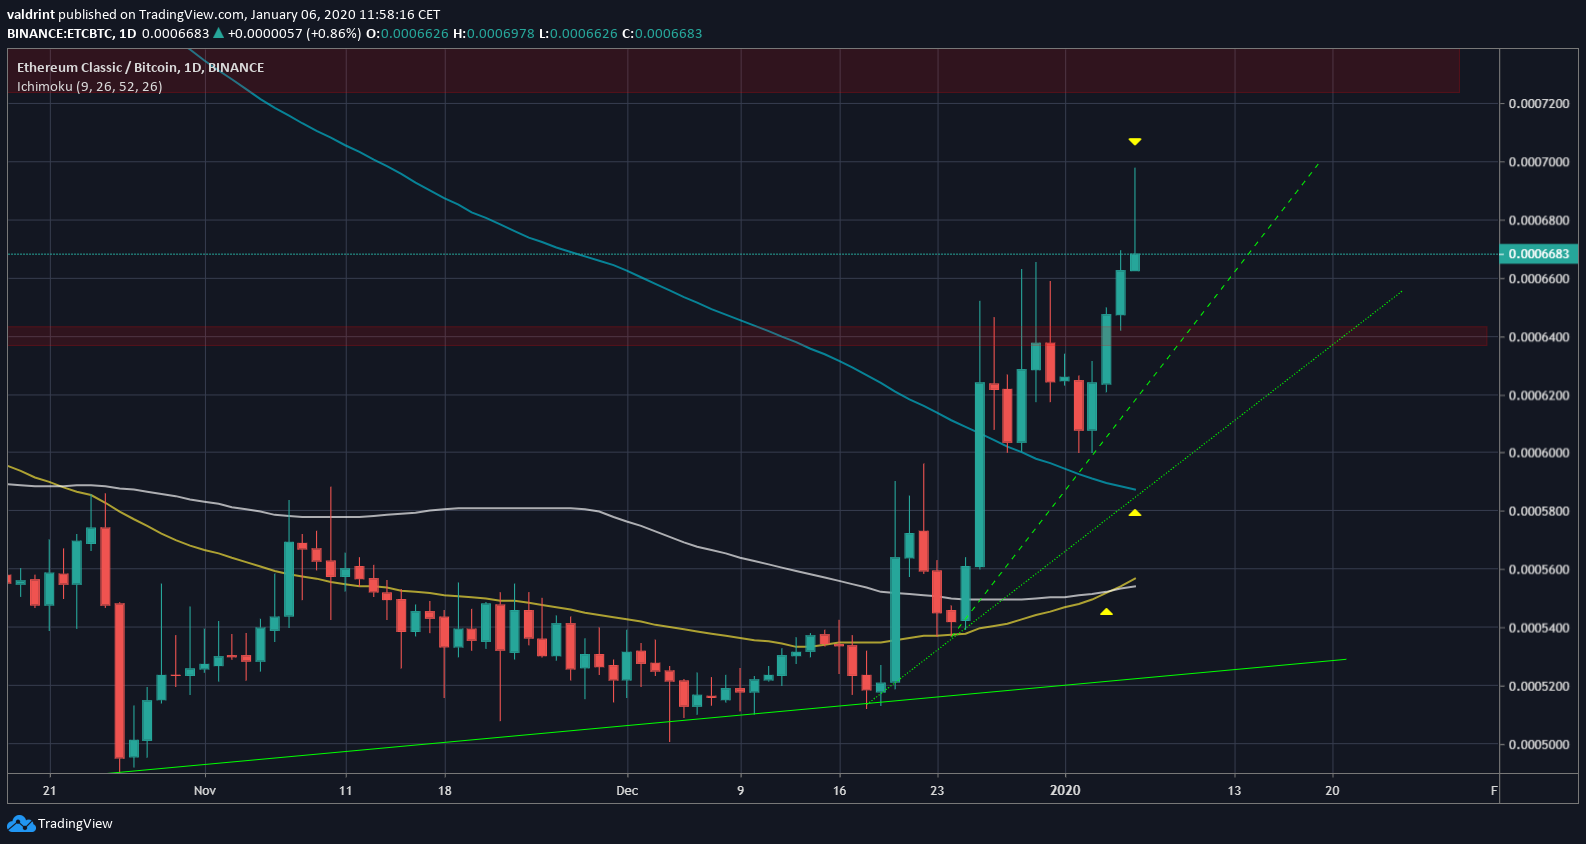
Incorporating daily moving averages, we can see that the price is trading above the 50-, 100- and 200-day MAs. The former has made a bullish cross.
However, the price is way above all of them. Thus, there is no immediate support if the price begins to fall. Finally, the current daily candle has created a very long upper wick. Since there are several more hours left until the daily close, this could lead to a bearish shooting star candle which would likely take the price downwards.
ETC Future Movement
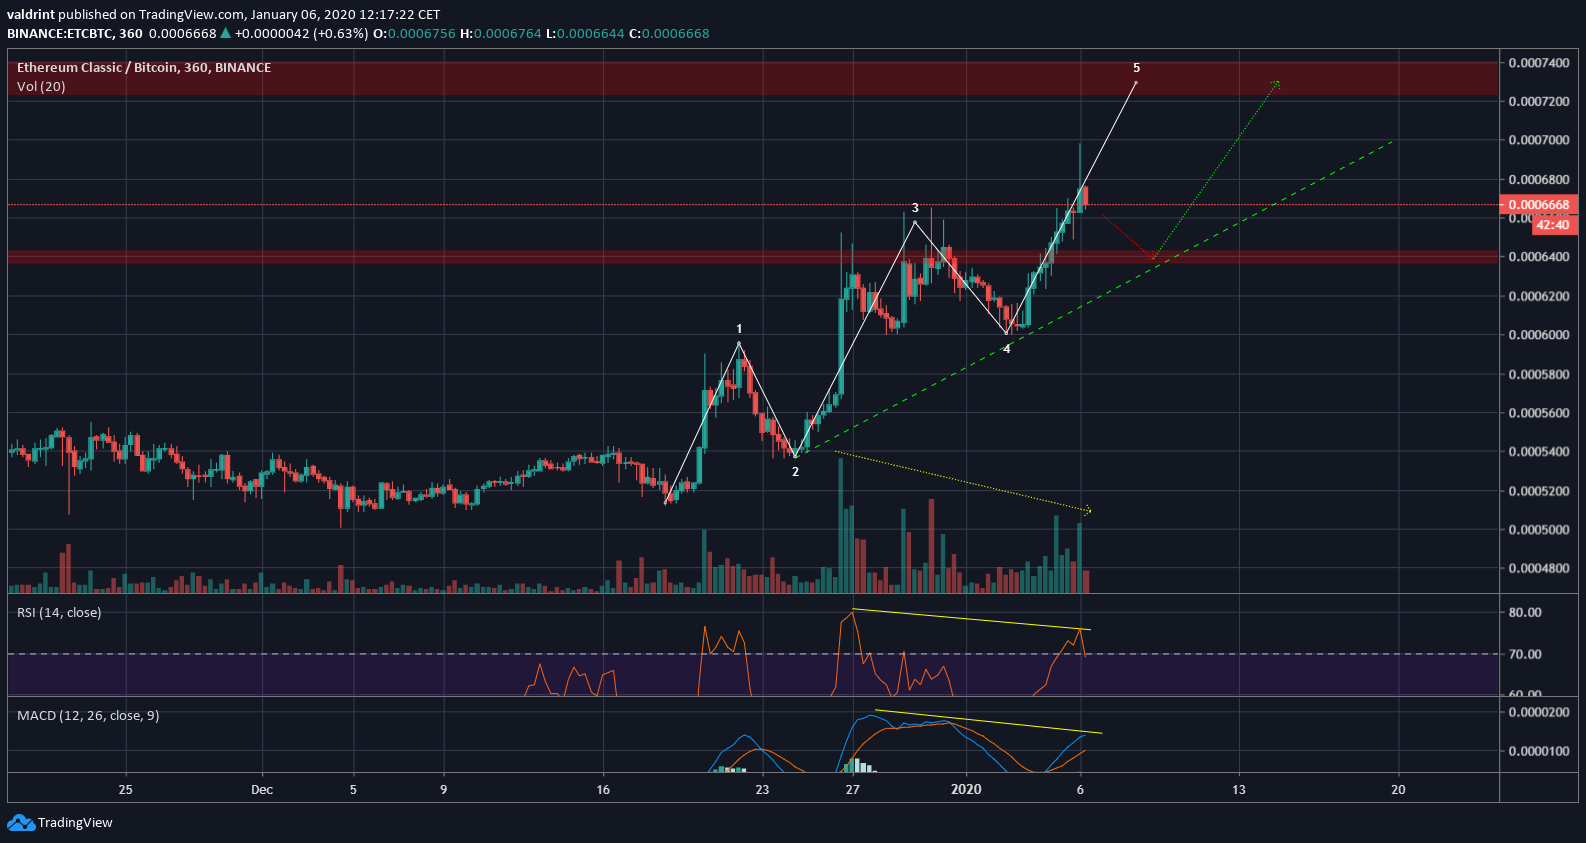
The price structure for ETC reveals a possible five-wave Elliott Formation. The price seems to be in the process of completing the fifth and final wave, which is often the steepest.
This formation is supported by the decreasing volume and bearish divergence in both the RSI & the MACD, which is customary during the fifth wave.
Therefore, as stated in the tweet, we could definitely see a retest of the 64,000 satoshis area, which coincides with the steepest ascending support line. However, the price could also continue its movement and reach 73,000 satoshis.
Once it gets there, several profitable shorting opportunities could likely arise, with a suitable stop loss placement near 75,000 satoshis. On the other hand, attempting to initiate a long at 64,000 satoshis is riskier, since this would entail attempting to enter the trade near the end of the upward move in order to profit from the possibly parabolic increases.
However, an A-B-C retracement usually follows a five-wave Elliott formation, so the price could reverse shortly after entering the trade.
To conclude, the ETC price seems to be in the fifth and final wave of an Elliott Formation. A likely target for the end of this move would be between 72,000-74,000 satoshis. In the long-term, the price is creating a double bottom, suggesting that it might be in the first stages of a bullish reversal.
