
At BeInCrypto, we offer regular price analyses and predictions of the most popular and relevant cryptoassets. In our Apr 30 analysis of Ethereum (ETH), we predicted that the price of Ethereum would increase. Our prediction was invalidated the next day when the price broke out from the pattern we have defined below. To learn more read our latest ETH/USD($) and ETH/EUR(€) analysis below:
On Apr 25, 2019, the price of Ethereum (ETH) made a high above $170 & €152. A sharp decrease followed with lows close to $150 and €135 reached on Apr 26.
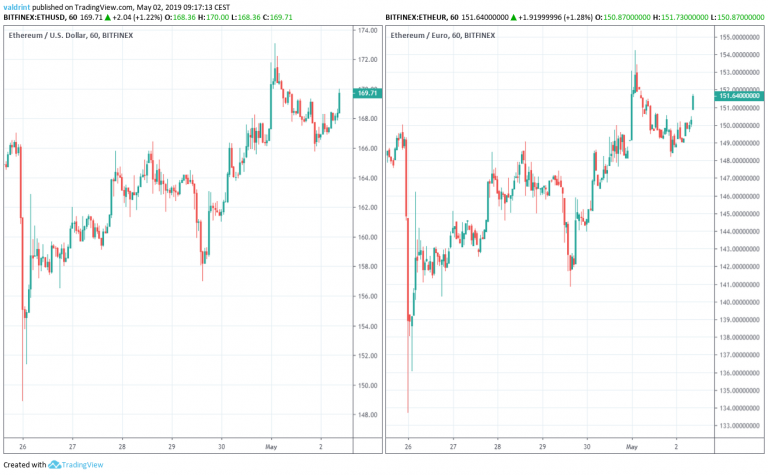
The price has been increasing since. reaching highs above $172 and €154 on May 1.
How long will the price of Ethereum keep increasing?
Let’s find out:
Ethereum (ETH): Trends and Highlights for May 2, 2019
- The price of Ethereum has been on an uptrend since Apr 26.
- It is trading inside an ascending channel
- It is in the process of creating a double top pattern.
- The price is trading inside a longer-term descending channel since Apr 8.
- There is resistance near $179 and €158 and support near $160 and €142.
Ascending Channel
In this section, we define Ethereum’s current trading pattern by analyzing the price of ETH/USD on Bitfinex at one-hour intervals from Apr 25 to May 2. In order not to create confusion, we will not be using images of the ETH/EUR pair until the summary, where the relevant resistance and support areas will be shown in euros and dollars.
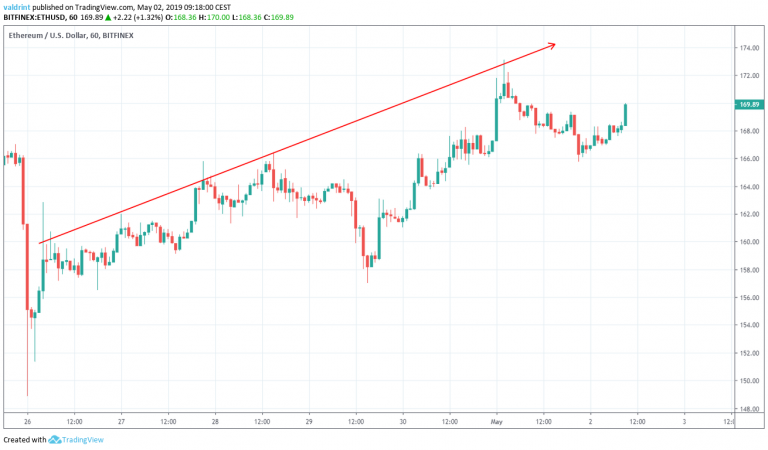
On Apr 26, Ethereum reached an hourly high of $162.86. It has been gradually increasing since, creating several higher highs.
Tracing these highs gives us an ascending resistance line:
On Apr 26, the price reached an hourly low of $148.88 Several market cycles have been completed and the price has created another lower high.Tracing these lows creates an ascending support line, which is drawn parallel to the resistance line.
The support and resistance lines combine to create an ascending channel:
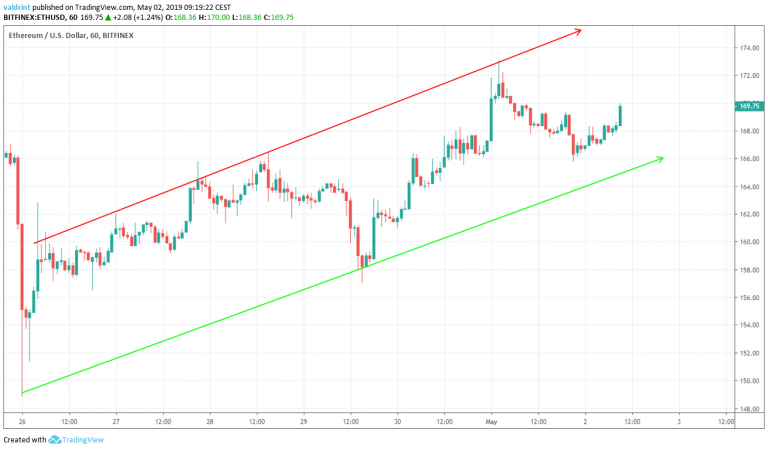
It is likely that the price will trade inside the confines of the channel until a decisive move occurs. To predict the direction of the move, we need to take a look at previous movement.
Previous Movement
The price of ETH is analyzed at two-hour intervals from Apr 8 to May 2.
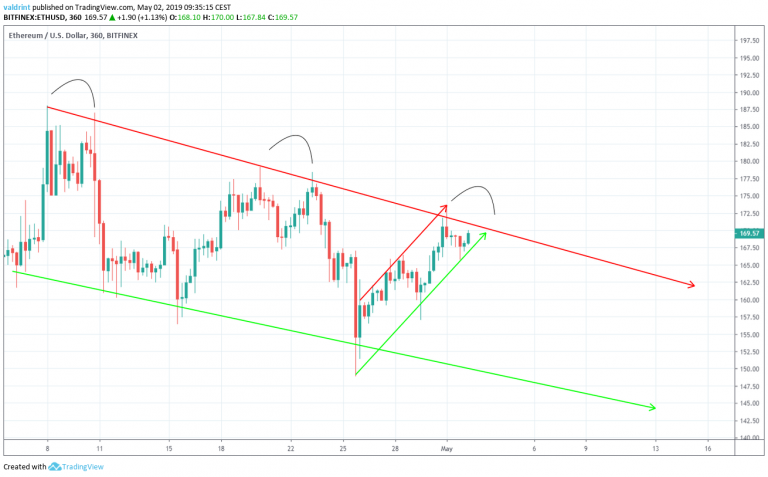
The price has been trading inside a descending channel since making highs close to $187.5 on Apr 8.
At the time of writing, it is very close to the resistance line of the channel.
In the two previous occurrences in which the price has touched the resistance line, it has created a double top pattern, before initiating a rapid decrease.
We believe that we are in the process of creating the third double top, after which a sharp drop will occur.
The creation of this pattern and the previous movement suggests that the price will break down from the short-term channel and head towards the support line of the long-term descending channel.
Reversal Areas
To determine possible price levels following a decrease, we continue with an analysis of support and resistance areas.
Support and resistance areas are created when the price revisits the same level several times. They indicate the levels price might reach in the future based on past patterns.
They are shown for ETH/USD (first graph) and ETH/EUR (second graph) below:
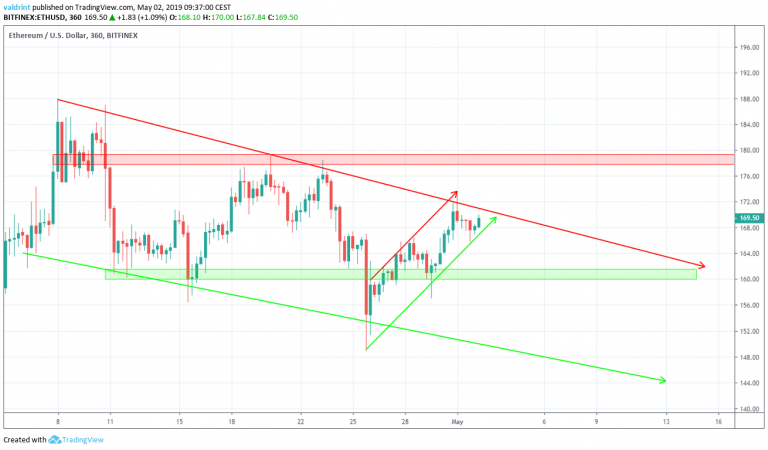
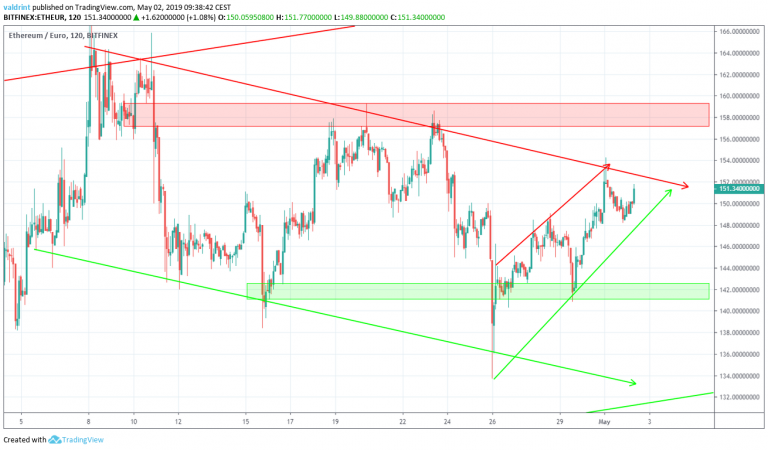
The closest resistance area is found near $179 and €158. If the price breaks out from the channel, it is likely to provide reversal. We do not believe this to be likely.
The closest support area is found near $160 and €142. If the price breaks down from the short-term channel, it is likely to reach this area. We believe this to be likely.
Summary of Analysis
Based on this analysis, the price of ETH is likely to break down from the short-term ascending channel and decrease towards the support area outlined above.
To read 2019 and 2020 Ethereum price predictions, click on the blue button below:
Do you think ETH will reach the support area? Let us know your thoughts in the comments below.
Disclaimer: this article is not trading advice and should not be construed as such. Always consult a trained financial professional before investing in cryptocurrencies, as the market is particularly volatile.
