


On Apr 8, 2019, the price of Ethereum (ETH) made a high of $187.98 & €167.32. A sharp drop followed. Lows of $156.42 & €138.36 were reached on Apr 15.
The price began to increase, reaching highs close to $180 and €160 on Apr 23. A sharp decrease followed with lows close to $150 and €135 reached on Apr 26.
How long will the price of Ethereum keep falling?
Let’s find out:
Ethereum (ETH): Trends and Highlights for April 26, 2019
- The price of Ethereum has been on a downtrend since Apr 8.
- It is trading inside a descending channel.
- The moving averages have made a bearish cross.
- There is support near $120 and €105.
Descending Channel
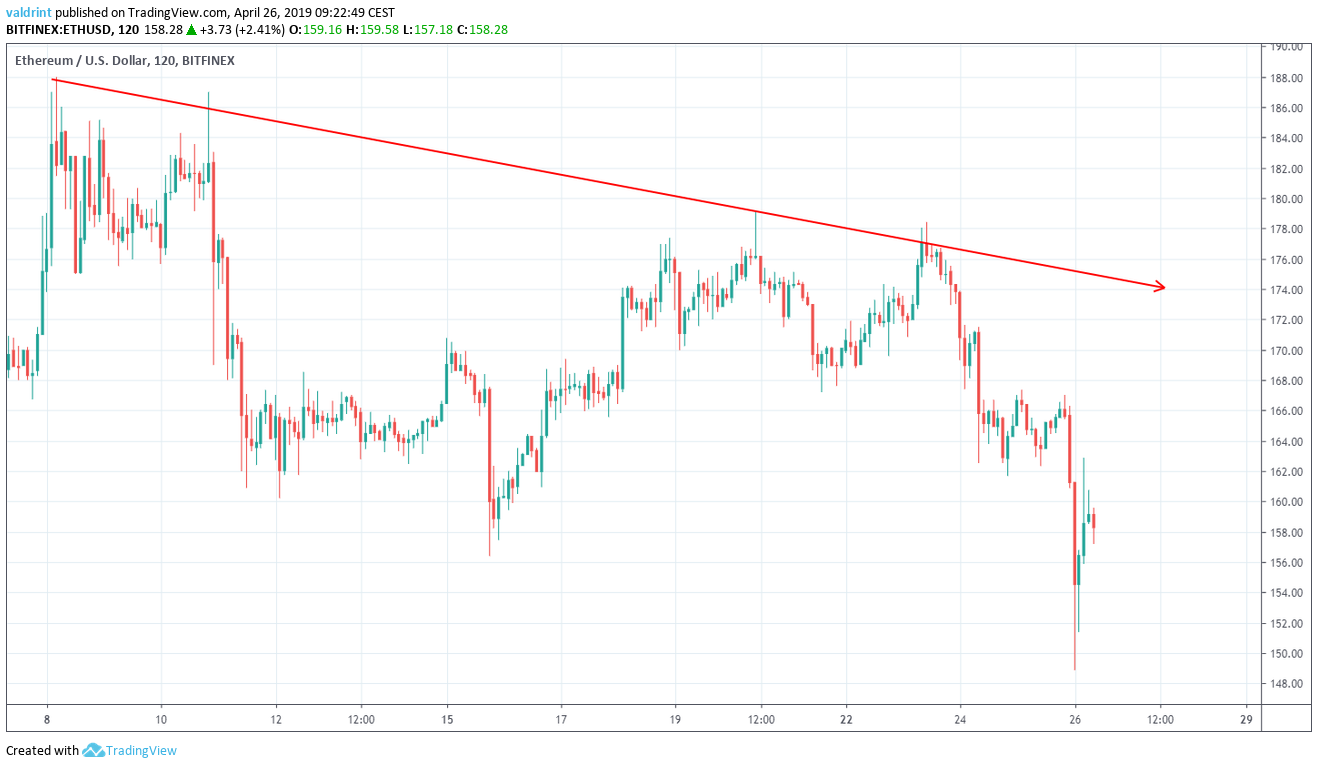
On Apr 8, Ethereum reached an hourly high of $187.78. A sharp decrease was followed by a gradual increase.
The price has made several lower highs. Tracing these highs gives us a descending resistance line:
On Apr 6, the price reached a low of $161.71. Several market cycles have been completed and the price has subsequently created lower lows in the process. Tracing these lows gives us a descending support line.
The support and resistance lines combine to create a descending channel:
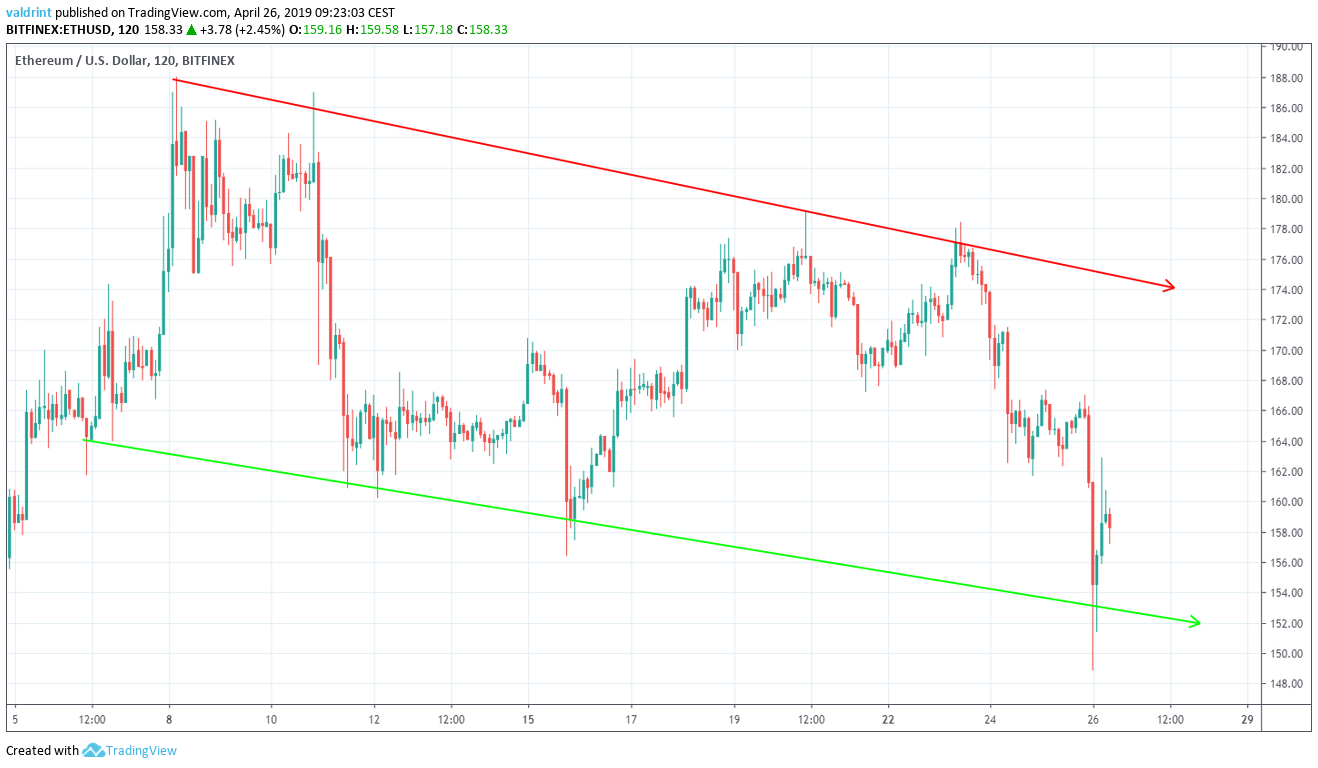
Lows on Apr 26 brought price below the support line. However, prices almost immediately rebounded inside the channel.
It is likely that the price will trade inside the confines of the channel until a decisive move occurs. To predict the direction of the move, we need to take a look at a longer time-frame combined with technical indicators.
Technical Indicators
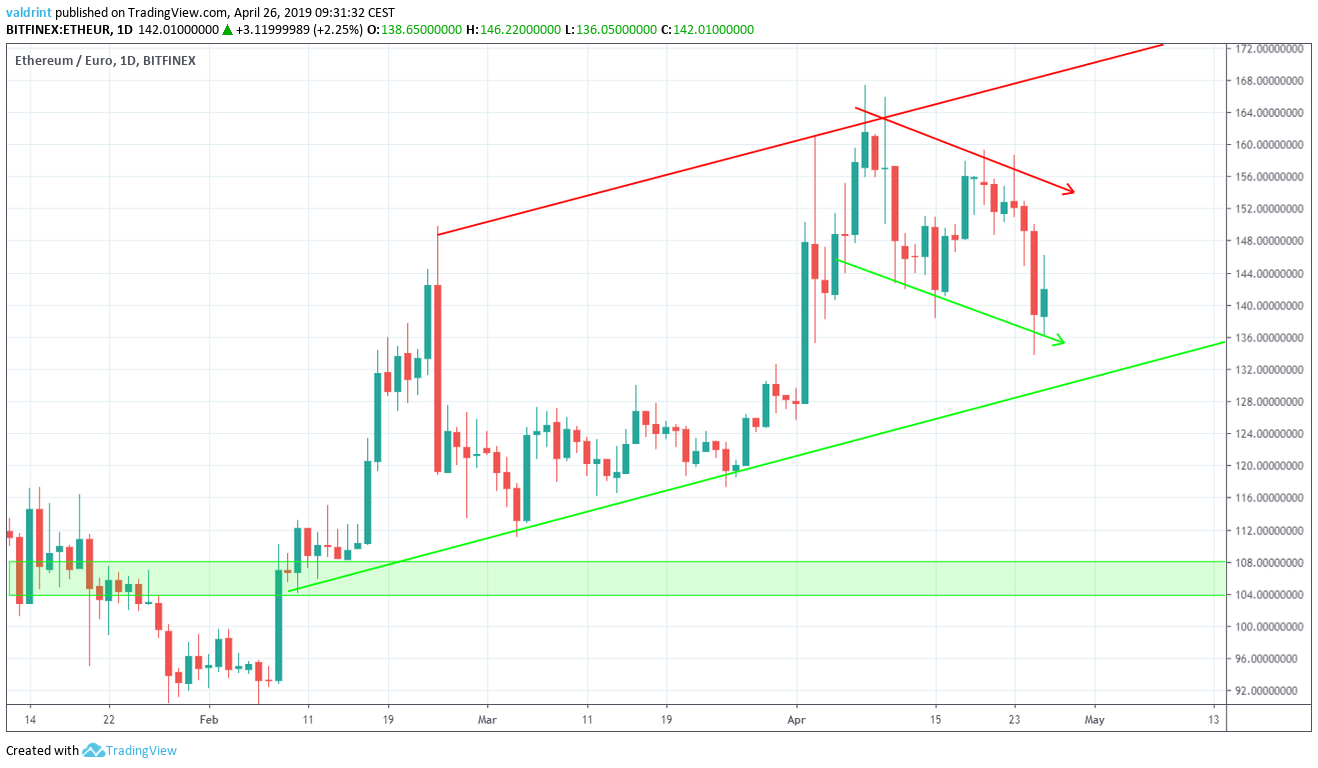
Price since Feb 10 has been trading within an upward facing channel. The descending channel that began on Apr 8 is within this longer-term trading pattern.
In the graph below, both trading patterns are traces with 10- and 20-day MAs:
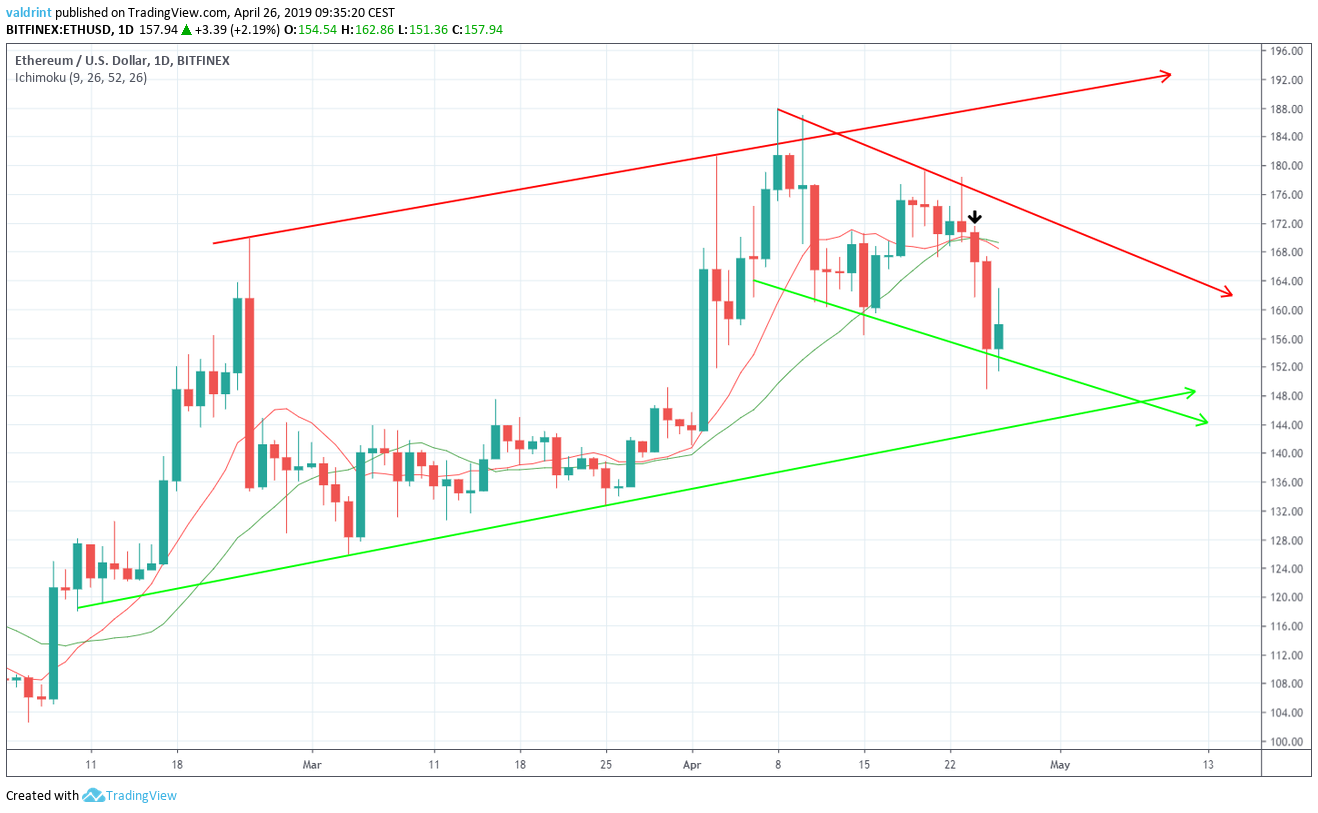
On Apr 23, the 10-day MA crossed below the 20-day MA. This is known as a bearish cross and often indicates that a downtrend has begun.
Using these indicators, it is likely that the price will decrease at the rate predicted by the descending channel. Eventually, it should reach the support line of the longer-term ascending channel.
This is projected to occur around the beginning of May.
Reversal Areas
To determine possible price levels following a decrease, we continue with an analysis of support areas.
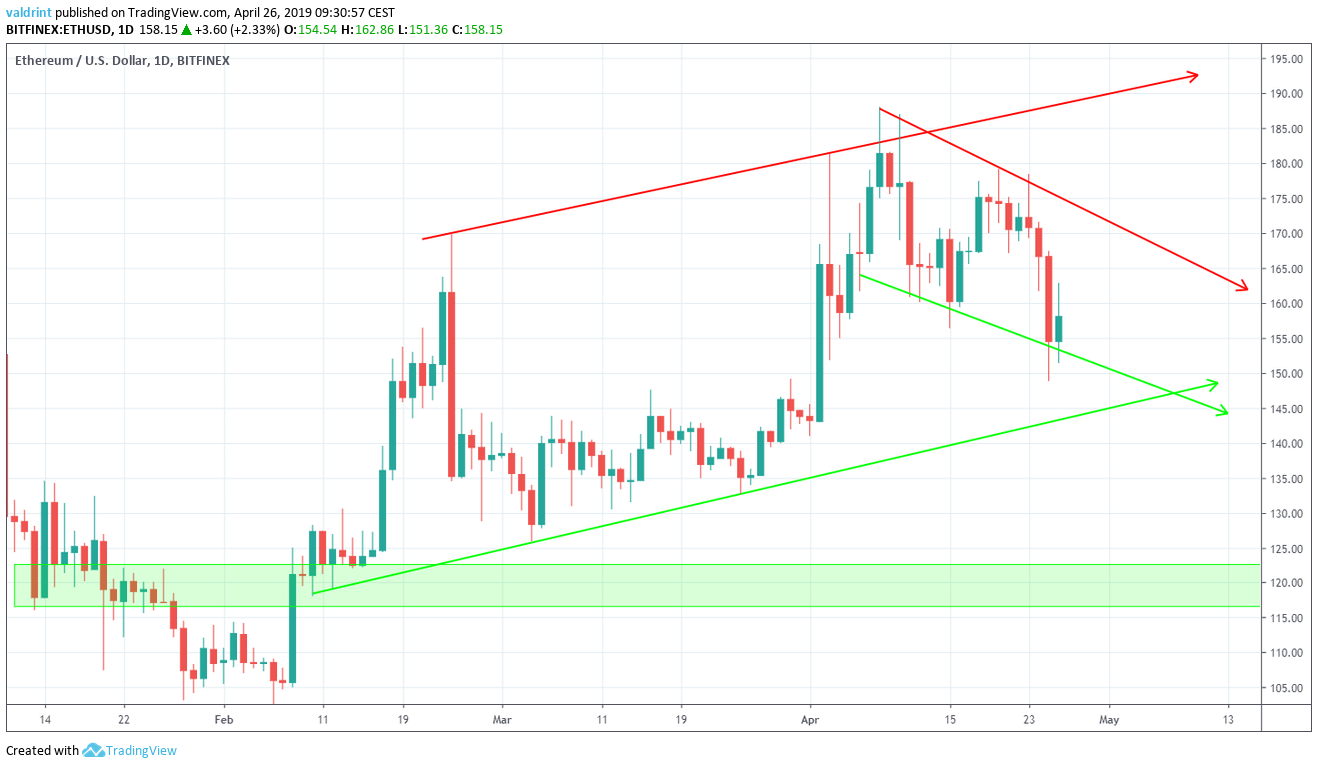
The closest support area is found near $120 and €105. If the price breaks down from the channel, it is likely to reach this area. We do not believe this is likely in the short-term.
Summary of Analysis
Based on this analysis, the price of ETH is likely to decrease towards the support line of the channel. A breakdown is unlikely but possible.
To read 2019 and 2020 Ethereum price predictions, click on the green button below:
Do you think ETH will reach the support line? Let us know your thoughts in the comments below.
Disclaimer: This article is not trading advice and should not be construed as such. Always consult a trained financial professional before investing in cryptocurrencies, as the market is particularly volatile.


