


The year 2020 had several major events occurring for ETH, highlighted by the initiation of phase 0 for the release of Ethereum 2.0.
While phases 1 & 2 have been announced, they are expected to launch later in 2021 and 2020, respectively.
Unlike 2020, The year 2019 was not kind to Ethereum, particularly to its miners, with the mining revenue decreasing by almost 75% during the year. While the 2018 Ethereum mining revenue was $3.7 billion, it decreased to $935 million in the next year. The decrease is even more stark when looking at the comparison with the revenue of BTC miners. While Ethereum miners made $0.72 for every $1 of BTC miners in 2018, that number dropped to only $0.187 the next year.
Similar to the rest of the market, the Ethereum price decreased rapidly in March 2020. This rapid drop has also caused the fees on the Ethereum network to skyrocket. As BeInCrypto has reported, extreme demand for Ethereum has previously shown the faults of the network in their ability to handle increased demand in a short period of time, as was the case with the Ethereum-Based CryptoKitties game. The recent developments show that the network is not yet ready to facilitate such large scale transactions.
However, during this entire decrease, the Ethereum whales have been accumulating, as is visible by the total holdings of the top-10 wallets with the highest Ethereum holdings, which have been continuously increasing their totals, arriving at a 10-month high of 9.76 million ETH.
While Ethereum has become an important player in the world of decentralized finance, this was also tested severely on March 12, when the ETH price decreased by roughly 30% in only 24 hours. MakerDAO, which is the biggest player in the Ethereum-based DeFI, was even considering an emergency shutdown due to the market collapse.
Nevertheless, ETH has been increasing at a rapid pace since March, having done so by more than 1000% and at the time of writing was trading very close to its all-time high of $1440.
Short-Term Outlook
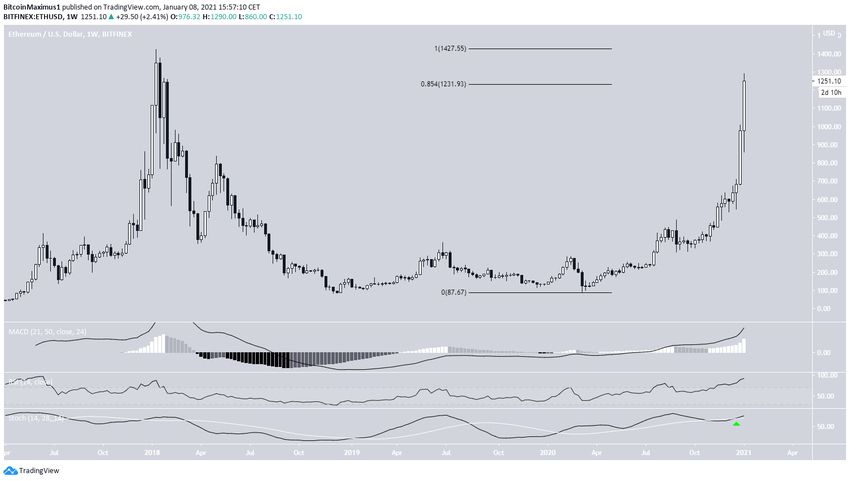
The weekly chart for ETH shows that the price has finally moved above the final Fib retracement resistance (0.85) before it reaches its all-time high resistance area at $1450.
While technical indicators show a considerably overbought rally, there is no weakness yet in the form of bearish divergence that would suggest that ETH has reached a top.
To the contrary, a weekly close above this final resistance area would indicate that ETH is likely heading towards the $1450 resistance area and possibly a new all-time high price.
While short-term trading can be stressful, due to the high volatility and numerous movements such as fakeouts that are near impossible to predict, BeInCrypto has created a telegram group to provide daily discussions about recent price movements as well as educational content intended to help traders of every skill level.
Click here to join the FREE telegram group
Technical Analysis
On Oct 22, 2015, the price of Ethereum (ETH) reached a bottom at a price of $0.41. This low was followed by an upward move that eventually lead to a high of $21.21, reached on June 14, 2016.
Ethereum began to decrease afterwards, decreasing to single digits before the years end. However, the ensuing upward move took it to an all-time high of $1423 on January 13, 2018. The price has been decreasing since, marking a more than two year downward trend.
In the table below, we have outlined three important highs and lows throughout the price’s history, which will be used in order to make a prediction about the price in a future date in time.
In this analysis, we attempt to predict the price at the end of 2020 and 2021, as well as the price five years in advance.
Seeking Similarities
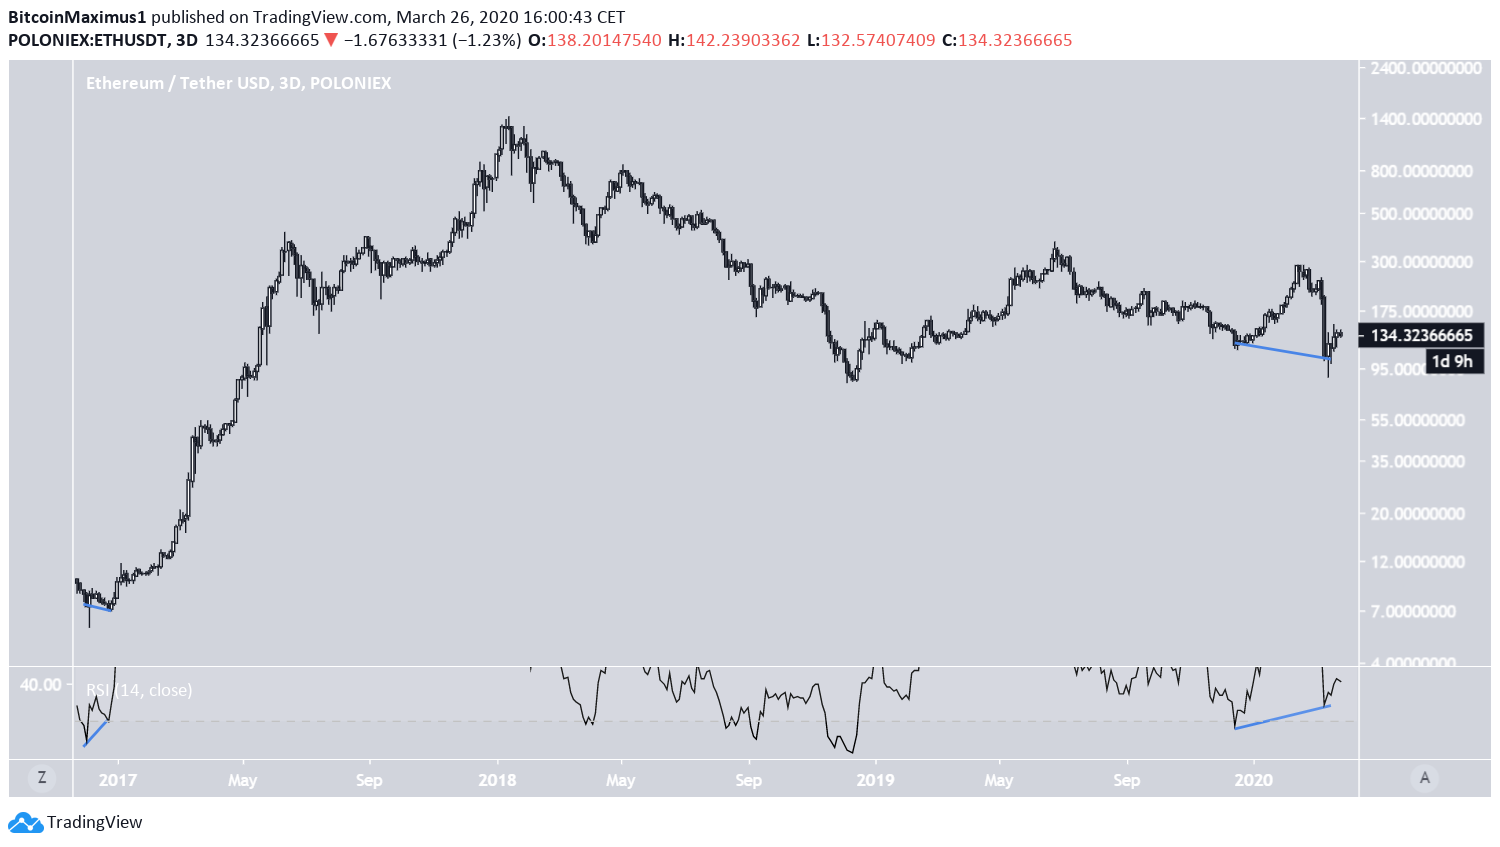
In order to do that, we will begin by seeking to isolate similarities between Ethereum price movements at different points in time. The first thing that stands out when looking at the all-time chart is the three day RSI. Throughout Ethereum’s entire price history, there are only two times that the 3-day RSI has generated bullish divergence.
The first came in December 2016, near the first bottom outlined in the table. The second one transpired over a longer period of time, more specifically from December 2019 to March 2020.
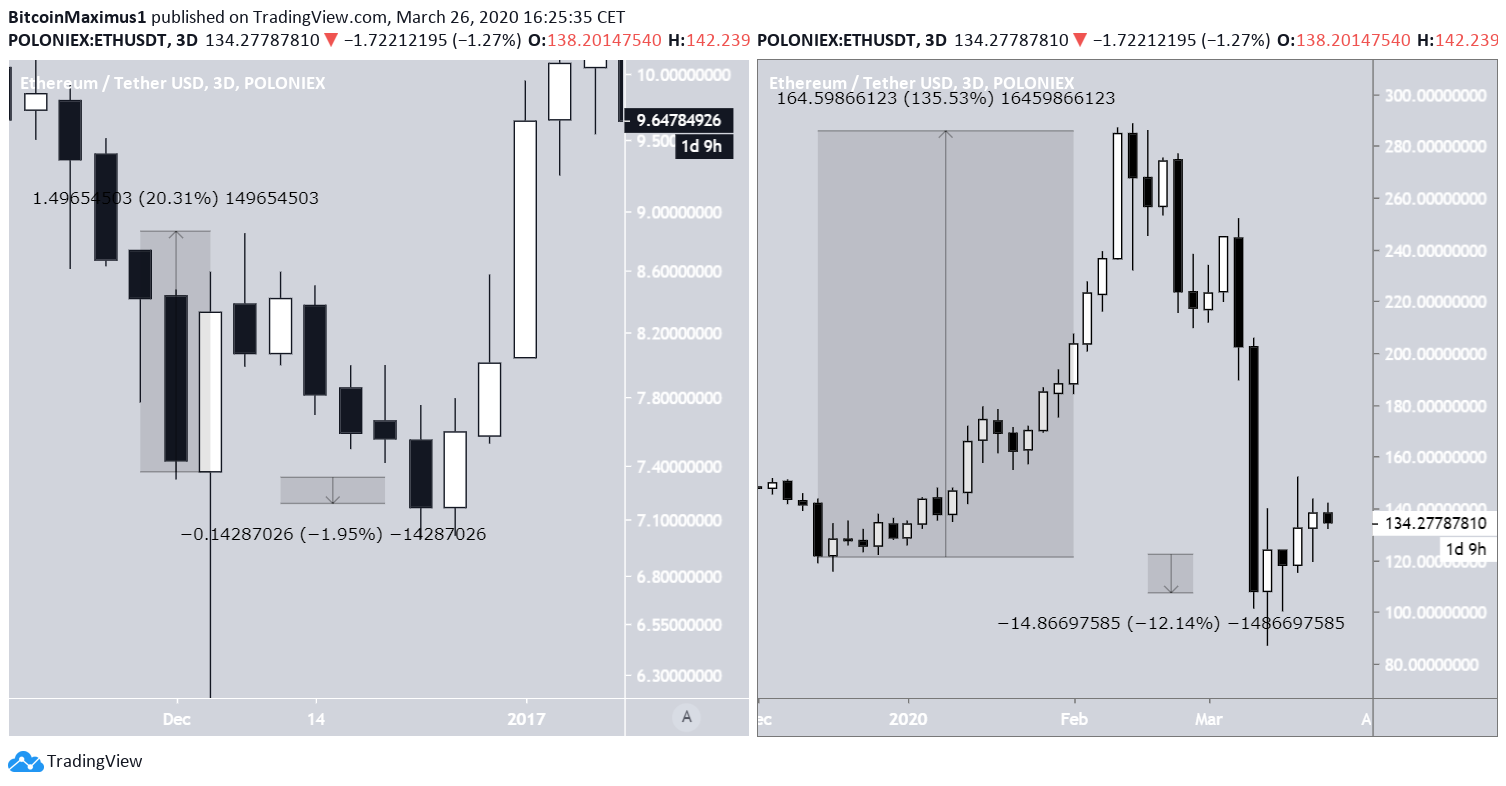
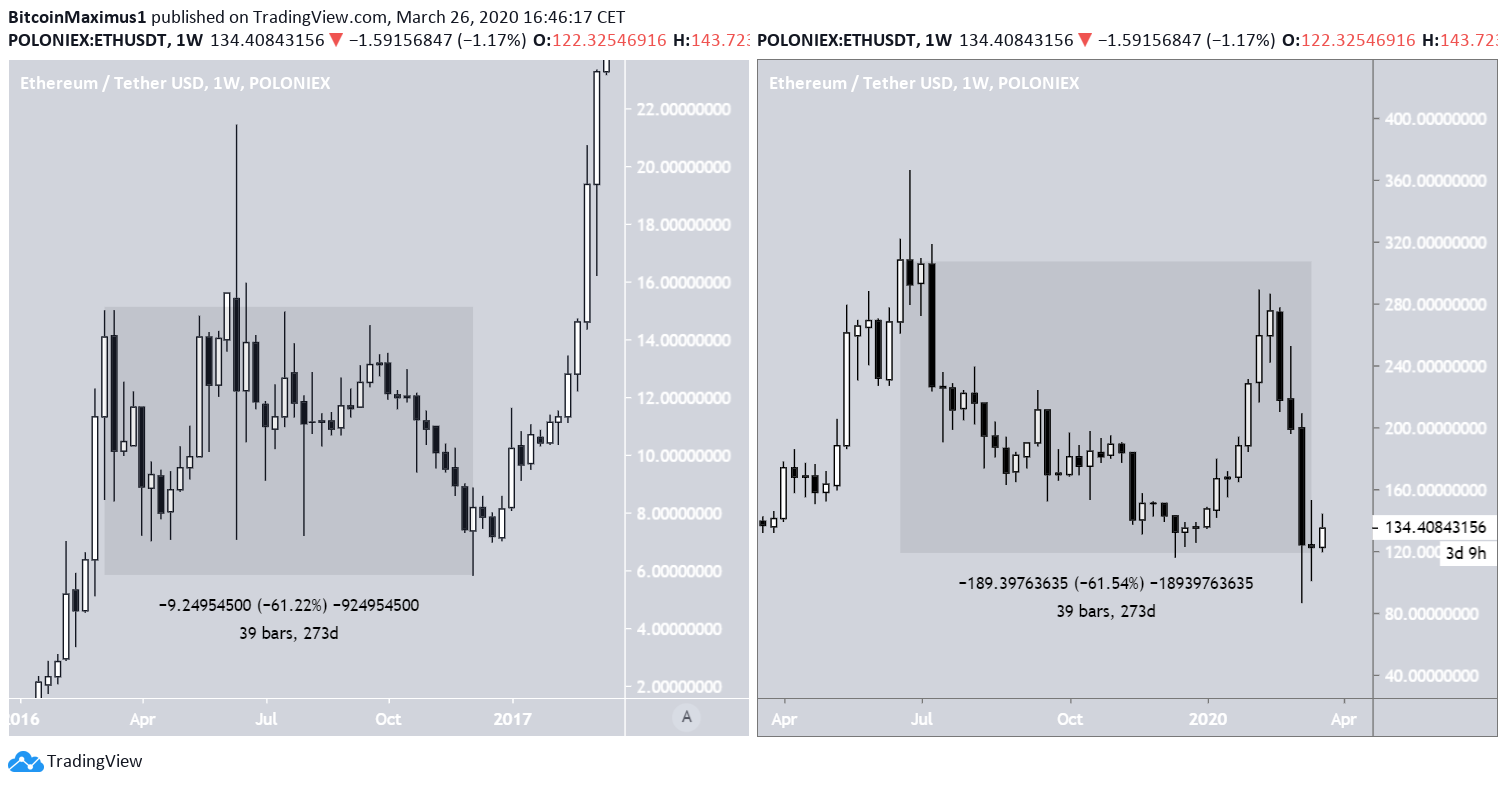
Looking closer at both movements reveals even more similarities. There was a strong upward move in between the two bottoms and the second bottom was lower than the first. In the 2016 movement, the high was 20% higher than the first bottom while the low was 2% lower. In the 2020 movement, the high was 135% higher than the first bottom while the low was 12% lower.
Therefore, the ratio between high and low remains almost identical, being slightly higher than 10 both times, even if the magnitude in absolute terms differs significantly, being more than six times bigger in the 2020 movement.
In addition, the amount of time between the two bottoms in 2016 was 21 days, while the same bottoms measured 86 days in between in 2020. Therefore, the movement was 4 times longer in 2020.
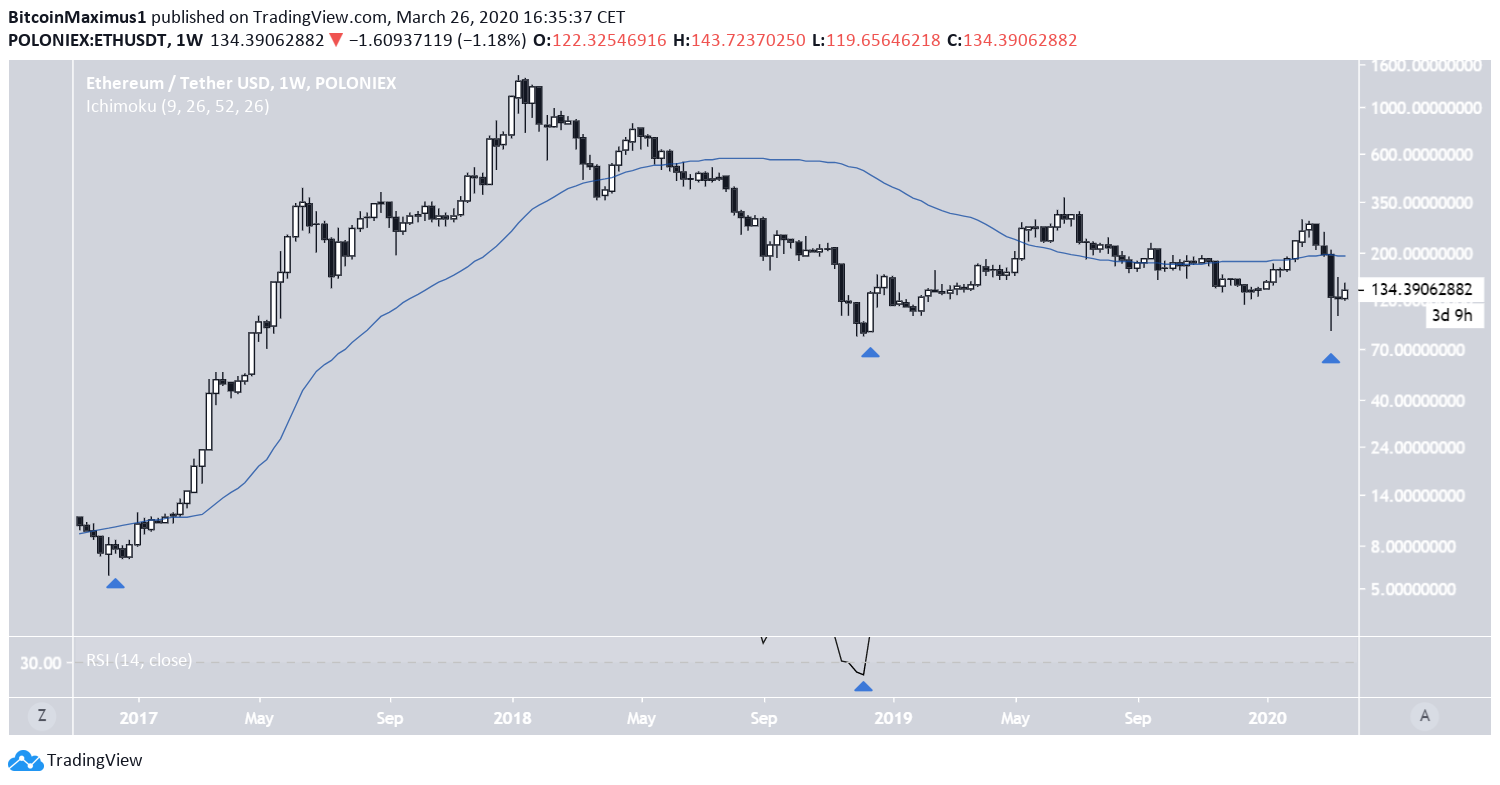
Another similarity comes from the price’s relationship to its 50-week moving average (MA). The two bottoms marked the only two periods in which the price briefly decreased below the 50-week MA.
Even though there is an almost seven month period from May to December 2018 in which the price was below this MA, we are not considering this similar to the other two bottoms, because of its RSI reading. The weekly RSI is completely different that the two periods we are looking at, being way below 30, while it was at 48 in the other two cases. Therefore, we are considering this bottom dissimilar to the other two when making a prediction.
Finally, the next similarity comes from the price movement alone. Even if the bullish divergence bottoms were different in time period and magnitude, the movement preceding the two lows has been almost identical both in the time period and decrease beginning from the previous high.
Therefore, it is entirely plausible that these bottoms represent similar points in their respective market cycles.
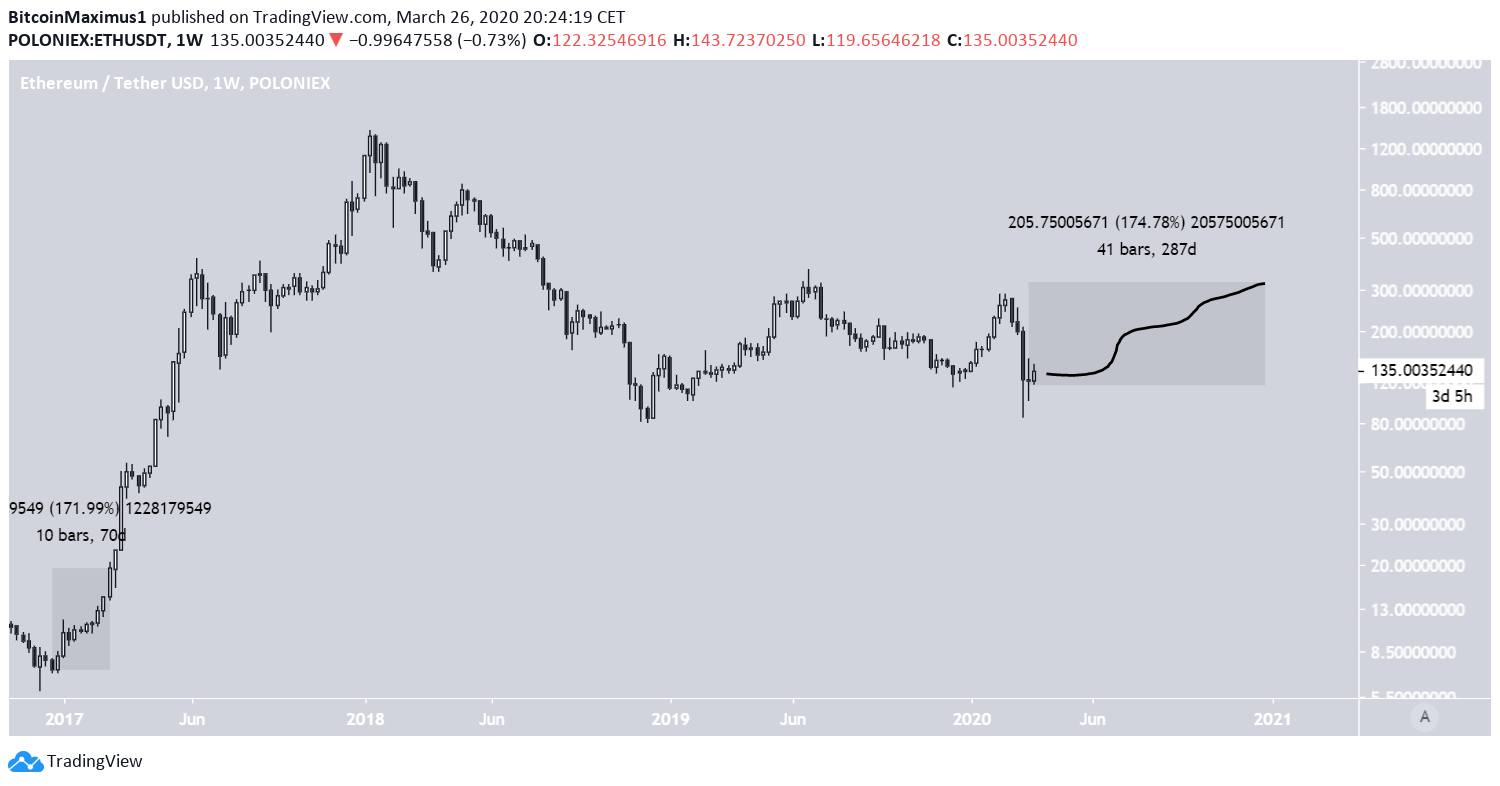
Ethereum Price Prediction 2020
While the rates of increase/decrease were the same, we found out in that the time period between the two bottoms was four times longer in the 2020 movement. Therefore, in order to make a prediction for December 31, 2020, which is 282 days from now, we will find the price 70 days after the December 2015 bottom, and transfer its rate of increase to the current bottom.
Doing so, we arrive at a high of $323 for the price on December 31, 2020.
Ethereum Price Prediction 2021
We will use the same method to find the price in the end of 2021, but we will instead use the price 161 days after the December 2016 bottom, which is 1/4 of the time until December 31, 2021.
Doing so we arrive at a price of $2800 by the end of 2021.
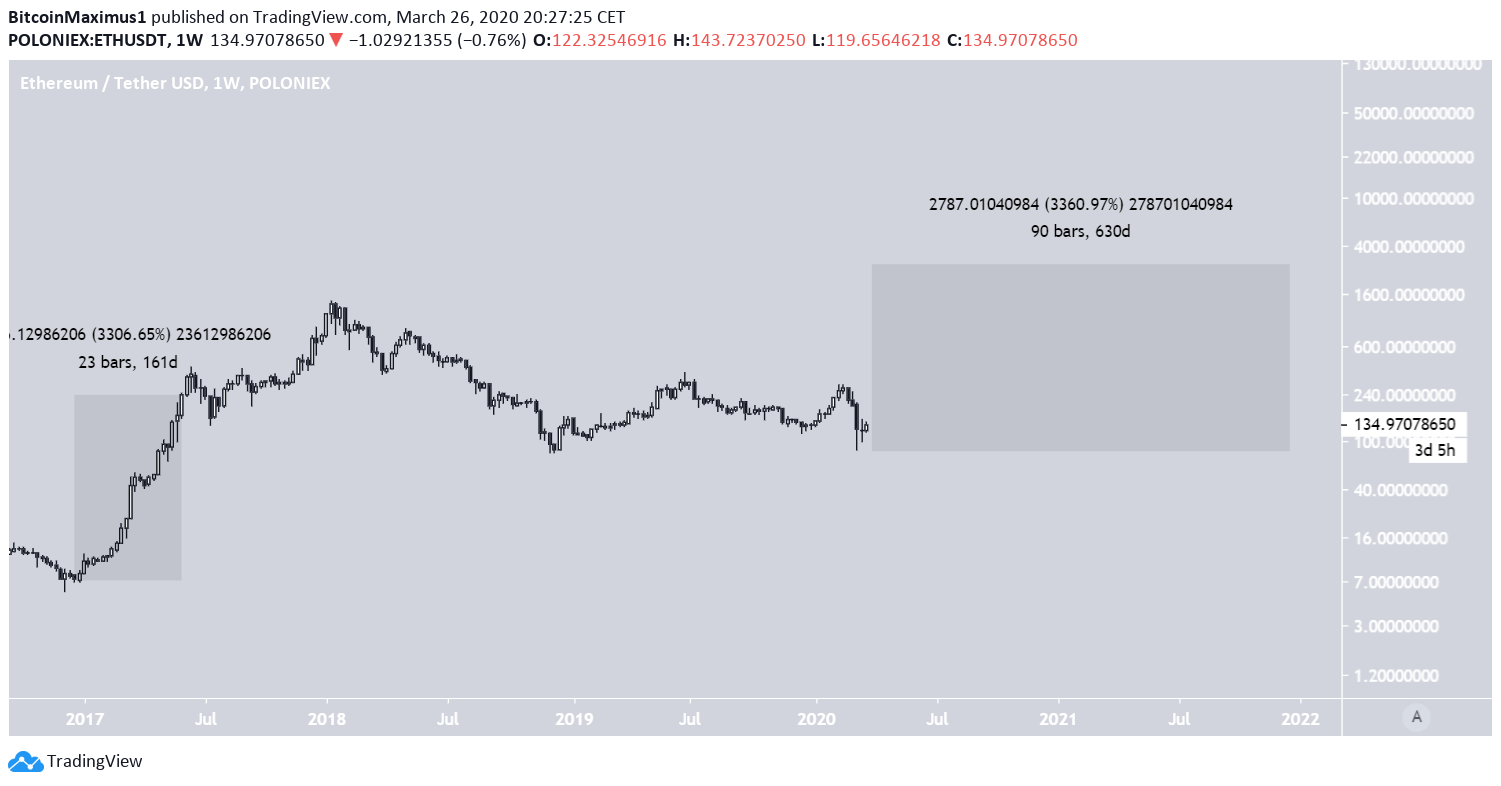
The movement since March 2020 has been predicted relatively, since the current price is above the prediction, but a significant drop within the next 10 days could cause ETH to reach it.
While the previously outlined ”price of $2800 by the end of 2021” is still valid, the price movement over the last few months allows us to make an alternate prediction using a similar method.
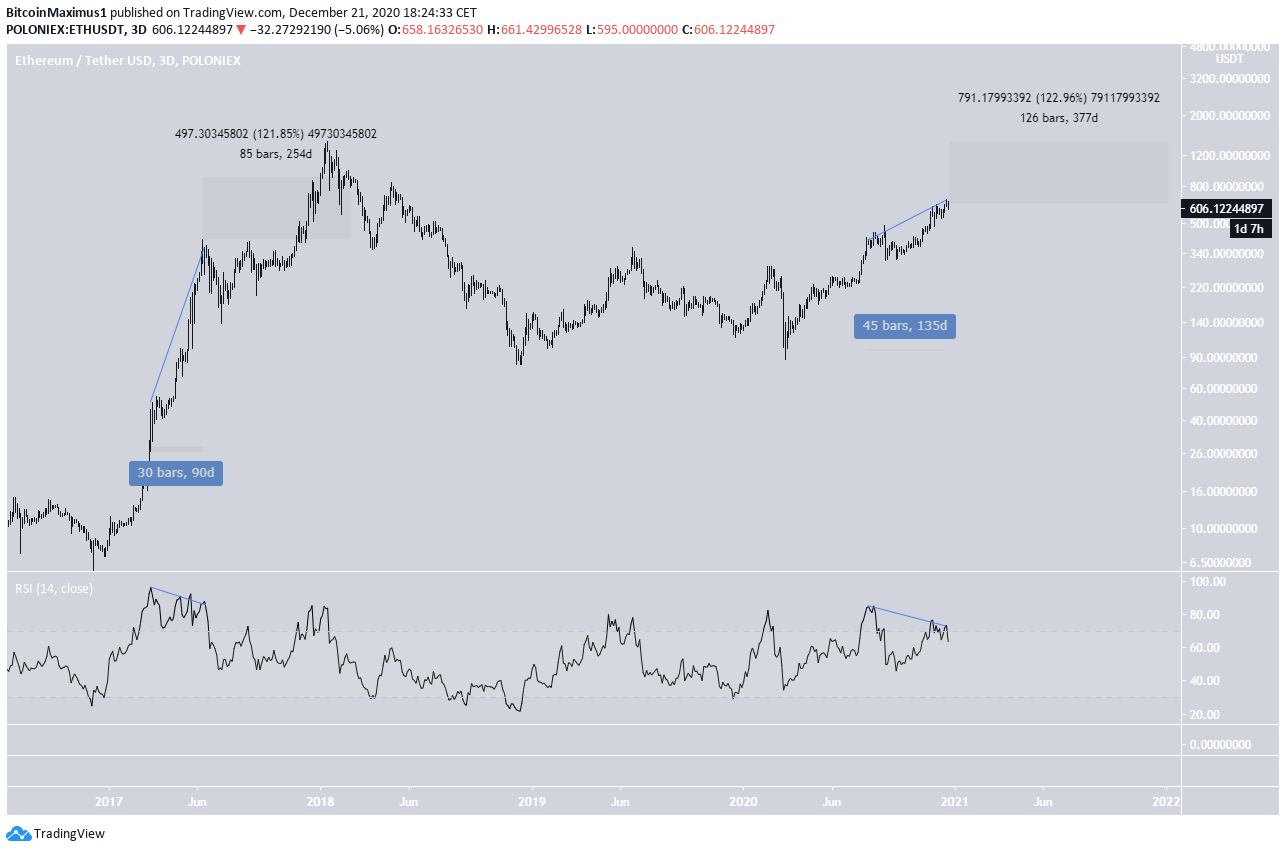
Just how the RSI had generated bullish divergence only twice in the prices’ history, it has similarly generated bearish divergence twice. Interestingly, it has increased afterwards.
The first instance of bearish divergence occurred over a 90-day period in Mar-Jun 2017, while the second one over a 135 day period in Aug-Dec 2020.
Therefore, we can makes the assumption that the current movement is 1.5 times slower than that in 2017.
Doing that but keeping the same rate of increase, we arrive at a high of $1450 on Dec. 31, 2021.
Ethereum Price Prediction 5 Years
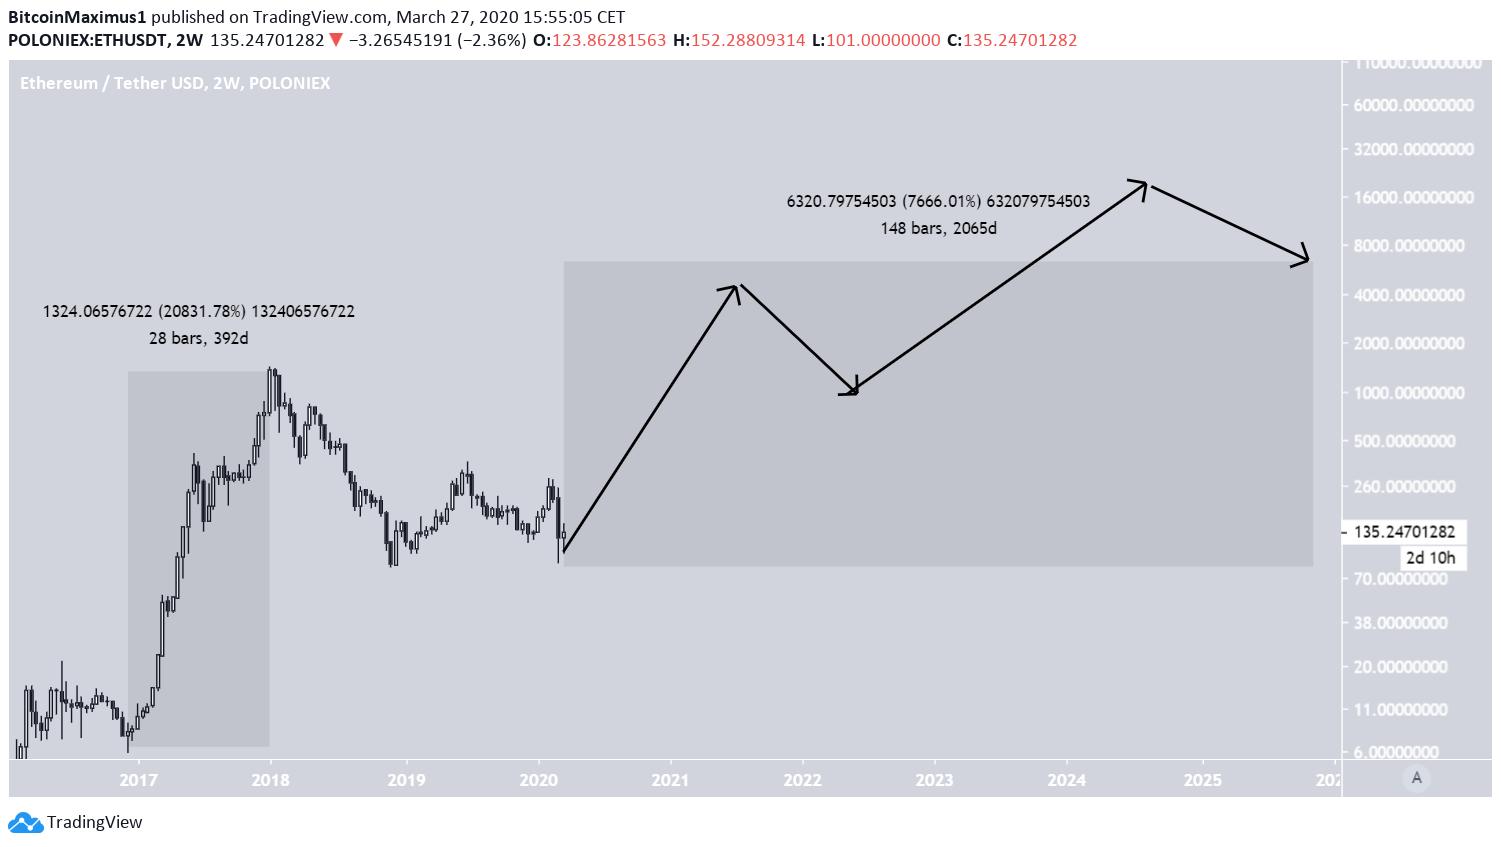
Continuing with the use of the same method, we are able to arrive at a price of $6400 for December 31, 2025.
However, prior to doing so, the Ethereum price is expected to reach an all-time high of $19,000 on July 2024, prior to a decrease that leads to our target of $6400.
It is worth noting that on this prediction we are attempting to predict the price five years in advance of an asset hat barely has five years of price history, so this long-term prediction is bound to be less accurate than the short-term ones.
Conclusions
To conclude, there are numerous similarities between the current Ethereum bottom and that on December 2016, leading to the possibility that they represent similar points in the price’s respective market cycle.
Therefore, our predictions are made presuming that the price will continue to act in a similar way as it did after the December 2016 bottom.
What do you think of our ETH price prediction in 2019 and our Ethereum forecast for the future? Do you think ETH can recover in 2018? Let us know your thoughts in the comments below!


