
THE LATEST ANALYSIS IS HERE! CLICK TO READ OUR UPDATED PRICE PREDICTIONS FOR ETHEREUM!
March 22 Analysis and Price Predictions
On Mar 4, 2019, the price of Ethereum (ETH) made a low of $124. A sharp increase ensued, followed by a gradual decrease. Afterward, another sharp increase took the price above $145, before a second final downward movement began. How low will the prices go? Can we expect a reversal soon?
Ethereum (ETH): Trends and Highlights for March 22, 2019
- The price of Ethereum has been on an uptrend since Mar 14.
- ETH had been trading inside an ascending channel.
- It broke down from the channel on Mar 21.
- Etherum is now trading inside a symmetrical triangle.
- There is bullish divergence developing in the RSI and the MACD.
- There are resistance areas near $153 and $145.
- There are support areas near $134 and $128.
Previous Breakdown
The price of ETH on Bitfinex was analyzed at 30-minute intervals from Mar 18 to Mar 22. On Mar 18, the price made a high of $140.91. A gradual increase ensued with each high being higher than the previous one. Tracing these highs gives us the resistance line. The price made a low of $138.30 on Mar 18 before immediately rebounding to $139.30. Since then, a gradual uptrend followed with each low being slightly higher than the preceding one. Tracing these lows gives us an ascending support line.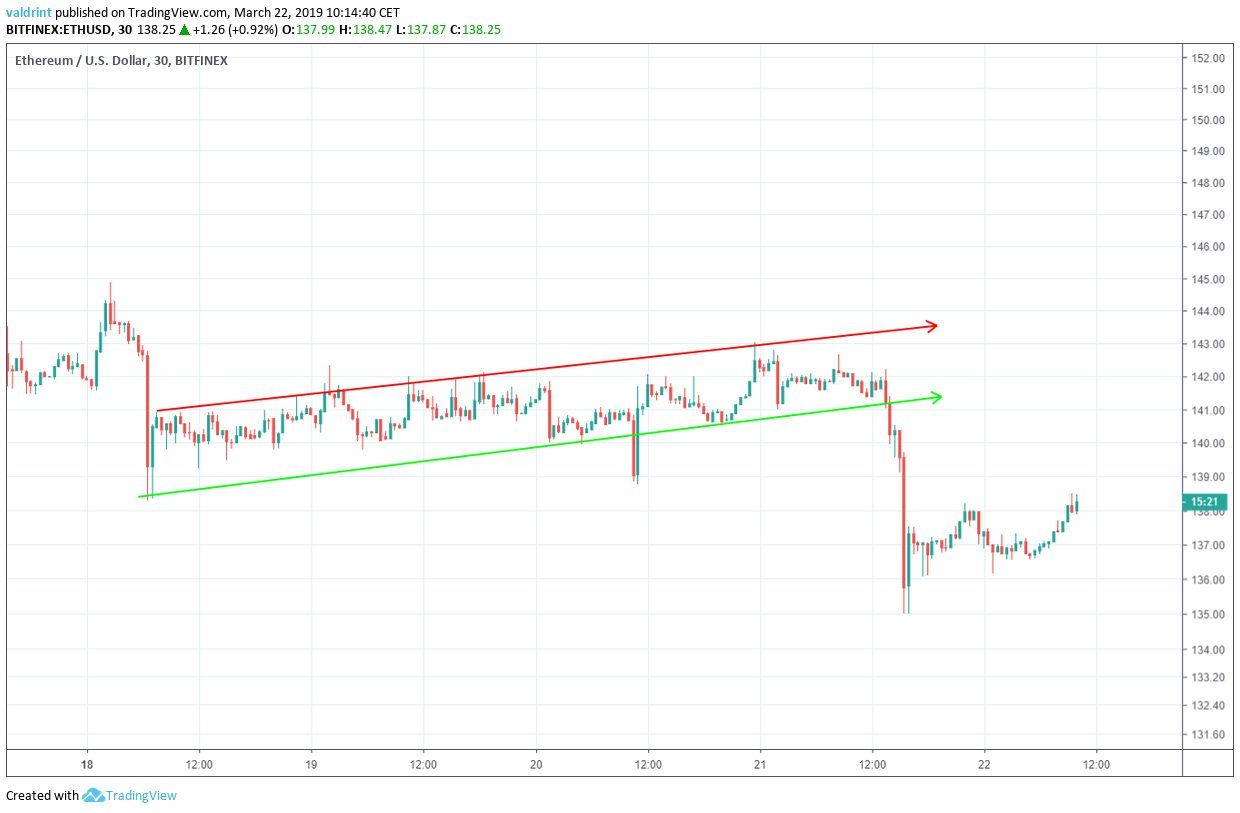 The support and resistance lines combine to create an ascending channel, which is considered a neutral pattern—suggesting the equal likelihood of both price increases and decreases within the channel. However, the channel also was facing slightly upward—suggesting gradual price increases.
During this period, the price rose gradually at the rate determined by the channel until Mar 20 when price initially broke down below support. These breakdowns, however, can be considered insignificant since price rebounded into the channel immediately after.
A more significant breakdown occurred the following day. Since then, Ethereum’s price has dropped significantly below the support where it continues trading at the time of writing.
Based on this movement, the price is likely to create new areas of support and resistance.
The support and resistance lines combine to create an ascending channel, which is considered a neutral pattern—suggesting the equal likelihood of both price increases and decreases within the channel. However, the channel also was facing slightly upward—suggesting gradual price increases.
During this period, the price rose gradually at the rate determined by the channel until Mar 20 when price initially broke down below support. These breakdowns, however, can be considered insignificant since price rebounded into the channel immediately after.
A more significant breakdown occurred the following day. Since then, Ethereum’s price has dropped significantly below the support where it continues trading at the time of writing.
Based on this movement, the price is likely to create new areas of support and resistance.
Ascending Support
In order to predict where price will be heading next, we analyze the price of ETH on Bitfinex was analyzed at two-hour intervals from Mar 4 to Mar 22. On Mar 4, the price made a low of $125.88. A rapid upward move ensued. Several market cycles have been completed since, with each low being higher than the previous one. Tracing these lows gives us an ascending support line.
Symmetrical Triangle
On Mar 16, the price made a high of $147.5. A gradual downward move followed. Each high has been lower than the previous one. Tracing these highs gives us a descending resistance line.
Looking Out For Divergence
Combining MACD and RSI bullish/bearish divergence with support/resistance essentially predicts price fluctuations. The moving average convergence divergence (MACD) is a trend indicator that shows the relationship between two moving averages (long and short-term) and the price. It is used to measure the strength of a move. The relative strength index (RSI) is an indicator which calculates the size of the changes in price in order to determine oversold or overbought conditions in the market.
Reversal Areas
The price of ETH on Bitfinex was analyzed at two-hour intervals from Feb 25 to Mar 22 to determine possible future resistance and support areas in the case of a breakout or breakdown situation.
Summary of Analysis
Based on this analysis, the price of ETH may increase slightly and touch the resistance line of the triangle. If the price touches the resistance line, this prediction will be partially validated. If it breaks out afterward, it will be fully validated. This prediction would be invalidated by a breakdown below the support line of the triangle. Do you think ETH will experience significant growth? Let us know your thoughts in the comments below. Disclaimer: This article is not trading advice and should not be construed as such. Always consult a trained financial professional before investing in cryptocurrencies, as the market is particularly volatile.
Top crypto projects in the US | April 2024
Trusted
Disclaimer
In line with the Trust Project guidelines, this price analysis article is for informational purposes only and should not be considered financial or investment advice. BeInCrypto is committed to accurate, unbiased reporting, but market conditions are subject to change without notice. Always conduct your own research and consult with a professional before making any financial decisions. Please note that our Terms and Conditions, Privacy Policy, and Disclaimers have been updated.

Valdrin Tahiri
Valdrin discovered cryptocurrencies while he was getting his MSc in Financial Markets from the Barcelona School of Economics. Shortly after graduating, he began writing for several different cryptocurrency related websites as a freelancer before eventually taking on the role of BeInCrypto's Senior Analyst.
(I do not have a discord and will not contact you first there. Beware of scammers)
READ FULL BIO
Sponsored
Sponsored