
On Apr 23, 2019, the price of Ethereum (ETH) made a high above $178 & €158. A sharp decrease followed with lows close to $150 and €135 reached on Apr 26.
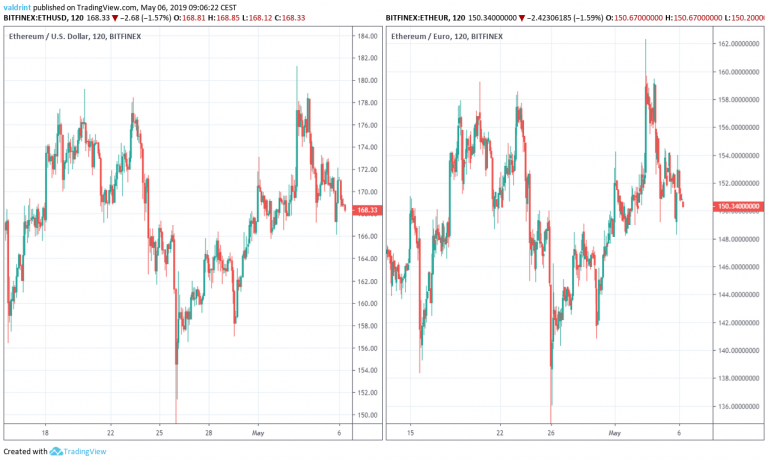
The price has been increasing since. reaching highs above $172 and €154 on May 1 before beginning a reversal.
How long will the price of Ethereum keep increasing?
Let’s find out:
Ethereum (ETH): Trends and Highlights for May 2, 2019
- The price of Ethereum has been on an uptrend since Apr 26.
- It is trading inside an ascending triangle.
- The moving averages have made a bullish cross.
- There is resistance near $174 and €153.
Ascending Triangle
In this section, we define Ethereum’s current trading pattern by analyzing the price of ETH/USD on Bitfinex at two-hour intervals from Apr 20 to May 6. In order not to create confusion, we will not be using images of the ETH/EUR pair until the summary, where the relevant resistance and support areas will be shown in euros and dollars.
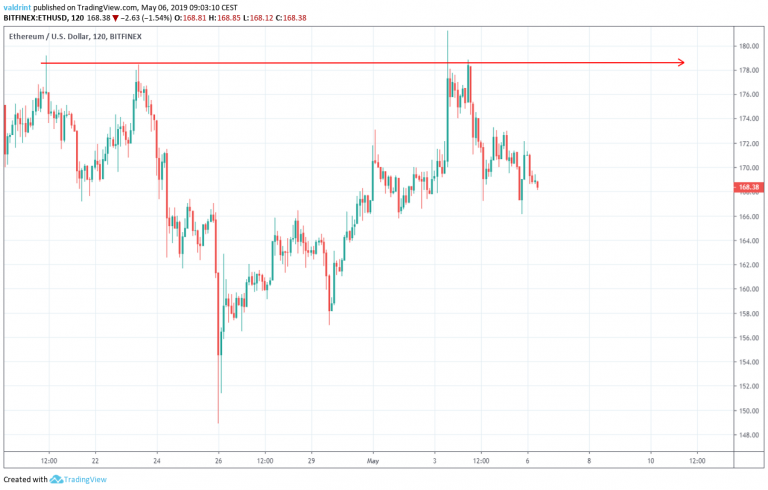
On Apr 20, Ethereum reached a high of $179.17. A sharp decrease ensued, followed by a gradual increase. The price has reached the same levels four times.
Tracing these highs gives us a horizontal resistance line.
On Apr 26, the price reached an hourly low of $148.88. Several market cycles have been completed and the price has created lower highs each time.Tracing these lows creates an ascending support line.
The support and resistance lines combine to create an ascending triangle:

It is likely that the price will trade inside the confines of the triangle until a decisive move occurs. To predict the direction of the move, we need to take a look at technical indicators.
Technical Indicators
The price of ETH is analyzed alongside moving averages. 100-(black) and 200-(blue) period MAs are shown in the graph below:
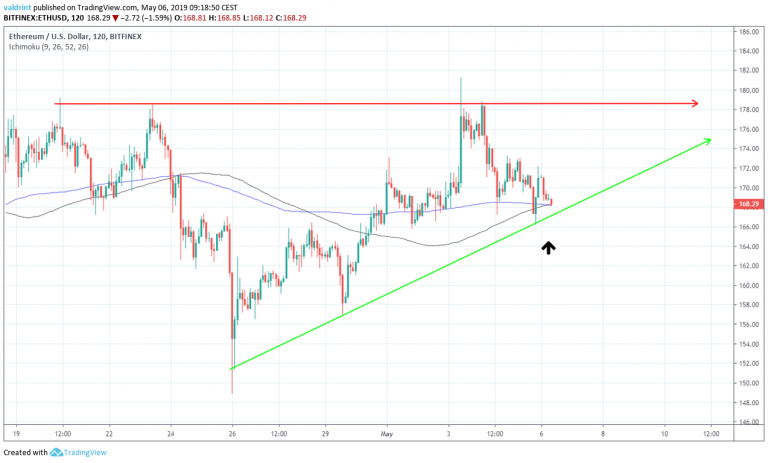
On May 6, the 100-period MA crossed above the 200-period one. This is known as a bullish cross and often indicates that an uptrend has begun.
The use of this indicator combined with the creation of a bullish pattern suggests that the price will increase towards the resistance line of the triangle.
Will it reach resistance before it gets there?
Resistance Areas
To determine possible price levels following an increase, we continue with an analysis of resistance areas which are traced for ETH/USD (first graph) and ETH/EUR (second graph) below:
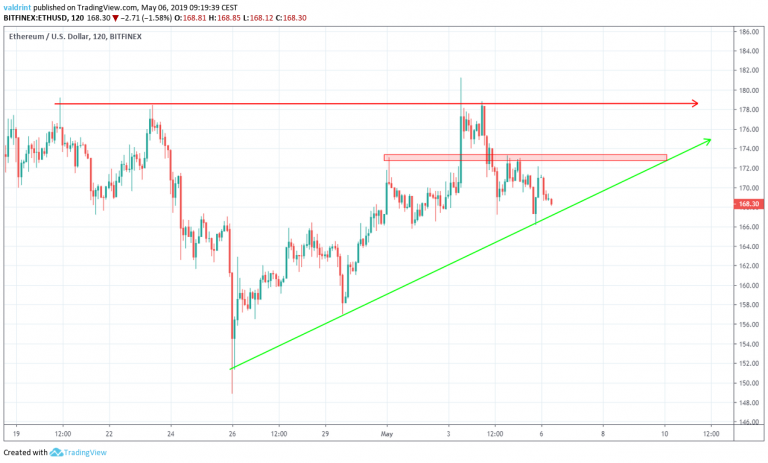
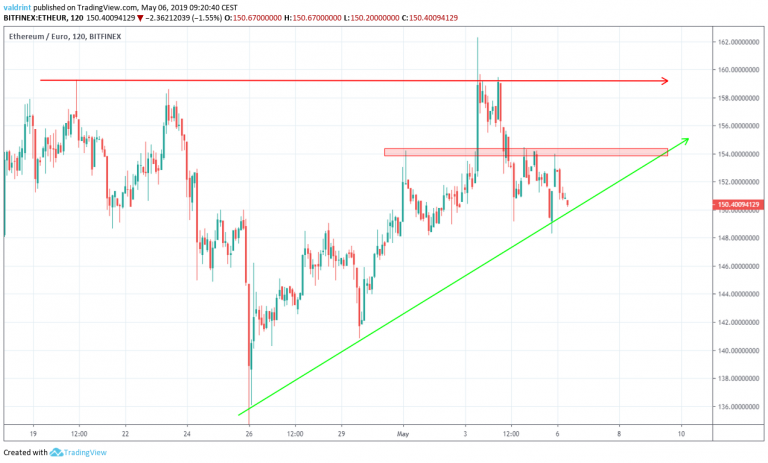
The closest resistance area is found near $173 and €154. If the price begins to increase towards the resistance line, it is likely to reach this area. If it does, we need to look for possible reversal signs.
Summary of Analysis
Based on this analysis, the price of ETH is likely to increase towards the resistance line of the triangle. We cannot say for certainty if it will reach it, but we believe it will initially reach the resistance area outlined above.
Do you think ETH will reach the resistance area? Let us know your thoughts in the comments below.
Disclaimer: this article is not trading advice and should not be construed as such. Always consult a trained financial professional before investing in cryptocurrencies, as the market is particularly volatile.
