


The ETC price has been decreasing since reaching a high of $13.19 on February 6. It has almost reached a very significant support level, a breakdown below which would confirm that the price is in a downward trend.
Ethereum Classic (ETC) Highlights
- There is resistance and support at $9.6 & $8.
- The price is following an ascending support line.
- A golden cross has transpired.
- ETC is trading inside a short-term descending wedge.
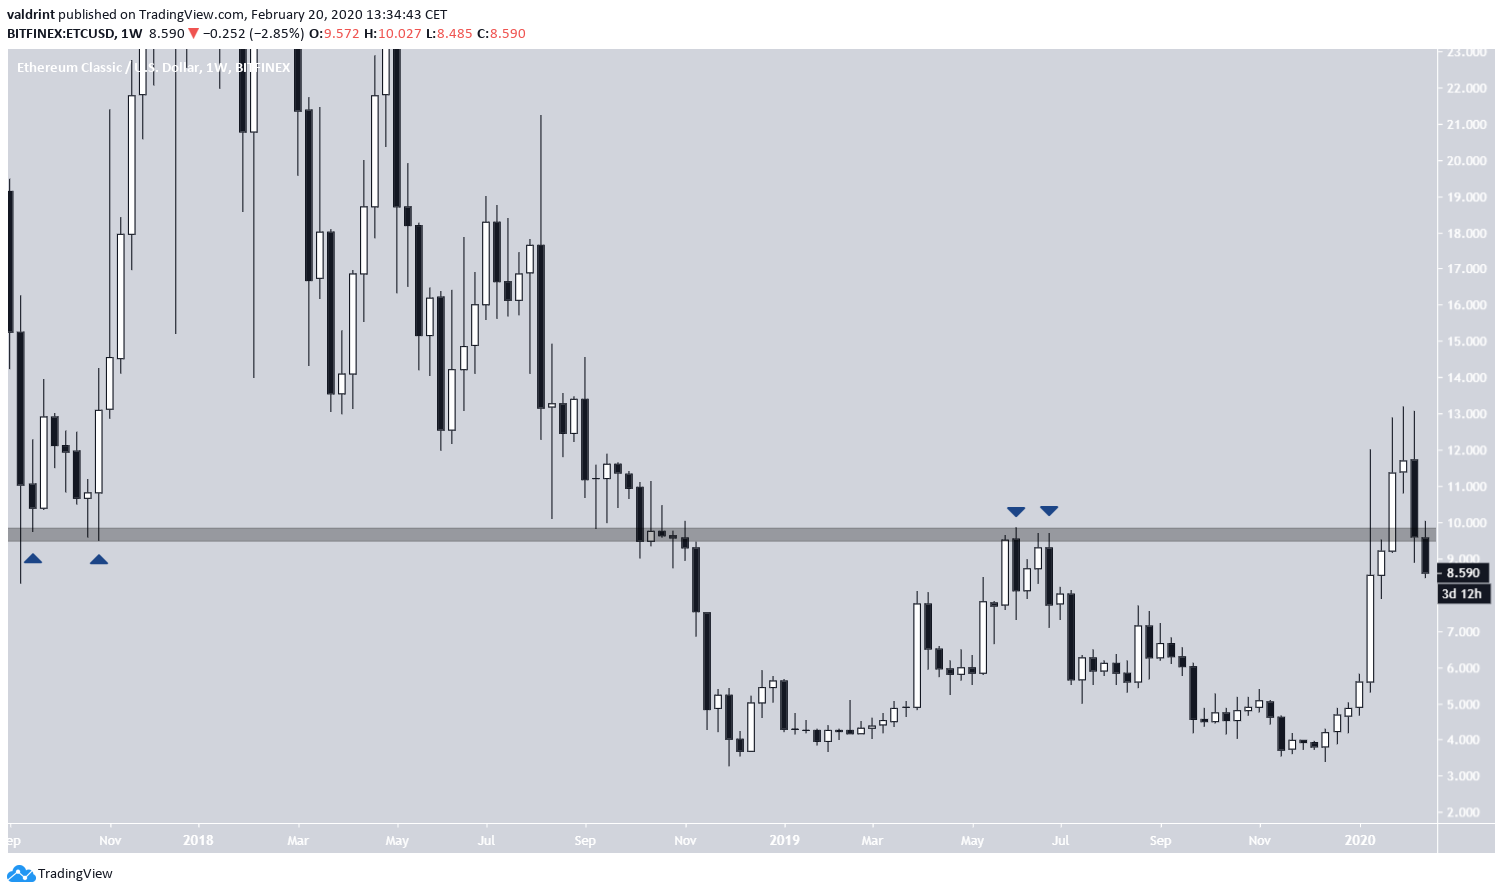
Well known cryptocurrency trader @ColdBloodShill tweeted an ETC price chart that shows that the current weekly candlestick has broken out above a significant resistance level and has returned to validate it as support. This movement is customarily followed by a continuation of the prior upward move.
That $ETC weekly though. pic.twitter.com/3dvV2Q18Bf
— Cold Blooded Shiller (@ColdBloodShill) February 16, 2020
Let’s take a closer look at the ETC price chart and determine if it will actually continue moving upwards.
ETC Resistance Level
The level outlined in the tweet is found at $9.6. Twice it did not allow the price to break down on September/October 2017. After the price eventually broke down in November 2018, the level acted as resistance in June 2019.
ETC was finally able to break out on January 24, 2020. However, the current weekly candlestick is causing the price to drop below this resistance area once more.
Therefore, there are two possibilities here for the future price movement.
First, since the weekly candlestick has some time left until closure, the price could reverse and close back above it, leaving just a long lower wick in the process. This is the bullish scenario.
Second, the price falls below this area once more, causing the breakout to be a fakeout instead and initiating another period of consolidation/downtrend. This is the bearish scenario.
Ascending Support
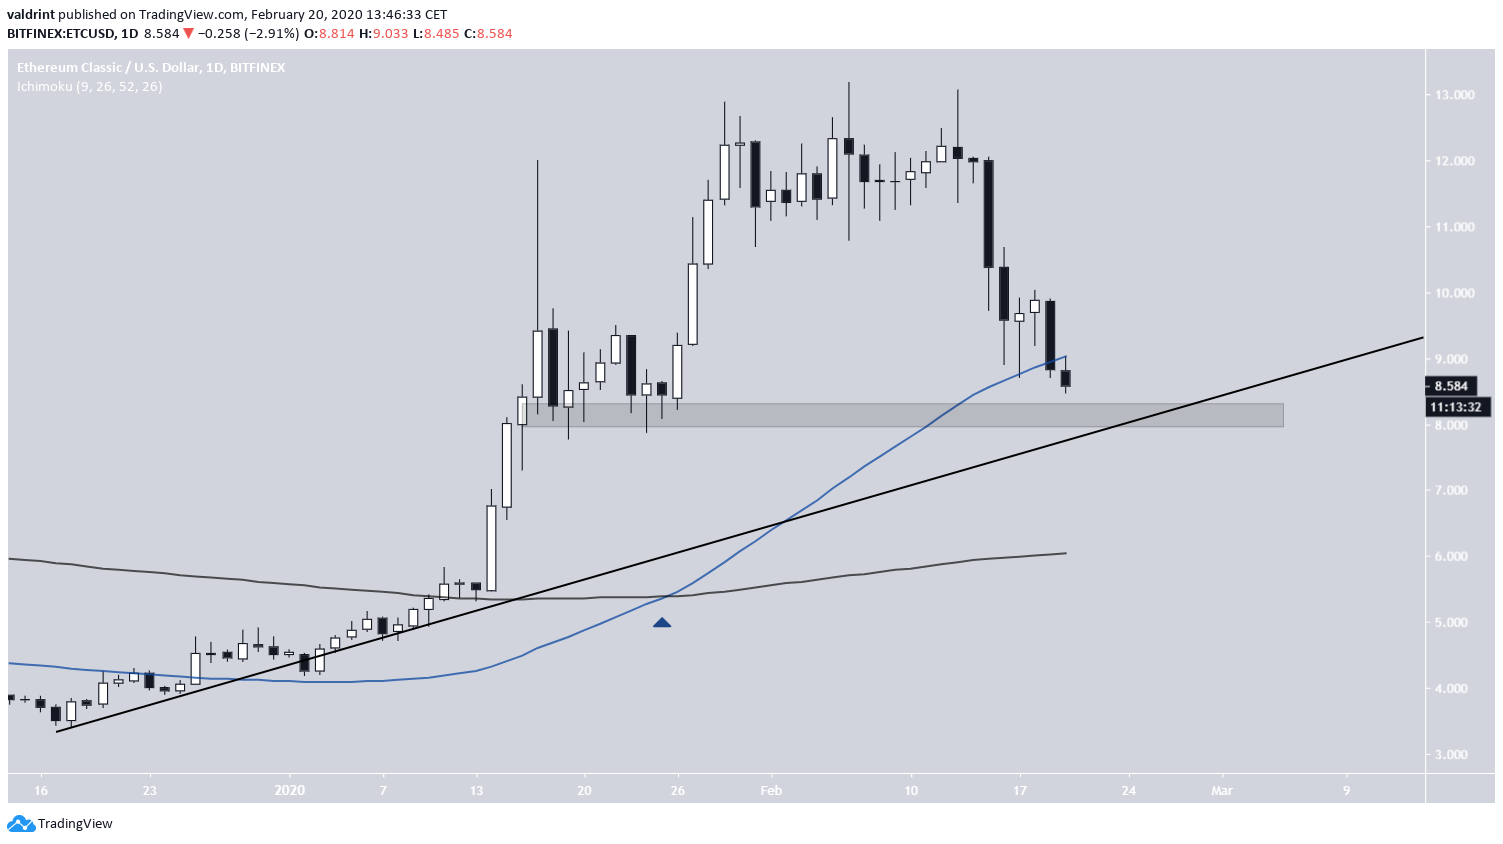
The daily chart makes the first option (bullish) more likely. ETC has been following an ascending support line, which coincides with the closest support area at $8. Therefore, this would be a likely place for a reversal.
In addition, the 50- and 200-day moving averages (MA) have made a bullish cross, otherwise known as a golden cross. While the price has fallen slightly below the 50-day MA, it can easily reclaim it as support and move upwards, since it is very close to it, especially if it bounces at the confluence of the support area/line.
In addition, a breakdown below this ascending support line would likely validate the second possibility and cause the price to fall back inside the range once more.
Short-Term Breakout
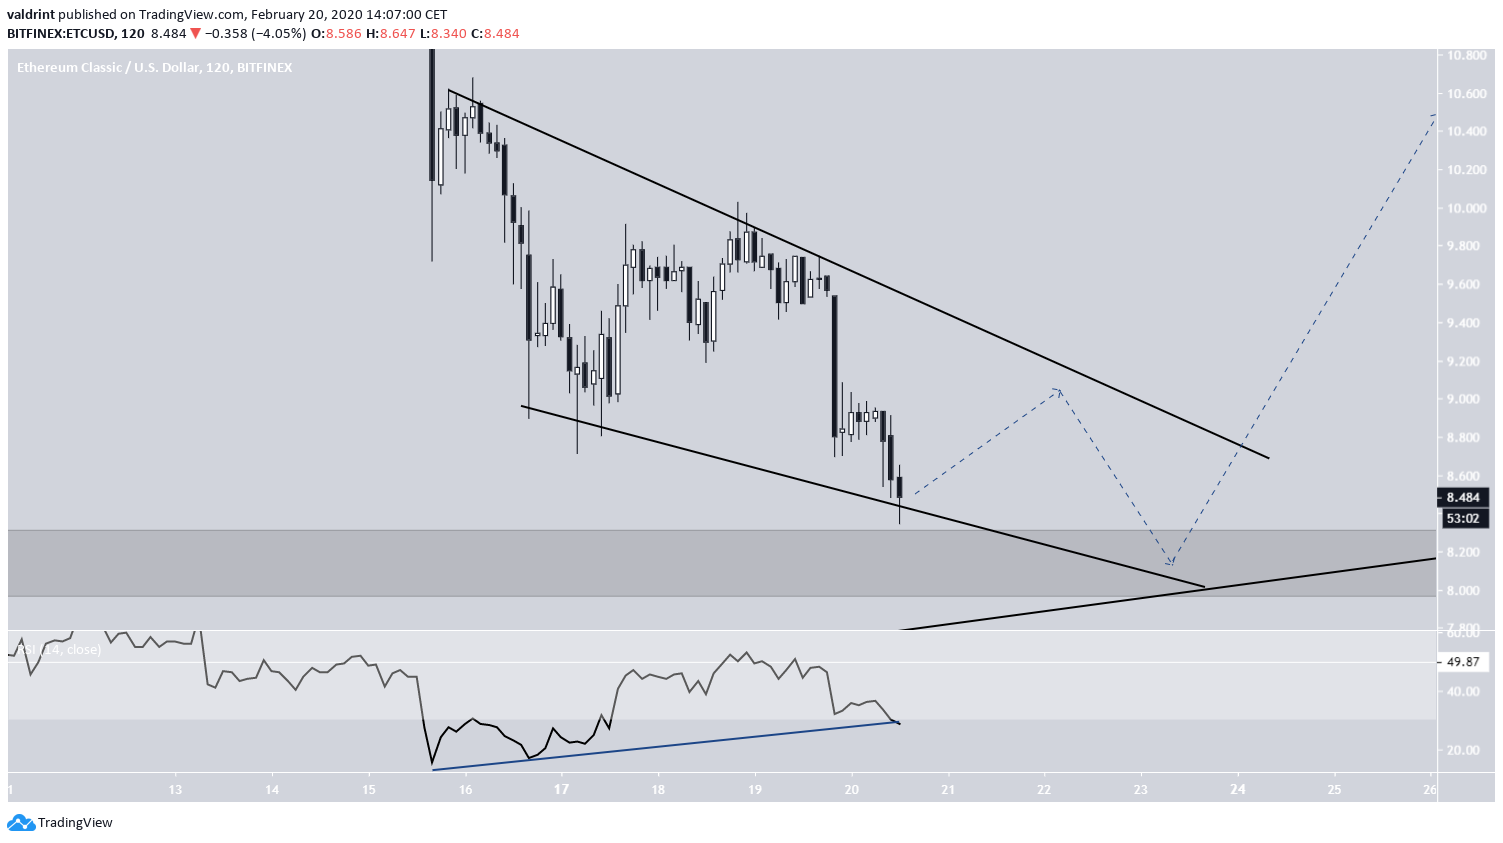
In the short-term, the ETC price is trading inside a descending wedge. In addition, there is a developing bullish divergence in the RSI.
Since the descending wedge is also considered a bullish pattern, the most likely scenario would be a price breakout, after possibly some more consolidation inside this wedge.
While the initial target is at $10.5, if the breakout is strong, the price could make another attempt at the recent highs near $13.
To conclude, the ETC price has reached an important support level which we believe will reverse the current correction. A breakout from the short-term descending wedge would confirm that the reversal has been initiated, at least in the short-term.


