
The EOS (EOS) price has broken out from a resistance line that had been in place since May 2019.
It was rejected shortly after and has now fallen back to the $3 support area. As long as EOS is trading above this level, the possibility of continuation to the upside is high.
EOS Double-Bottom Leads to Breakout
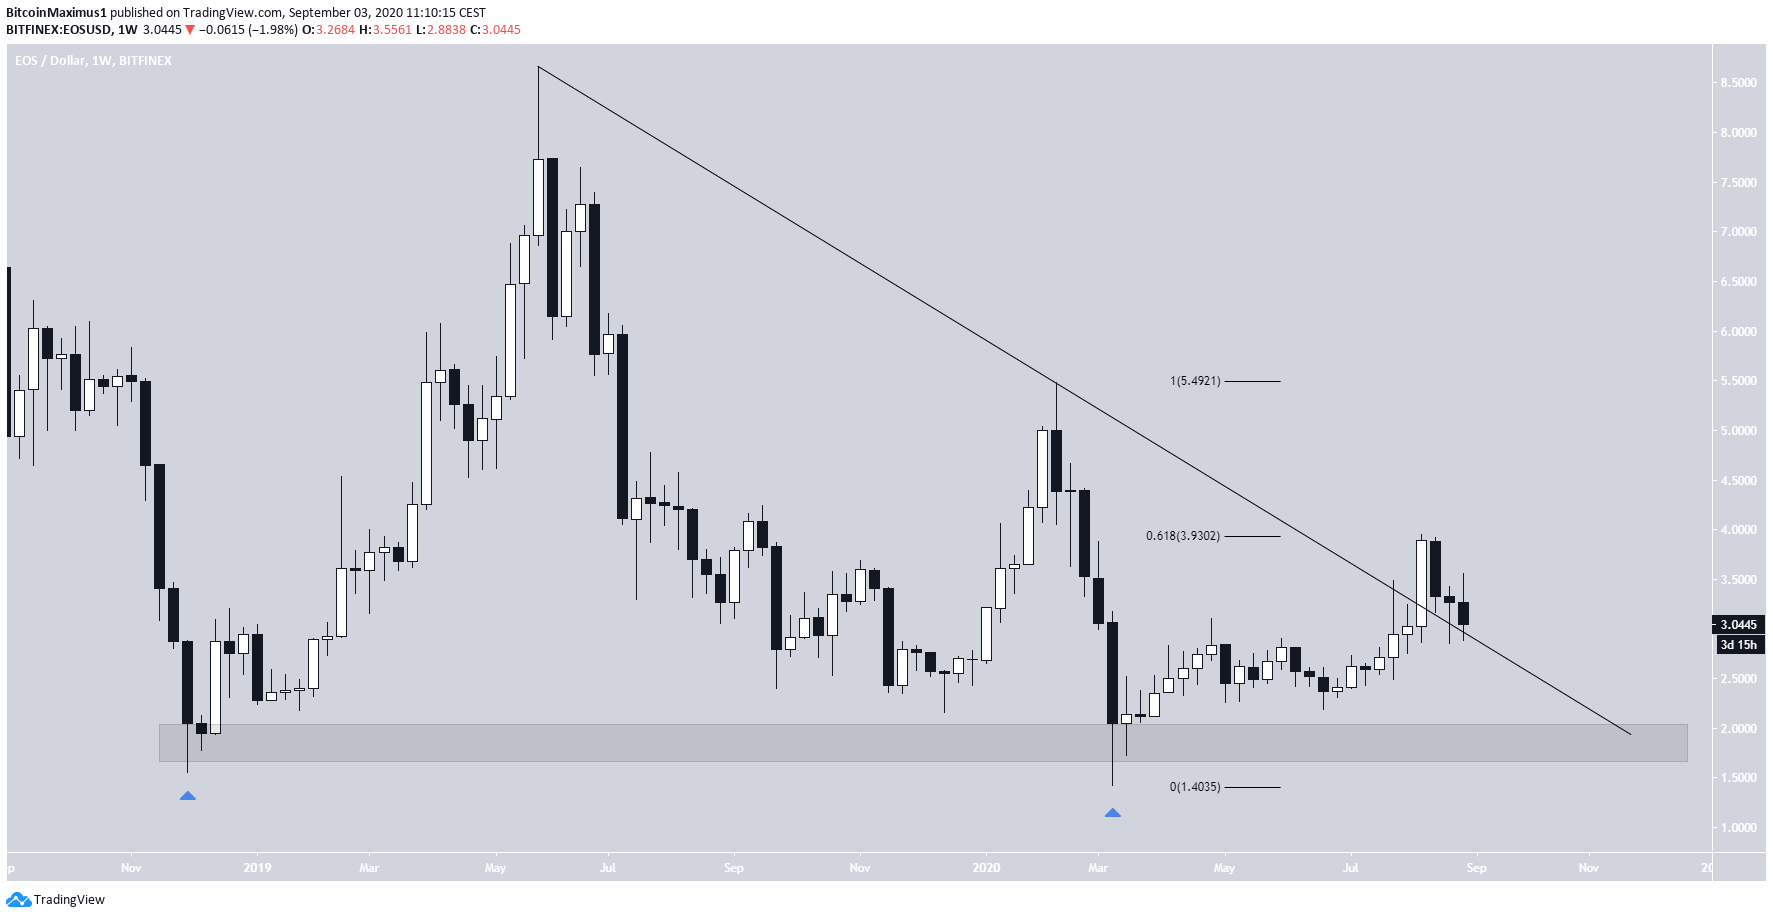
After creating a double-bottom at the $1.80 level, a support that has spanned more than a year, the EOS price began an upward move in March 2020 and broke out from a descending resistance line that had been in place since May 2019.
EOS was rejected at the 0.618 Fib level of the previous decrease and has moved downwards slightly since. However, the decrease has only served to validate the previous resistance line as support.
The closest resistance areas are found at $4 and $5.50, while the closest support is back down at $1.80.
Technical Indicators
Cryptocurrency trader @CryptoChimpanz stated that he is expecting the price to move upwards from the current level of $3.
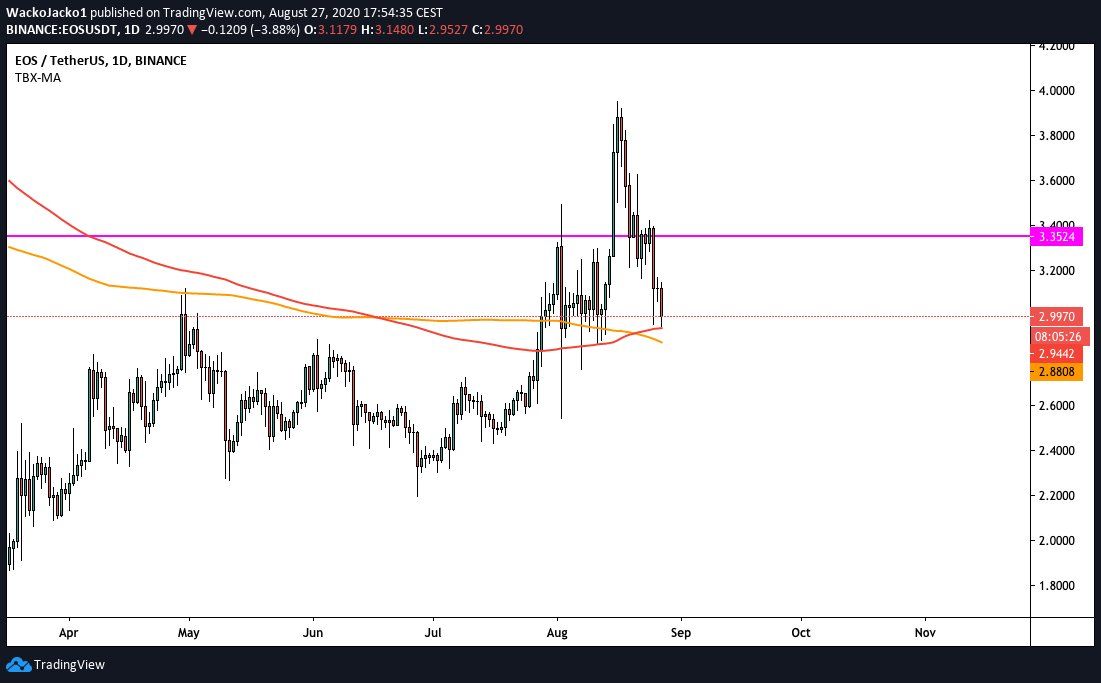
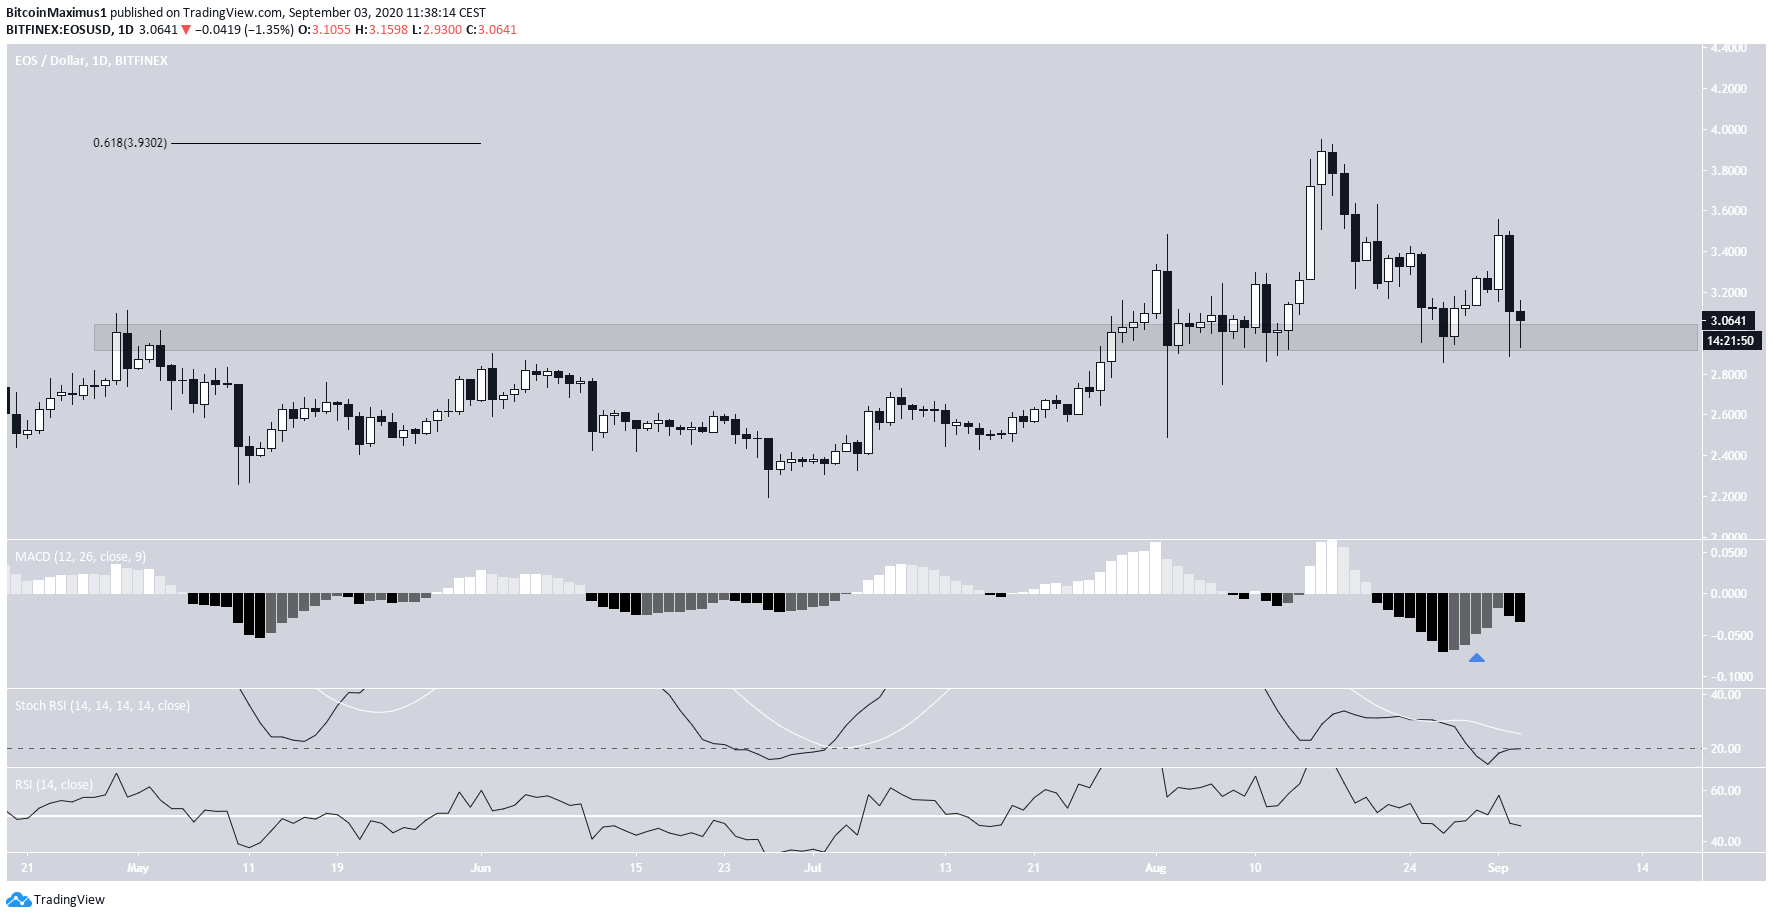
The $3 area is an important support level on the daily time-frame since it previously acted as resistance and has acted as support four times after.
However, technical indicators do not indicate that a reversal is near:
- The MACD was increasing, but failed to cross into positive territory and has fallen once again.
- The Stochastic RSI is oversold but rejected a bullish cross.
- The RSI is below 50 and has not generated any bullish divergence.
A bullish cross in the stochastic and normal and stochastic RSI above 50 would indicate that a reversal has begun. A breakdown below the $3 support area would likely trigger a sharp drop.
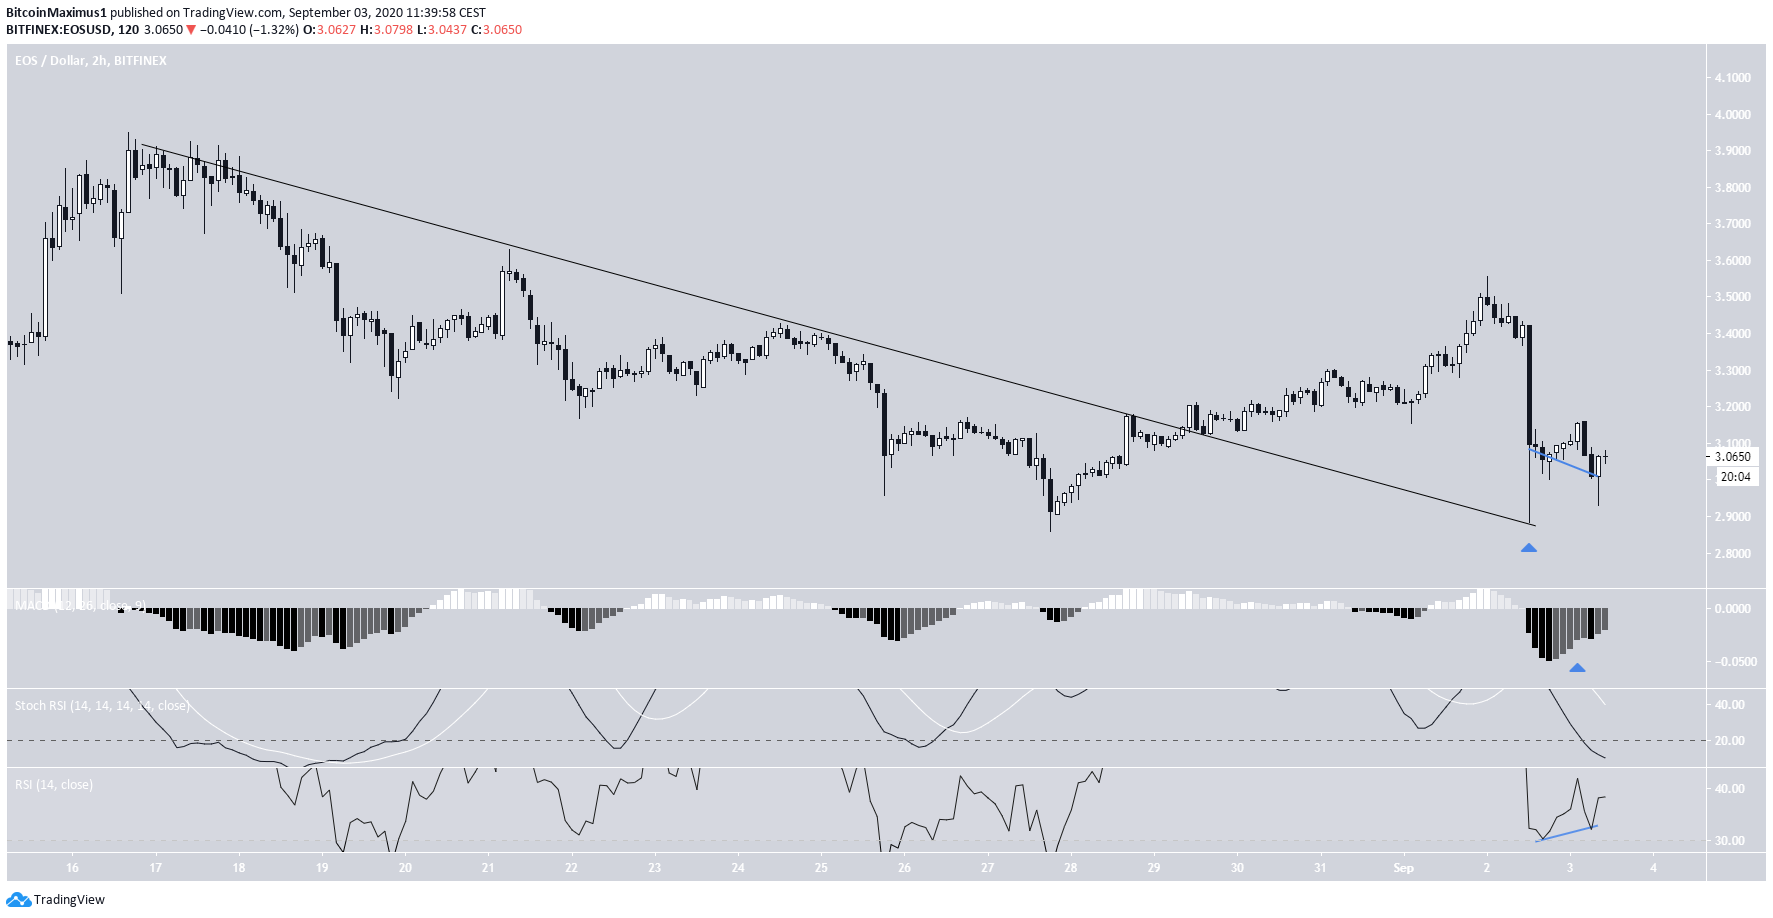
However, the short-term chart suggests that the price is likely to move upwards. EOS has broken out from a descending resistance line and validated it as support afterward.
There is a bullish divergence in both the RSI and MACD, which suggests that the price is likely to bounce.
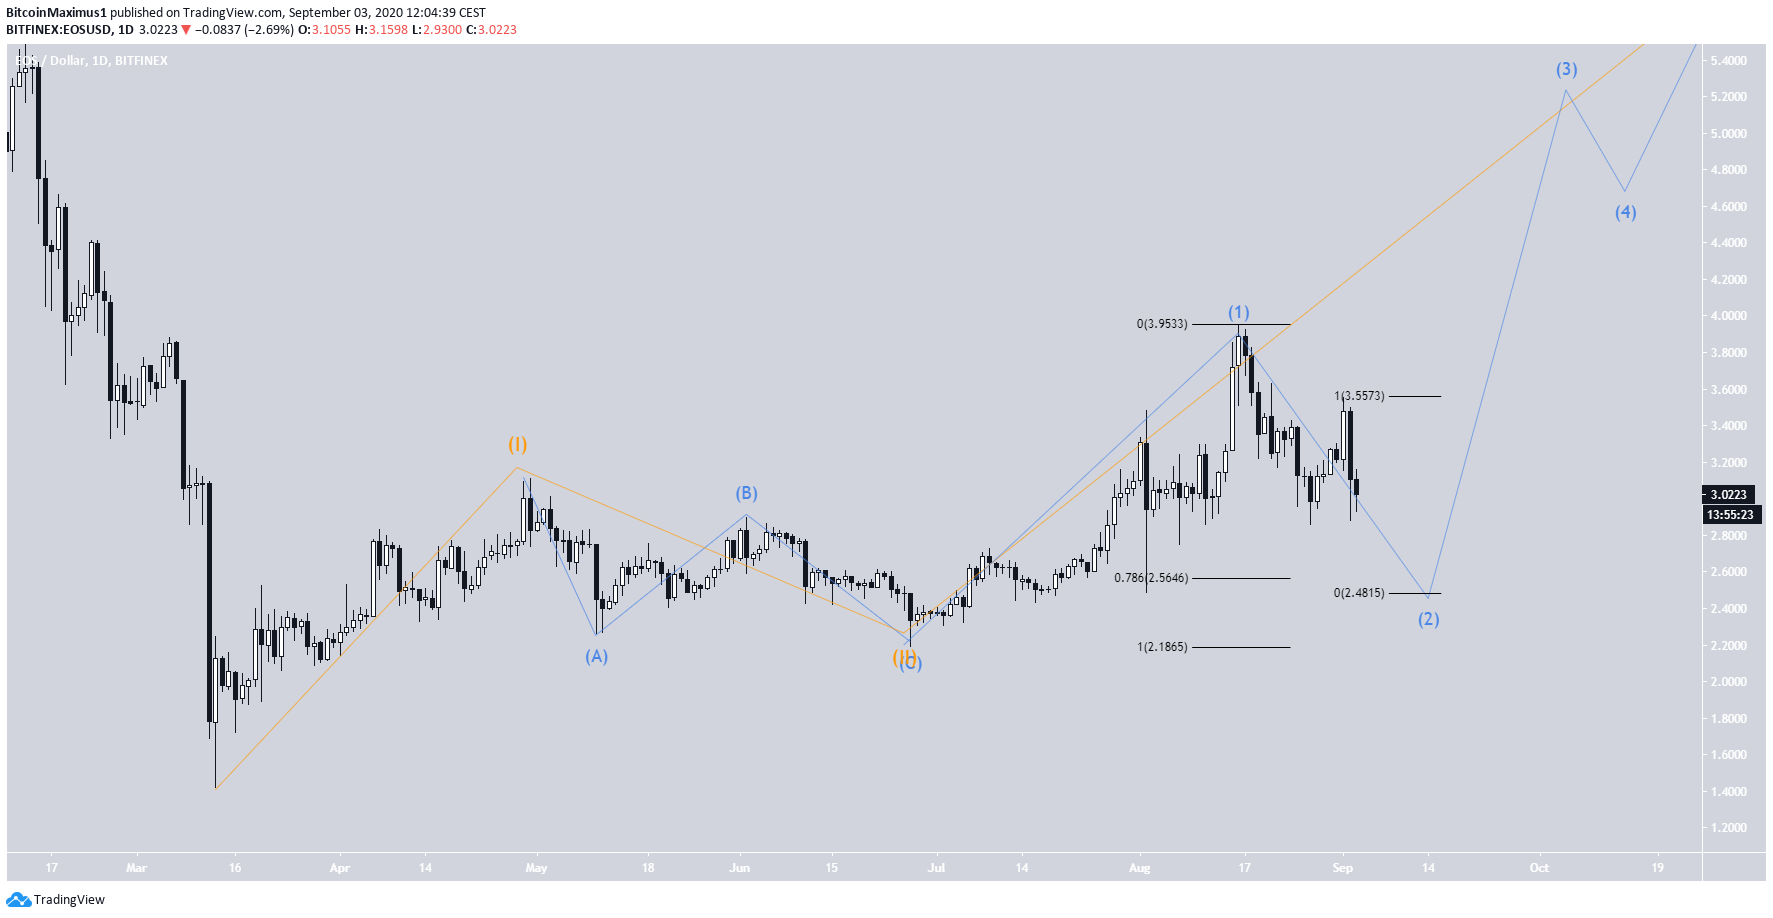
Wave Count
Beginning on March 13, the EOS price has likely begun a bullish impulsive five-wave formation (in orange below). It appears to be currently in the third wave.
Inside this formation, EOS has finished the first sub-wave (blue) and is now in the second, which is corrective.
The move is expected to end near $2.50. This would suggest that the price will break down from the previously mentioned support area.
A decrease below the sub-wave 1 bottom at $2.28 would invalidate this particular wave count.
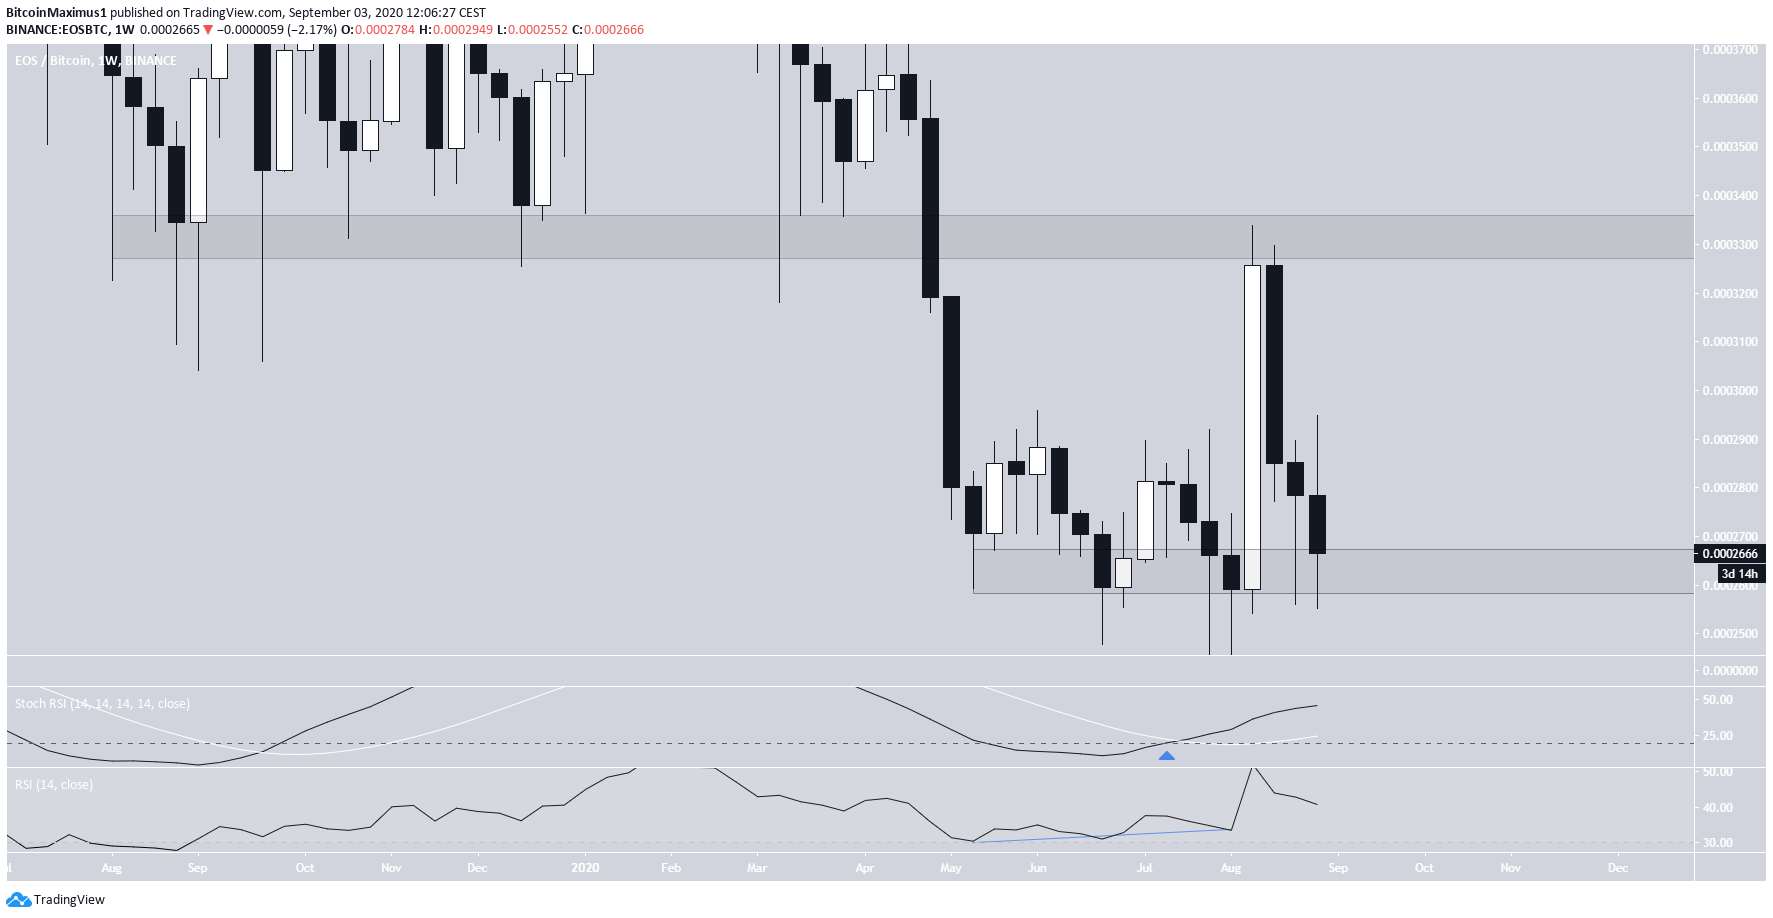
EOS/BTC
The EOS/BTC chart looks bullish.
The price has been trading near the support area of 26,300 satoshis. This level is the lowest that EOS/BTC has seen since December 2017. In addition, there is a considerable bullish divergence in the weekly RSI, and the stochastic RSI has made a bullish cross.
If the price moves upwards, the next resistance area is found at 33,000 satoshis.
To read BeInCrypto’s Bitcoin analysis for Sept 3, click here!
