


On January 14, the EOS price broke out above a significant resistance area. The price has been decreasing since and has validated the previous resistance area as support.
In the short-term, the price has created a bullish reversal pattern that coincides with the aforementioned support area. This makes us believe that the price will breakout once more and continue its upward movement.
Technical analyst @damskotrades recently made a tweet stating that the “EOS price is going to pump and there’s nothing you can do about it.”
$EOS || $BTC is going to pump and there's nothing you can do about it. pic.twitter.com/uPbTXgxuQE
— CryptoAmsterdam (@damskotrades) January 18, 2020
Will the EOS price actually pump? If so, what is the target for the ensuing move? Let’s take a closer look at the price movement and find out.
Previous EOS Breakout
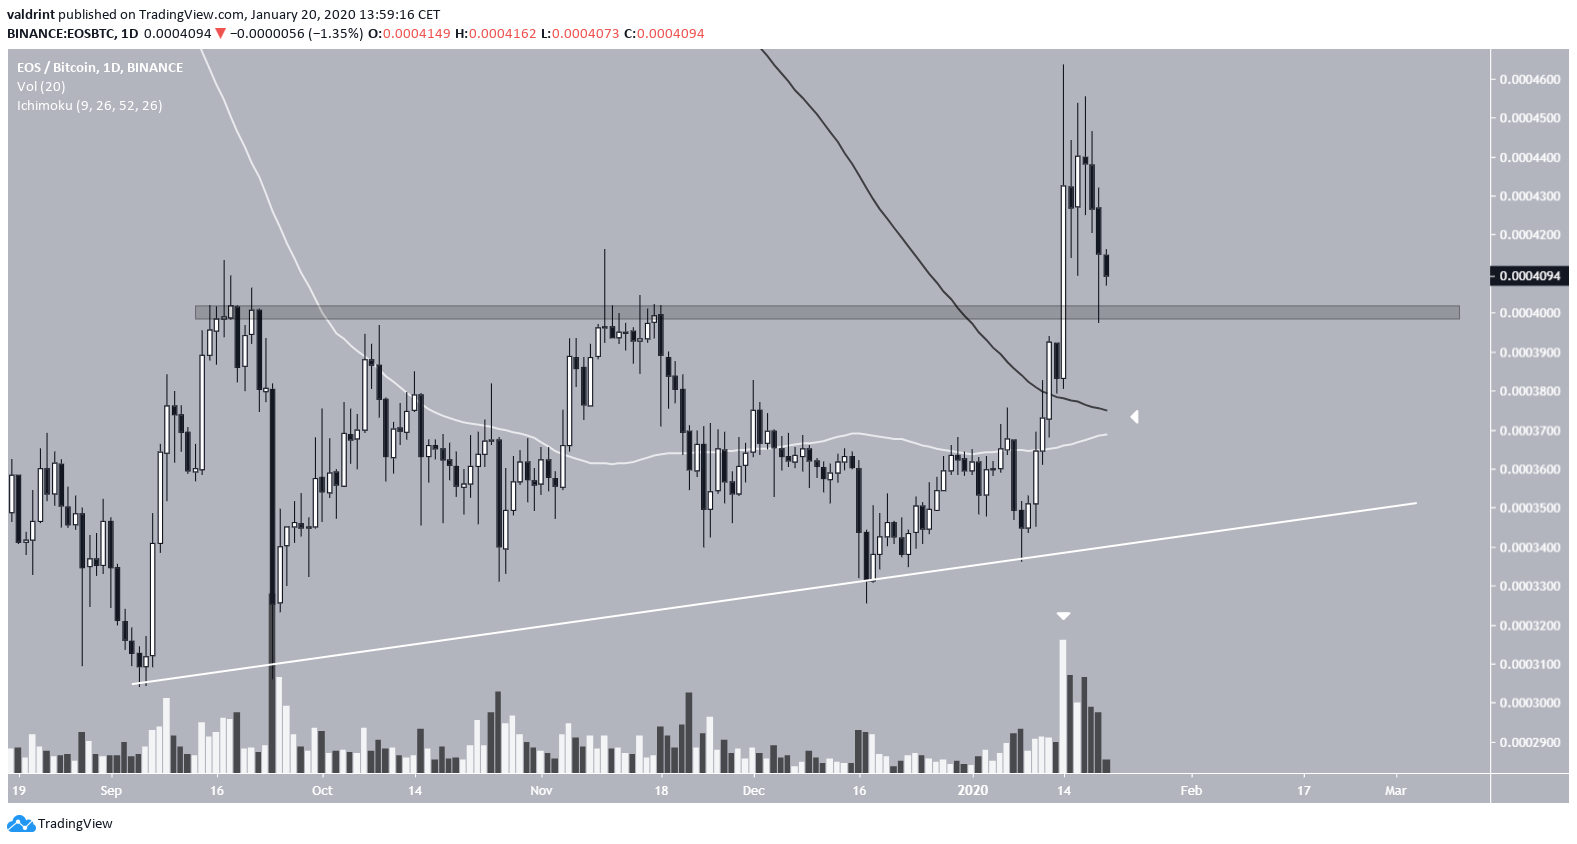
The EOS price had been trading inside an ascending triangle since September 2019. The resistance line of this triangle was found near 4000 satoshis.
On January 14, the price initiated a breakout with a very significant volume. The price reached a high of 4411 satoshis before decreasing and validating the breakout level in the form of a long lower wick.
In addition, the price is trading well above the 100- and 200-day moving averages (MAs), which are very close to making a bullish cross. All these signs suggest that the price has likely begun an upward move by breaking out above this significant resistance area. A bullish cross of the aforementioned MAs would confirm this possibility.
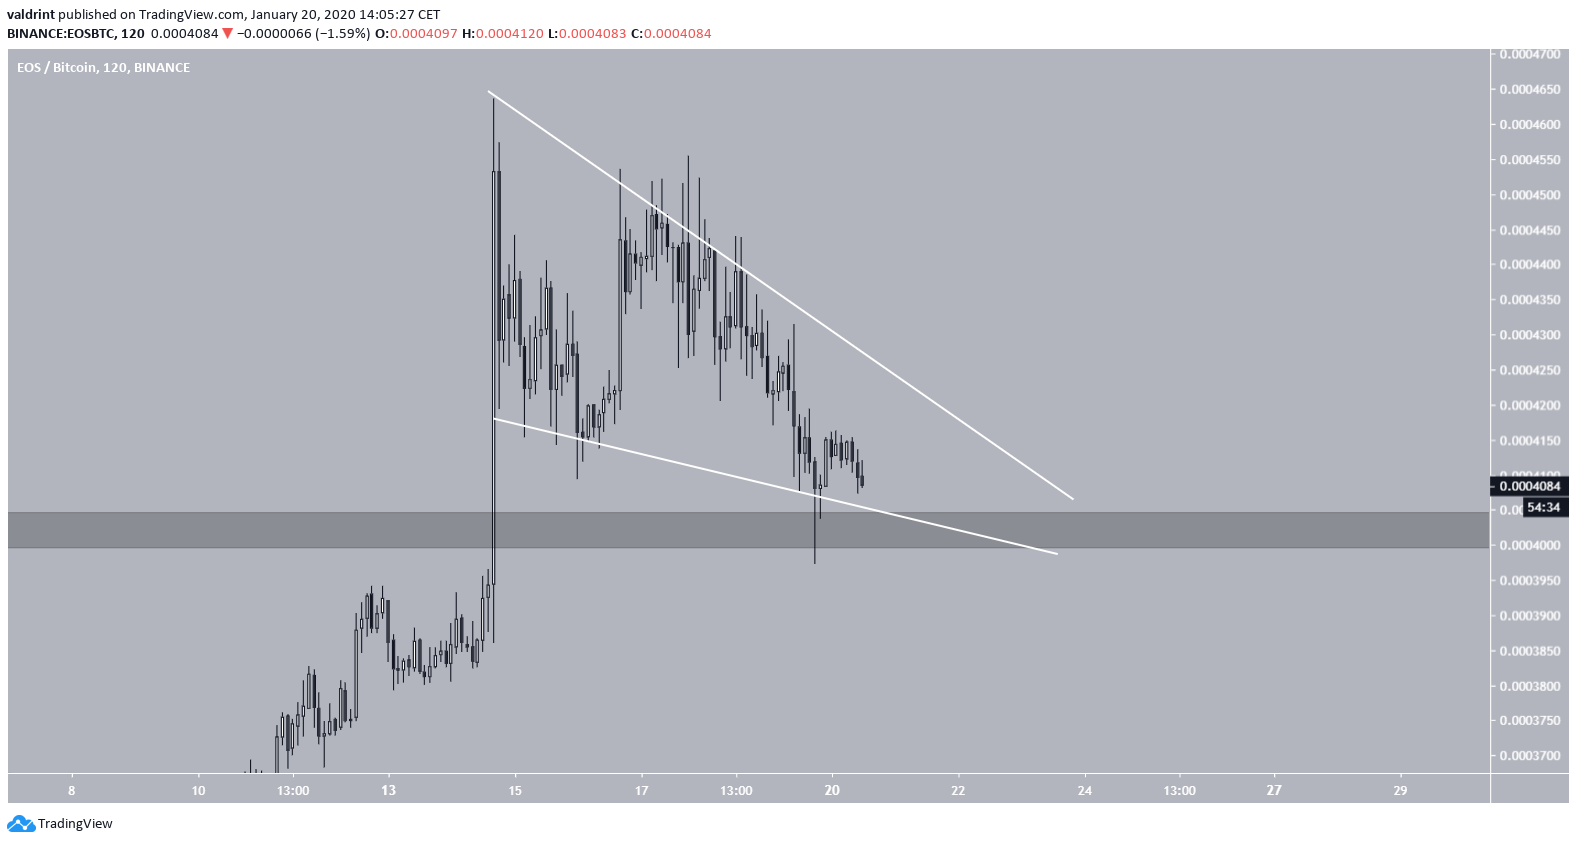
In the short-term, the EOS price is trading inside a descending wedge, which is considered a bullish pattern. In addition, the support line is falling well inside the previous breakout level, making it a very suitable place for the beginning of a reversal.
Future Movement
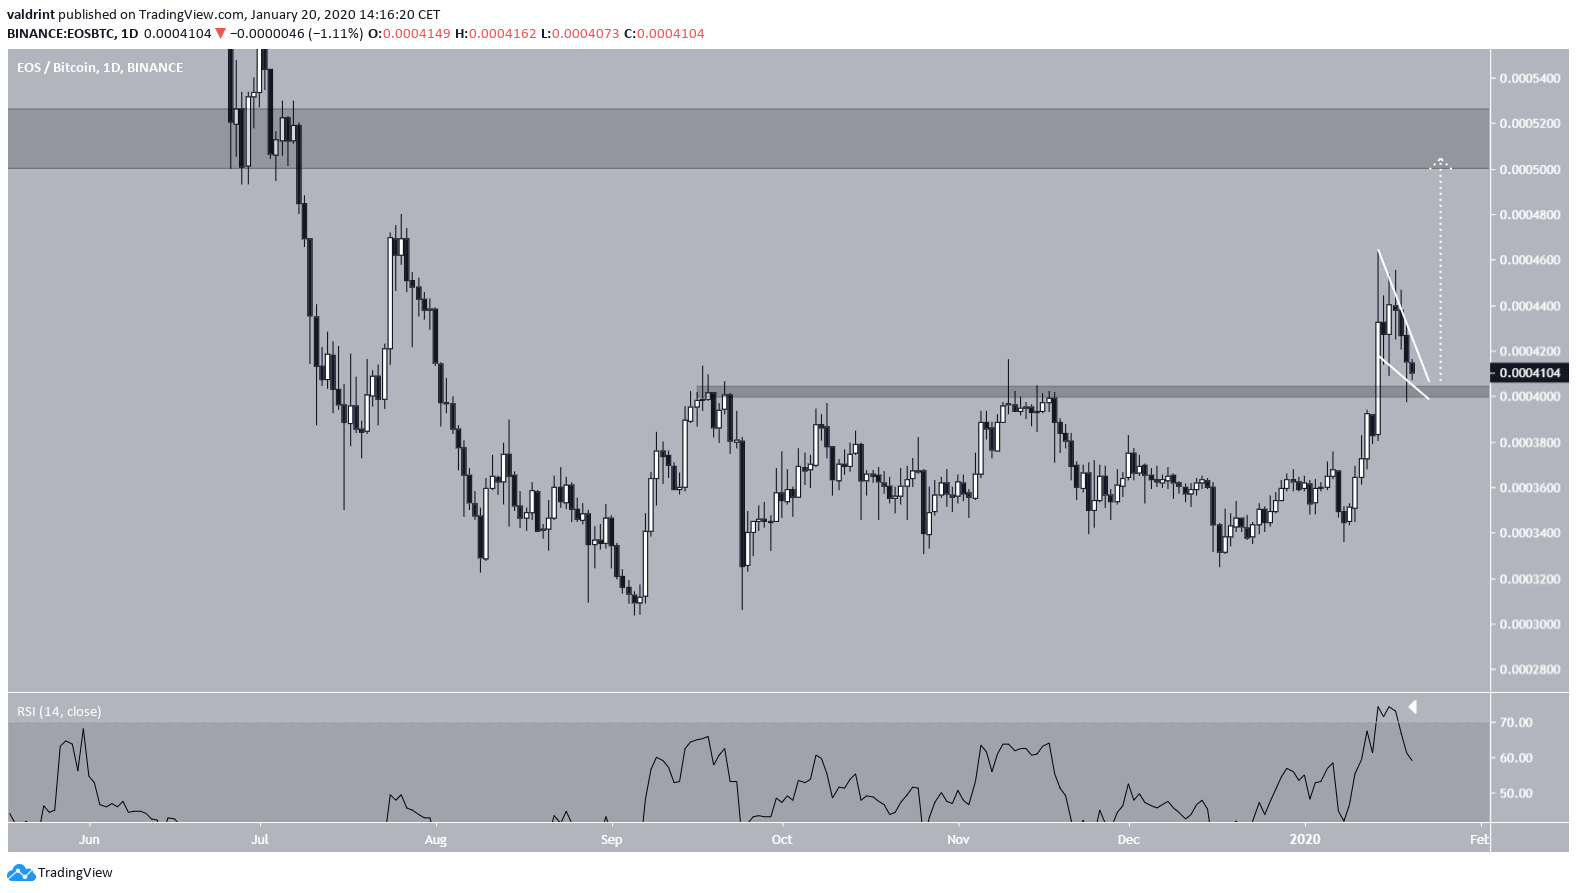
Measuring from the low of September 2019, a breakout the entire height of the pattern would take the price to 5000 satoshis, which was the previous breakdown level.
While the RSI is overbought, which it had not been for more than a year, it has yet to develop any bearish divergence. This suggests that the rally has not shown any weakness and allows for another impulsive wave upwards.
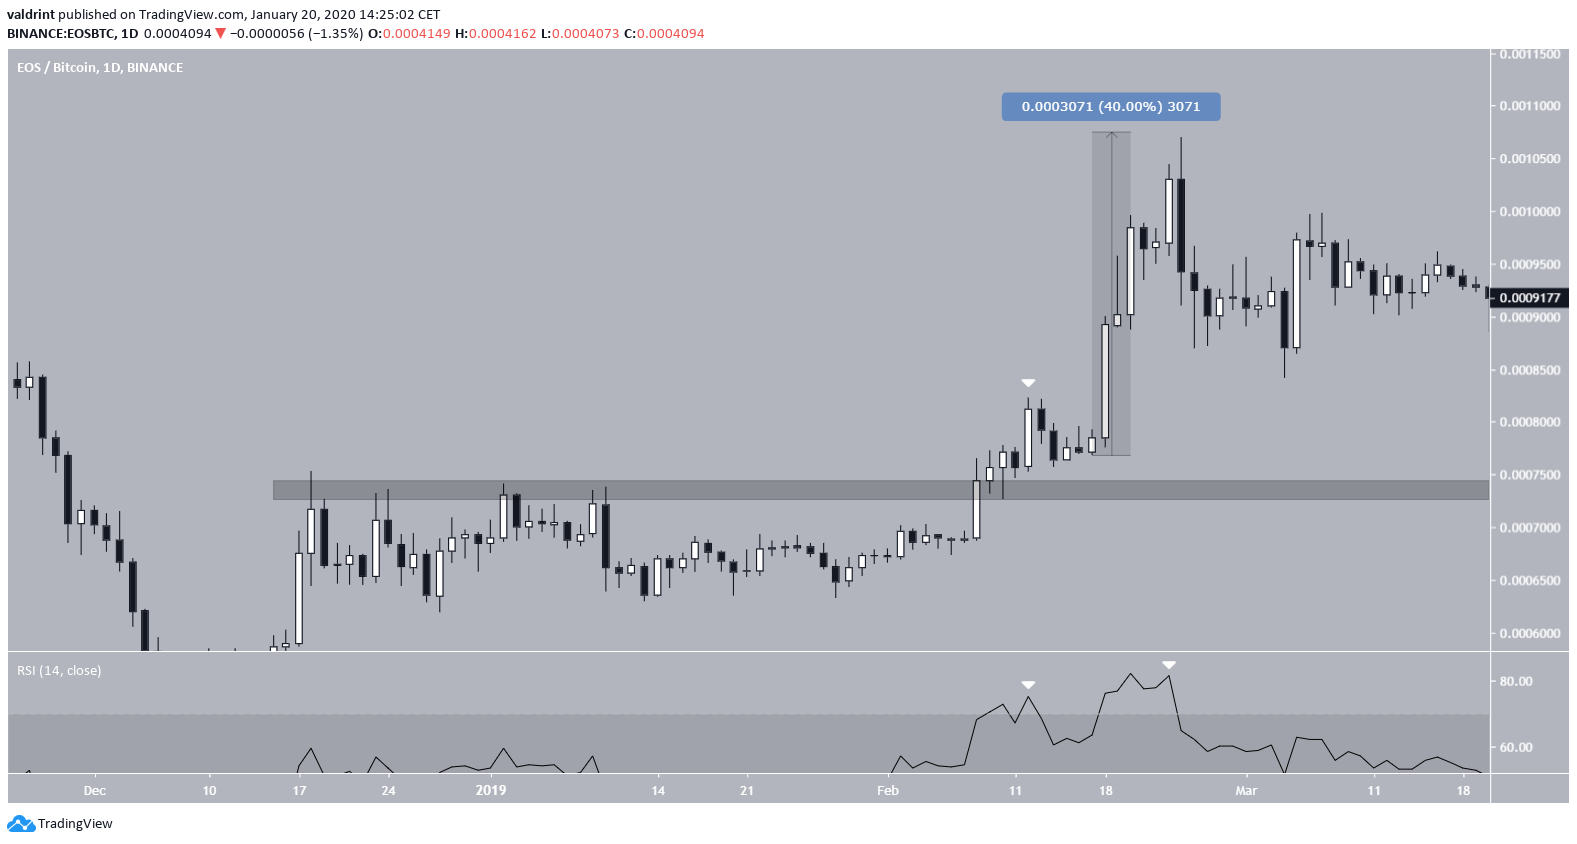
A similar movement transpired in February 2019. The price broke out above a significant resistance area before validating it as support. This movement was combined with an overbought RSI value, which had not transpired for a year prior, similar to the current RSI.
Afterward, the EOS price made another higher high with a magnitude of 40 percent, combined with a higher high in the RSI. We think the same thing can transpire this time around, causing the price to reach the 5000 satoshis level.
To conclude, the EOS price recently broke out above a long-term resistance area. It is currently in the process of validating the previous resistance area as support. We believe it will soon continue its upward movement and reach a high of 5000 satoshis.


