


EOS (EOS) is in the midst of a short-term decrease after a failed attempt at breaking out from a long-term descending resistance line.
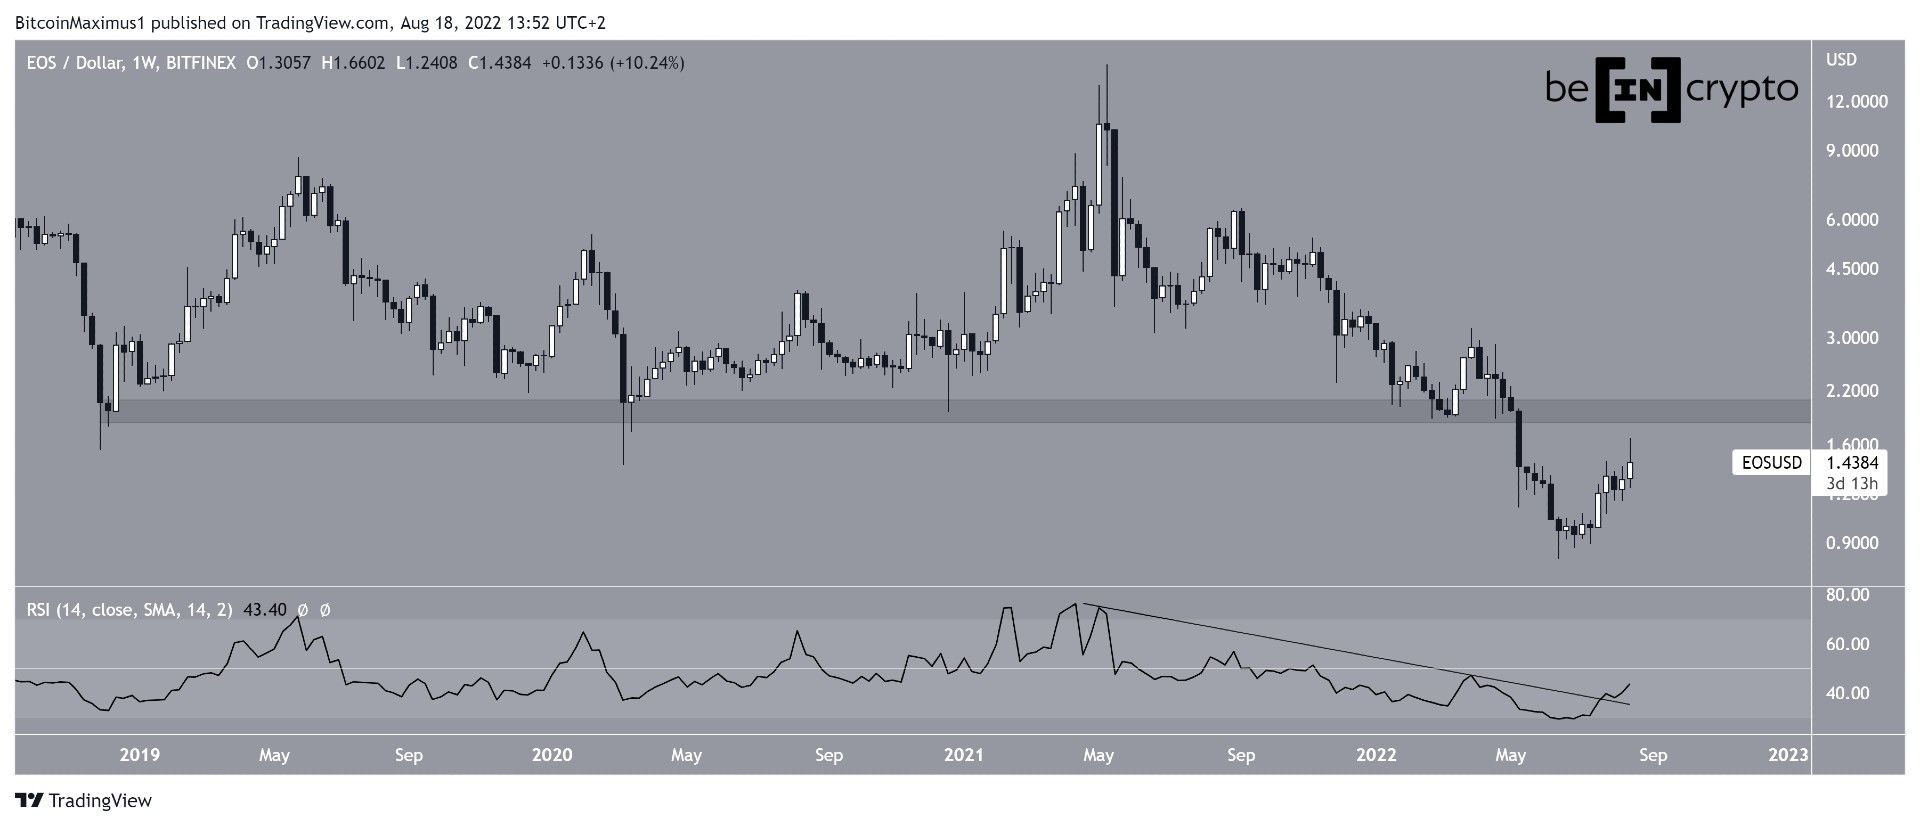
EOS has been falling since reaching a high of $14.86 in May 2021. The downward movement has so far led to a low of $0.81 in June 2022. The price has been moving upwards since, so far-reaching a high of $1.66.
However, the upward movement has not been completely sustained and the price is in the process of creating a long upper wick in the weekly timeframe.
The RSI is showing some bullish signs since it has broken out from its descending resistance line (black). But, it has yet to reclaim the 50 line.
Moreover, there is crucial resistance at $1.95. Until the area is reclaimed and the RSI moves above 50, the long-term trend cannot be considered bullish.
Current resistance
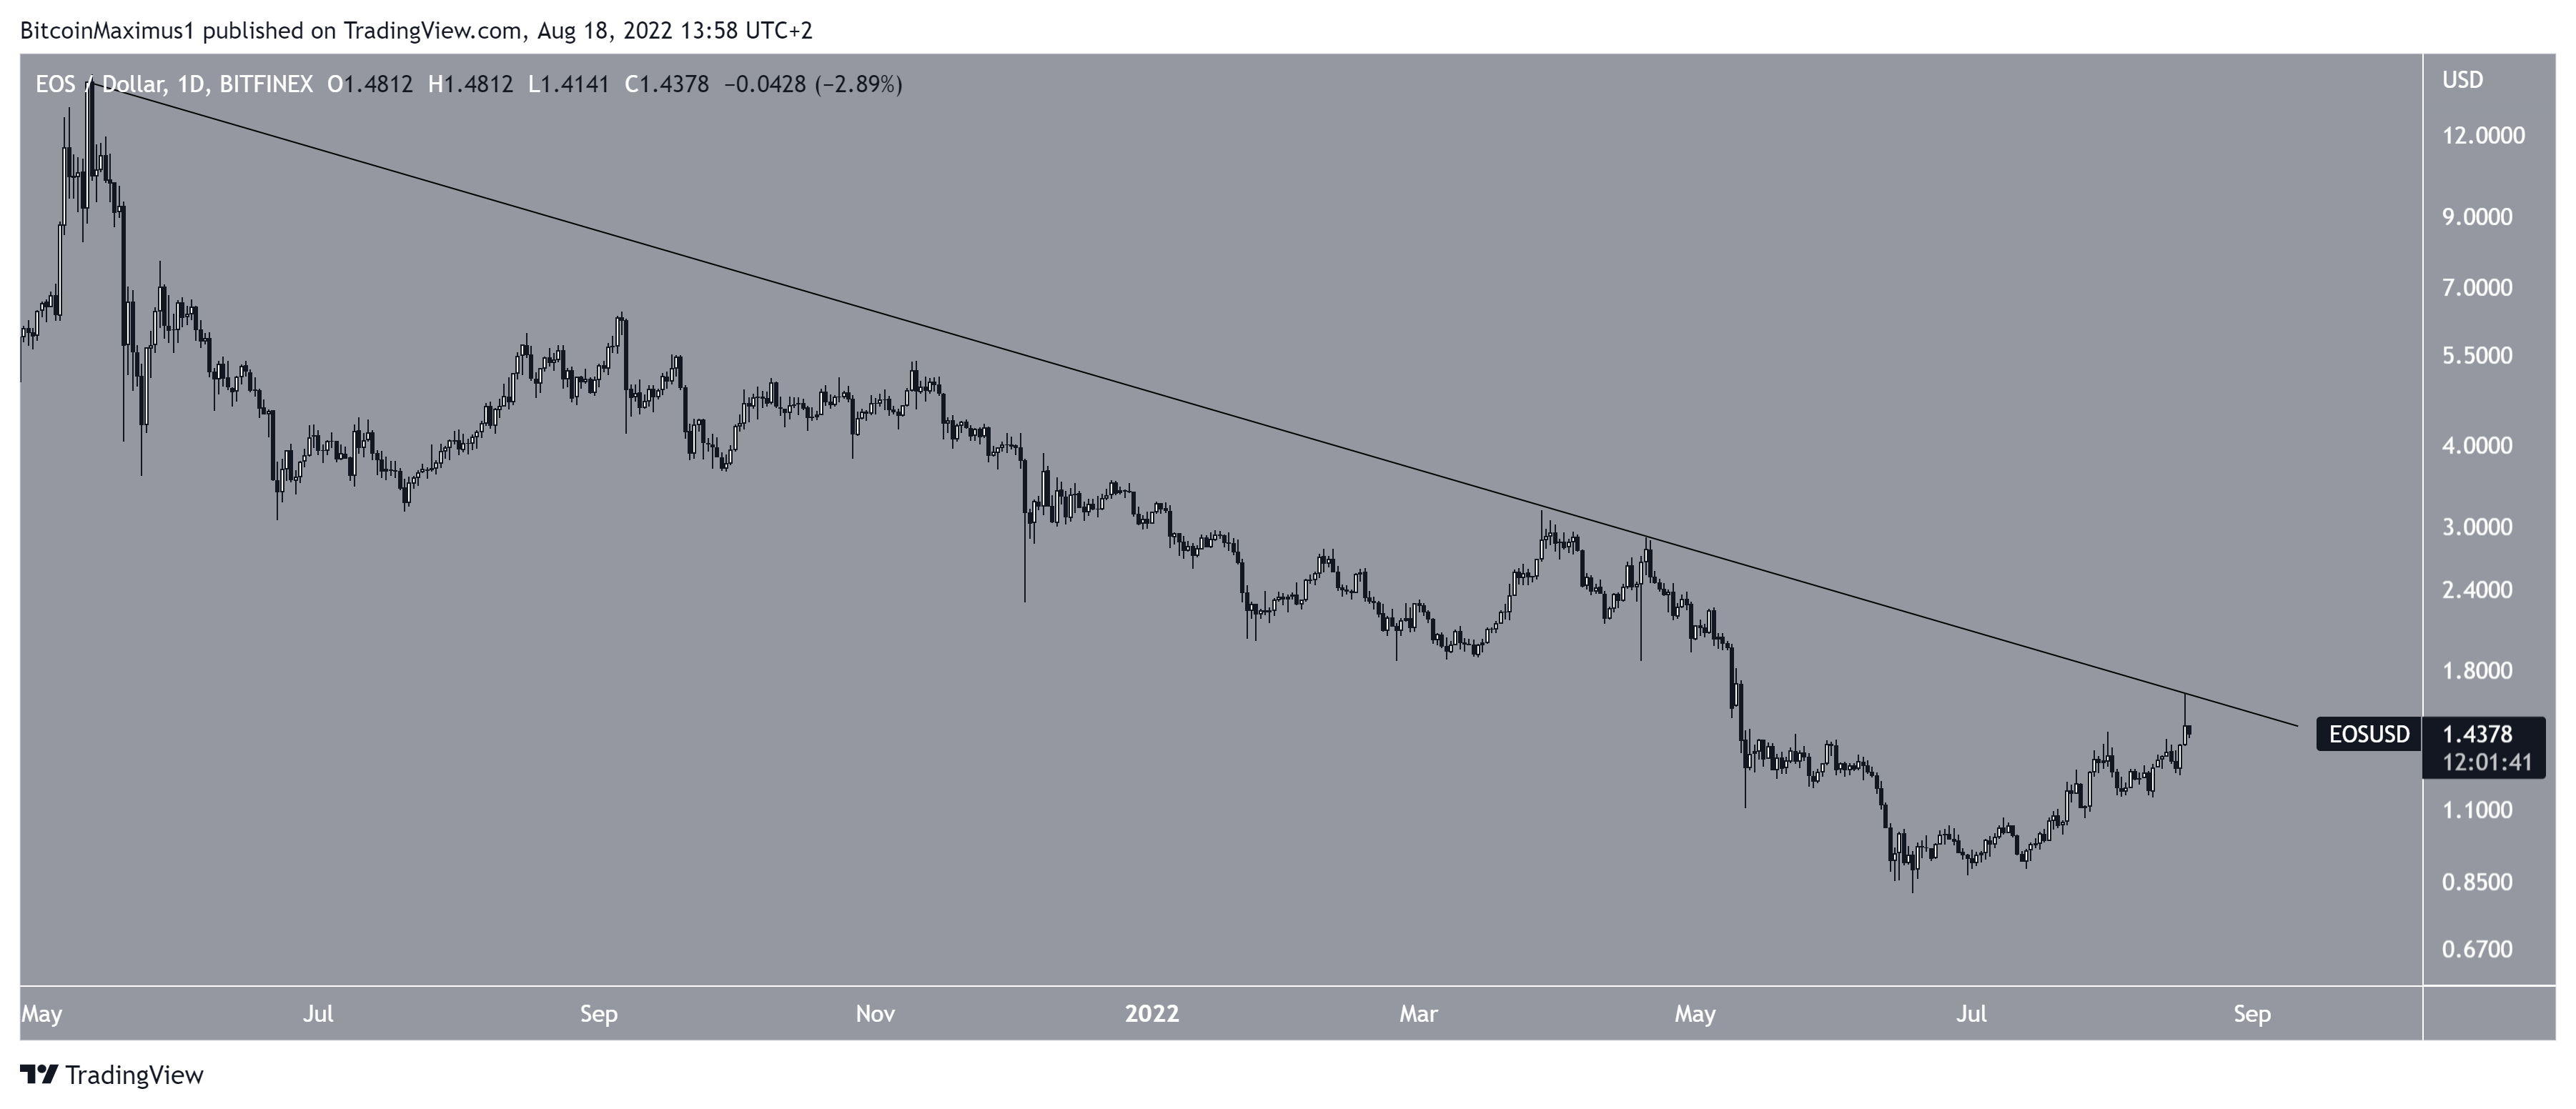
The daily chart shows that EOS has been decreasing underneath a descending resistance line since May 2021. So far, the price has made several attempts at breaking out, the most recent being on Aug. 18.
Since resistances get weaker each time they are touched, an eventual breakout would be expected.
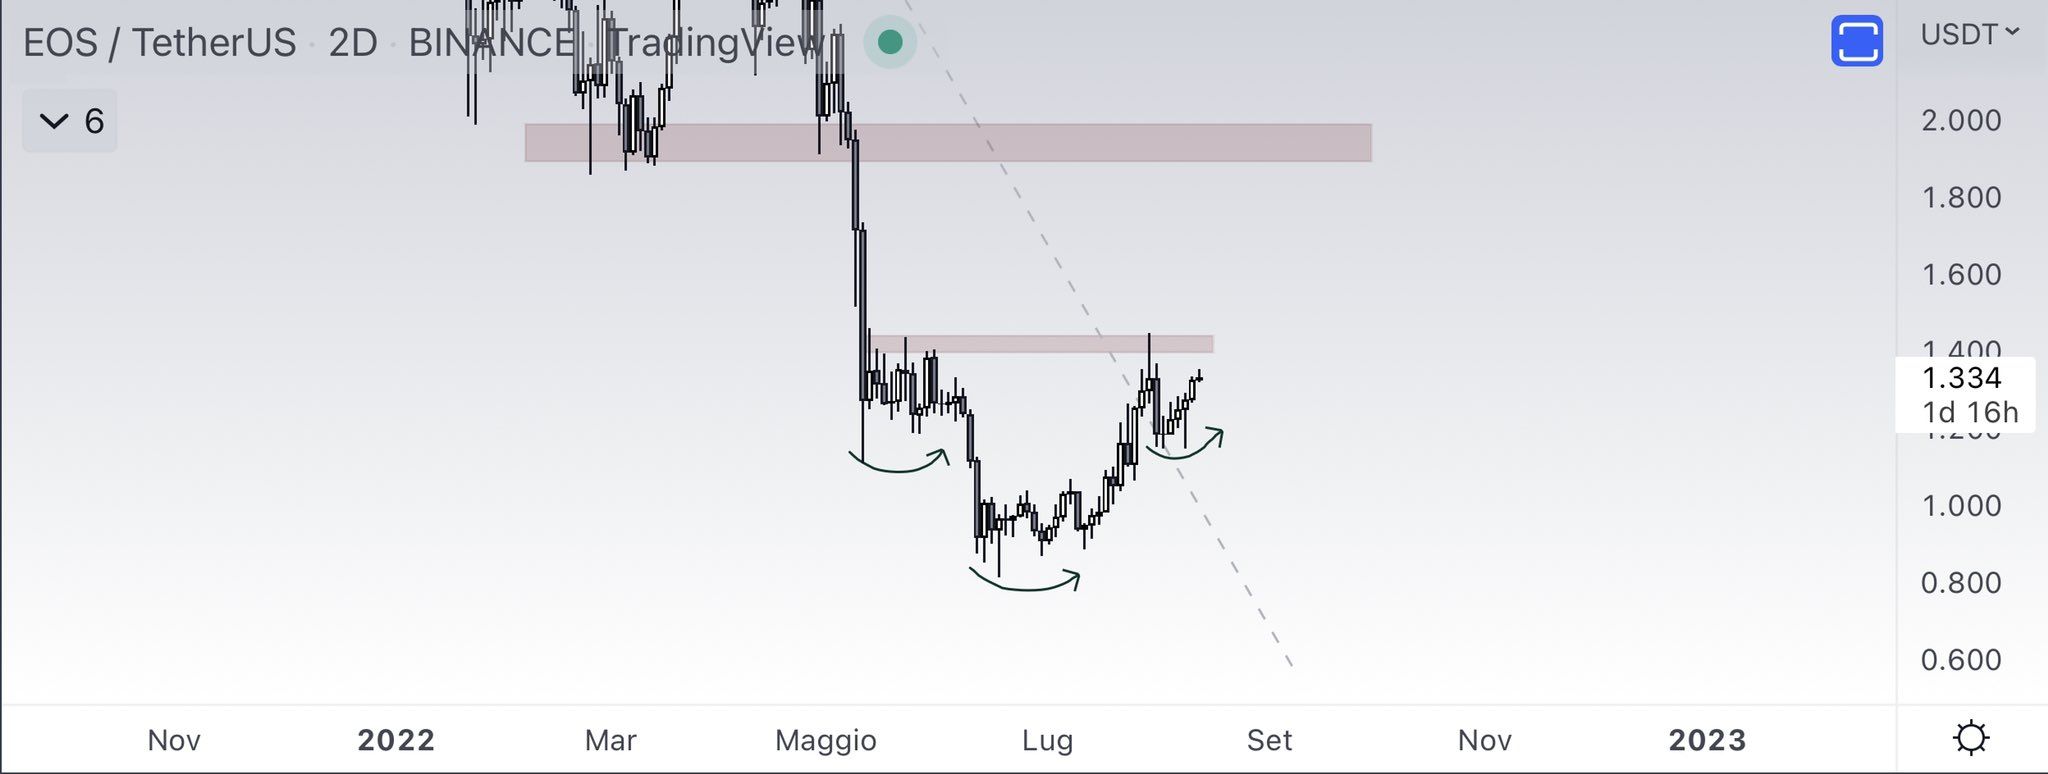
Cryptocurrency trader and investor @eliz883 tweeted a chart of EOS, stating that a bottom has been reached due to an inverse head and shoulders pattern.
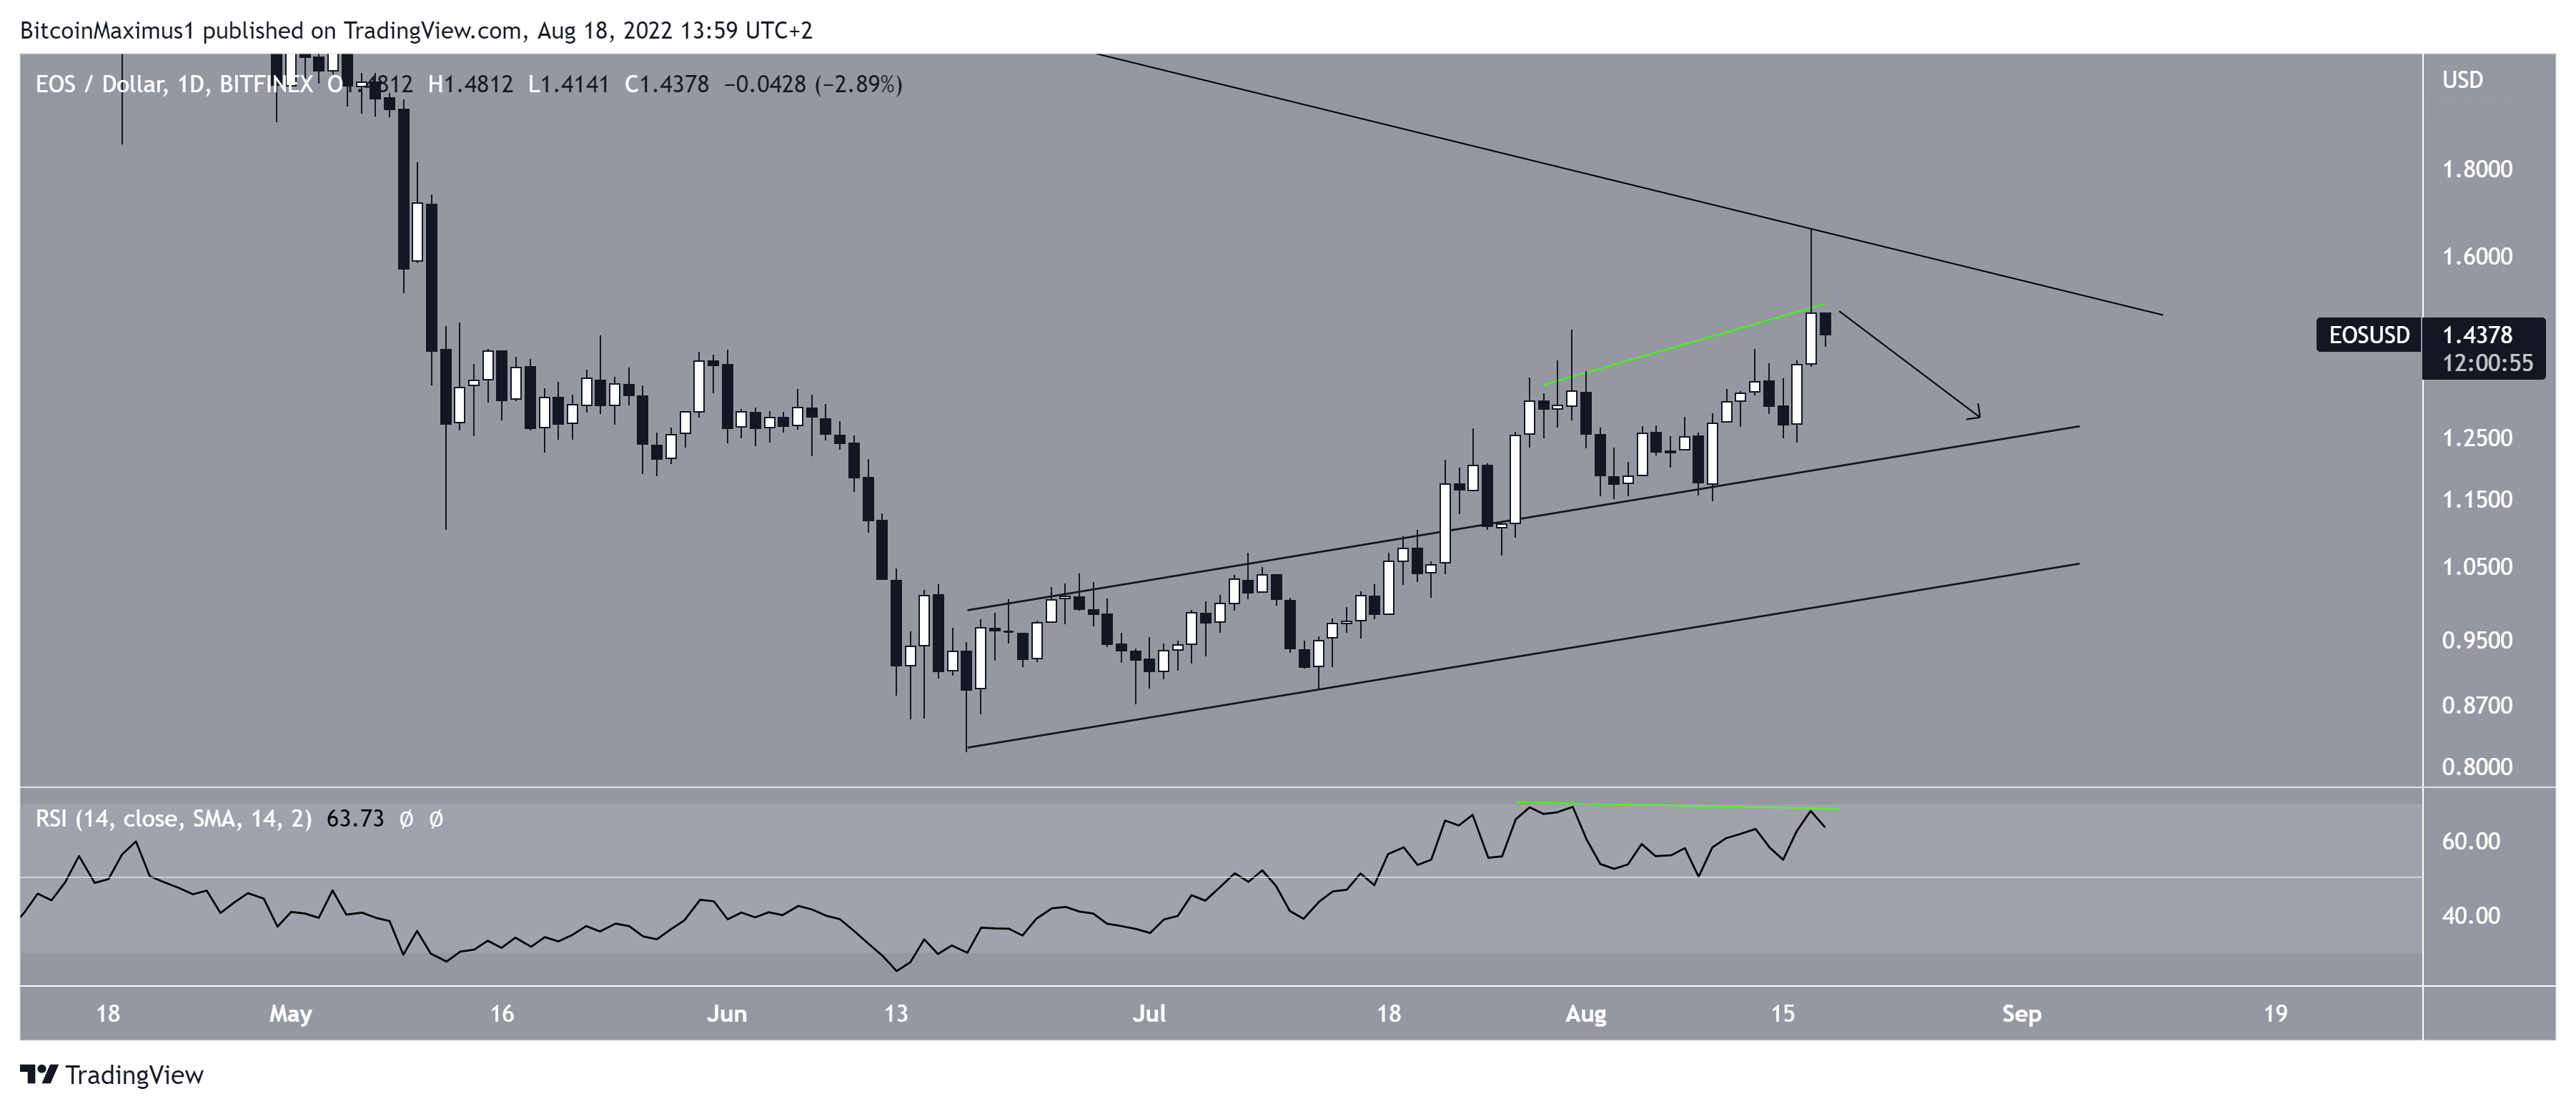
However, the daily chart indicates that an initial decrease could occur prior to the eventual breakout. The main reason for this is the daily RSI, which has generated bearish divergence, accompanying the long upper wick.
If a downward movement occurs, the closest support area would be at $1.25, created by the resistance line of the previous ascending parallel channel.
Short-term EOS movement
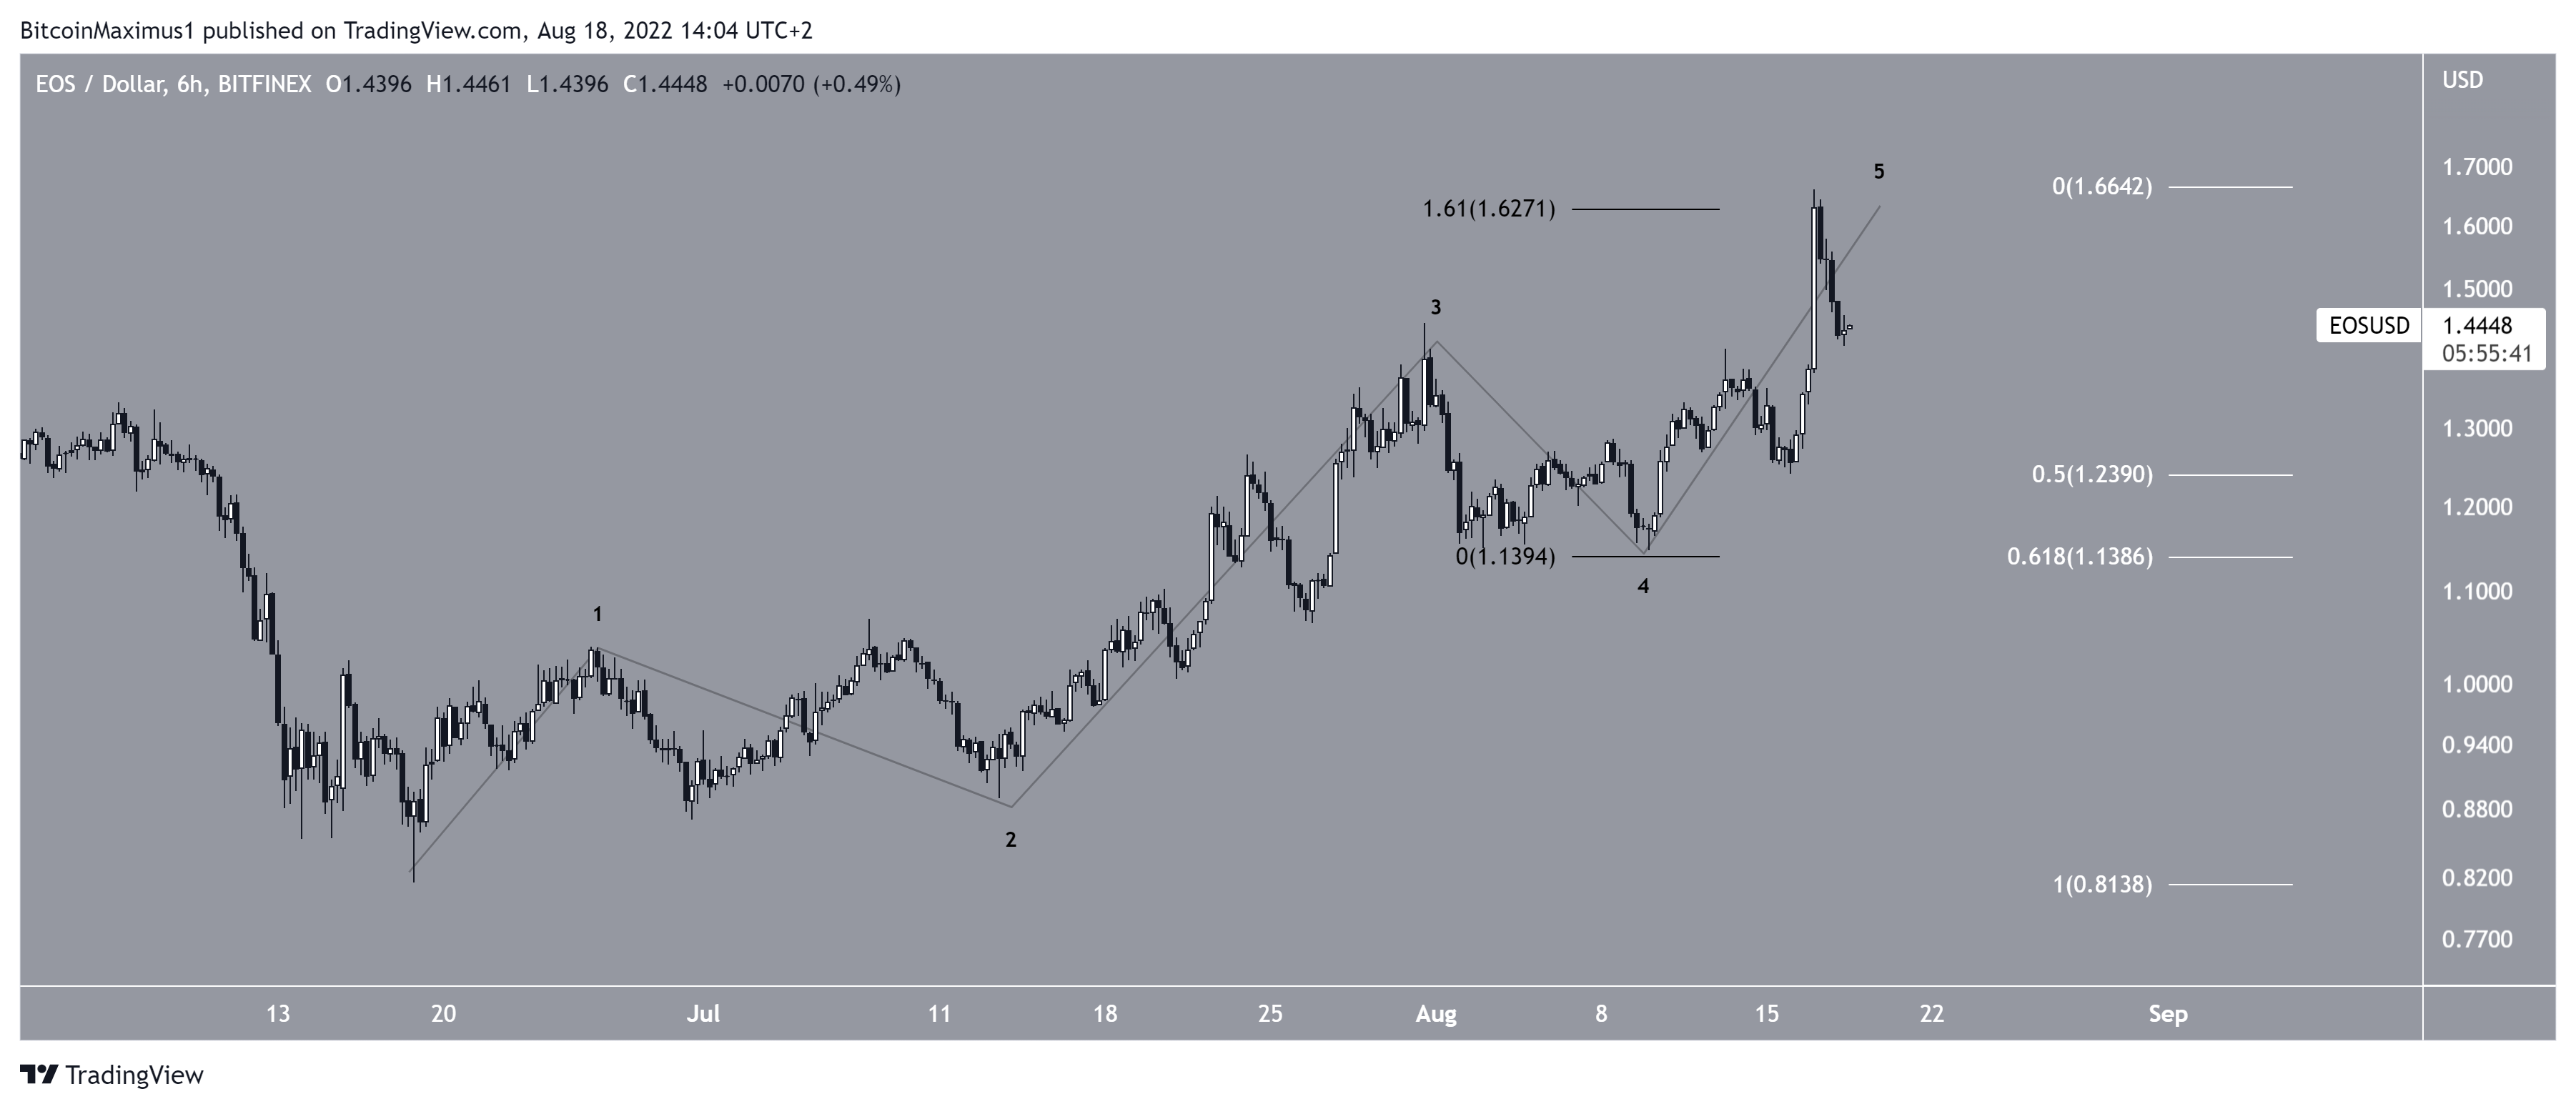
The most likely wave count suggests that EOS has completed a five-wave upward movement measuring from the June 18 low. The high was made right at the 1.61 external Fib retracement level of wave four (black). This is a common area for the top of wave five to be reached in.
If a downward movement follows, the main support area would be created by the 0.5-0.618 Fib retracement support levels at $1.14 – $1.24. This also coincides with the bottom of wave four and the support from the previous resistance line of the channel.
So, it is likely to act as the bottom is a retracement follow.
For Be[in]Crypto’s latest Bitcoin (BTC) analysis, click here


