


On May 23, 2019, the EOS price reached a low of $5.72. A gradual increase ensued which intensified on May 26. On May 31, the price reached a high of $8.65. It has been decreasing since.
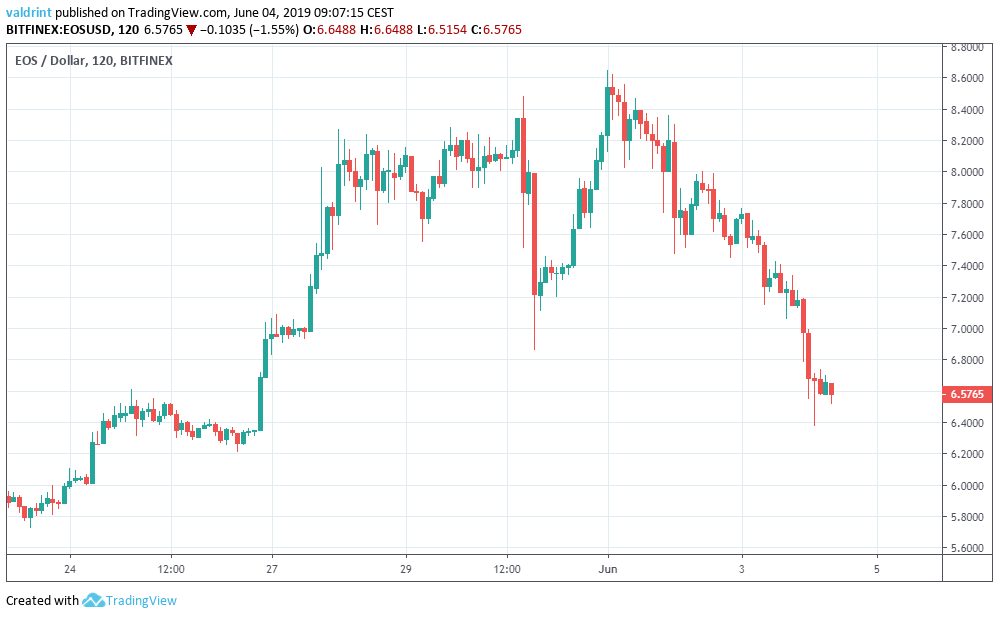
On May 30, EOS was listed on Coinbase.
EOS is launching at https://t.co/iQARfi557o and in the iOS and Android apps within the next 15 minutes. You may need to update your app to properly buy, sell, convert, send, receive, or store EOS. We will update when EOS is fully live. https://t.co/sh8XmE1Wit
— Coinbase (@coinbase) May 30, 2019
Prices increased throughout the day. However, a rapid decrease began the next day. This could be a response to the decreases suffered by Bitcoin. As we have seen, the EOS price follows that of BTC in rapid upward and downward moves.
For more on EOS, keep reading below:
EOS Price: Trends and Highlights for June 4, 2019
- The EOS price reached a high of $8.65 on May 31.
- It broke down from a short-term ascending support line.
- It is trading inside a longer-term broadening ascending wedge.
- There are two instances of bearish divergence developing in the RSI.
- The price is trading below the moving averages.
- There is support near $6.
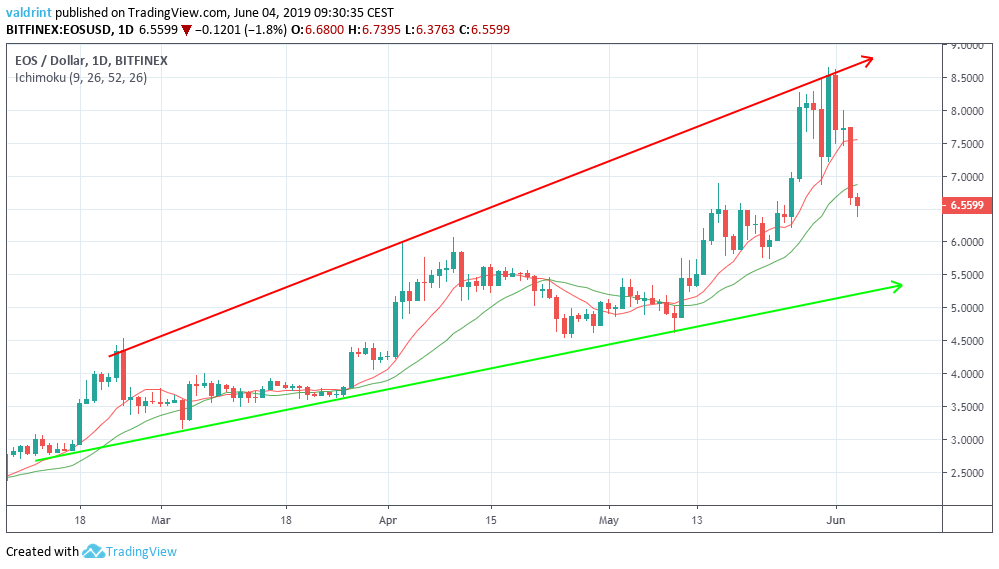
Tracing the Current Trading Pattern
On May 23, the price reached a low of $5.72. A gradual increase ensued which intensified on May 26. The price has made several higher lows.
Tracing these lows gives us an ascending support line.
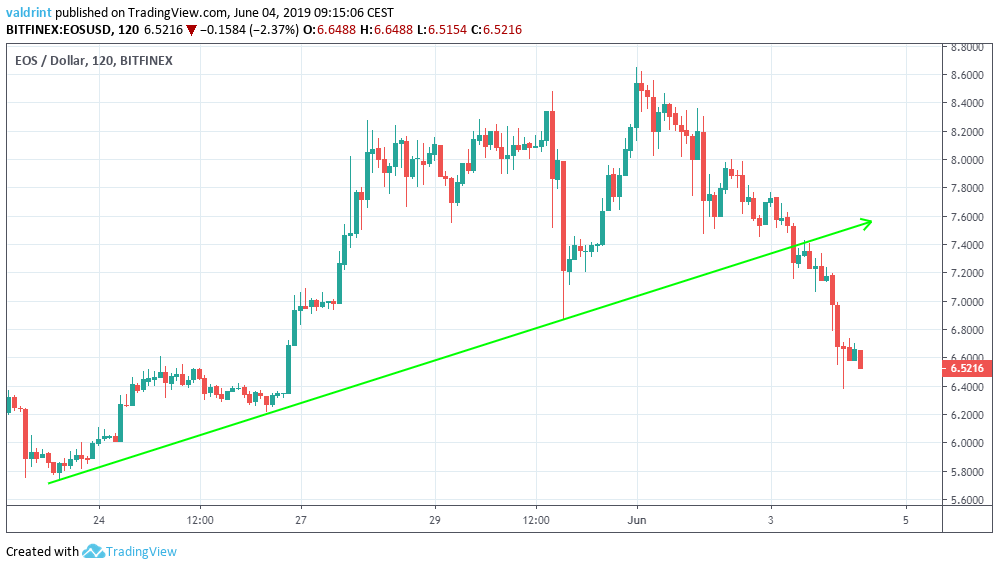
On Jun 3, the EOS price broke down from the support line.
In order to figure out where it is heading, a look at a longer time-frame is required.
On Feb 17, the price made a low of $2.82. A gradual increase took it to a high of $4.53 on Feb 24. Since then, the price has been trading inside the ascending broadening wedge outlined below:
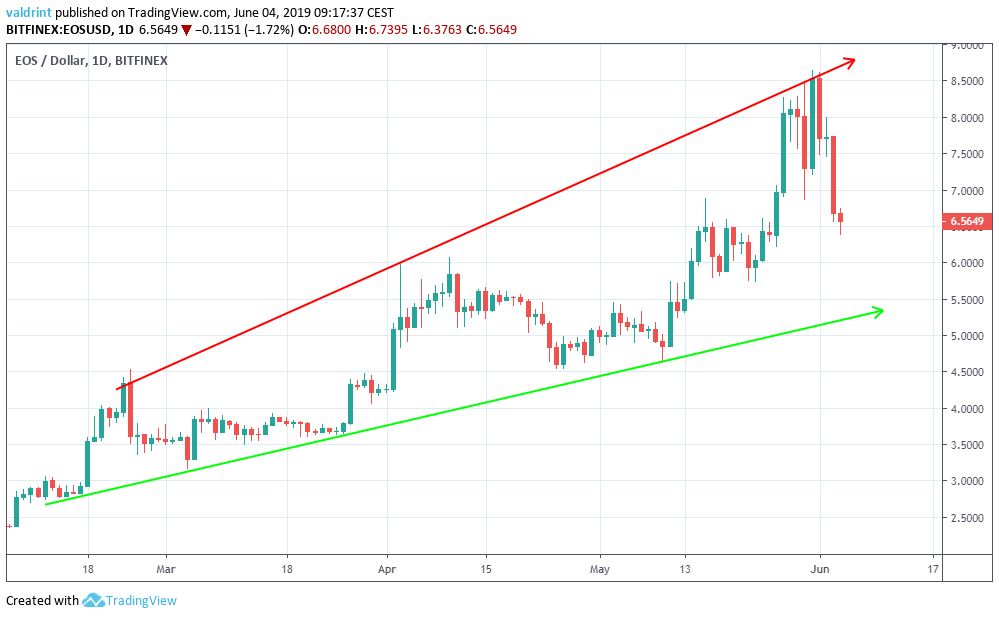
On May 31, the price touched the resistance line of the channel. It has been decreasing since.
At the time of writing, EOS is trading in the middle of the wedge.
How long will the decrease continue?
A look at technical indicators is required in order to find out.
Possible Reversal?
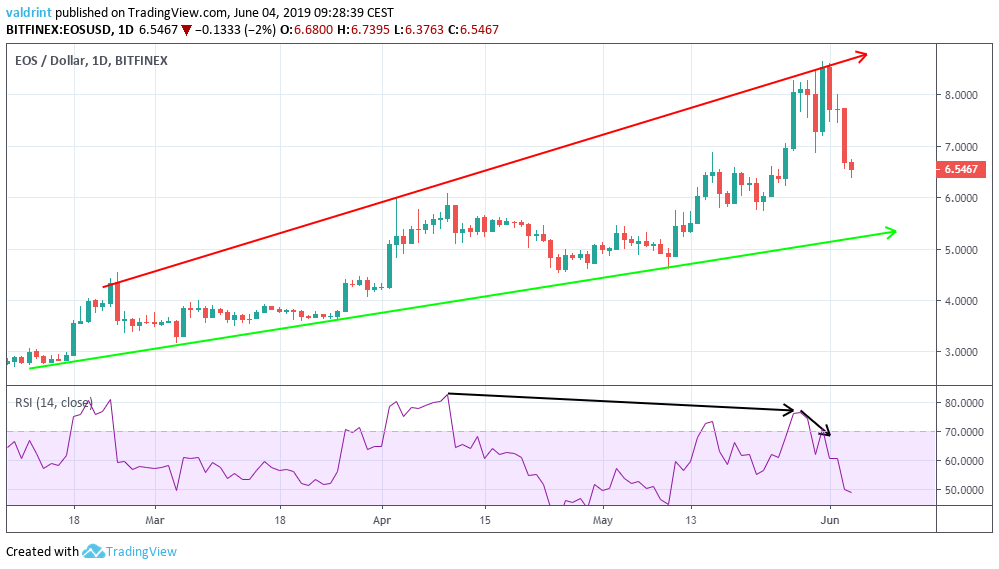
On Apr 10, the price made a high of $6.07. Likewise, the RSI made a high on the same date. However, while the price has continued to increase, the RSI has generated lower values.
This is known as bearish divergence and often precedes price decreases.
On May 27, there is another case of divergence in the 31 highs.
In order to get a clearer picture of the price outlook, we will analyze the price alongside the 10-day and the 20-day moving averages (MA) below:
On May 11, the 10-day MA crossed above the 20-day MA. This is called a bullish cross and often indicates that an uptrend has begun. This preceded the increase towards the resistance line.
However, the recent decrease has taken the EOS price below both MAs. A bearish cross has yet to occur.
The use of these indicators makes it likely that the price will decrease until it finds a support area.
Support Areas
In this section, we incorporate support areas to predict where the EOS price can initiate a possible reversal.
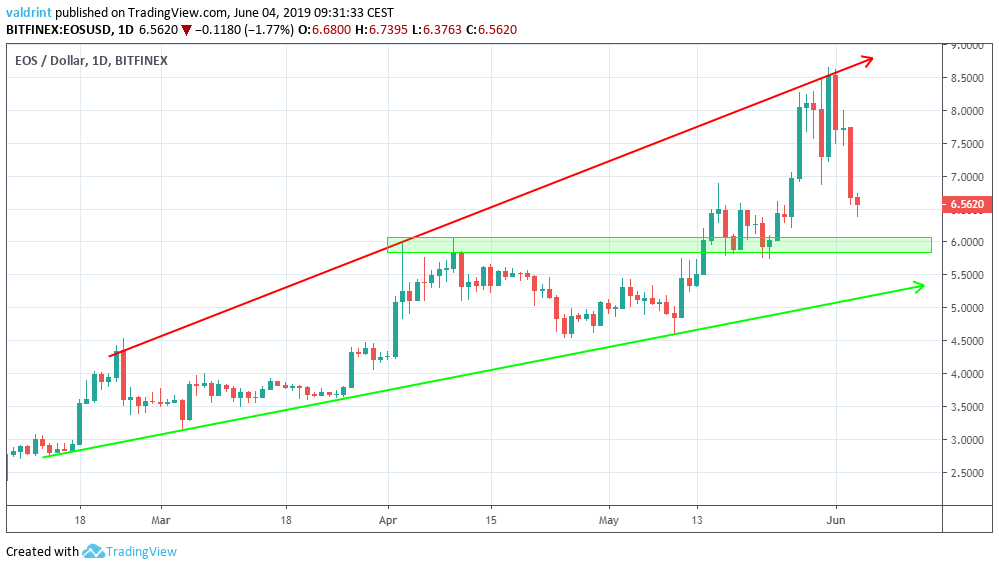
The closest support area is found near $6. The price is likely to reach this area in the near future. If it is unsuccessful in initiating a reversal, the EOS price is likely to drop towards the support line near $5.
Summary of Analysis
Based on our analysis, it is likely that the EOS price will decrease until it reaches the support area and possibly the support line.
Do you think the price of EOS will reach the support area? Let us know your thoughts in the comments below!
Disclaimer: This article is not trading advice and should not be construed as such. Always consult a trained financial professional before investing in cryptocurrencies, as the market is particularly volatile.


