
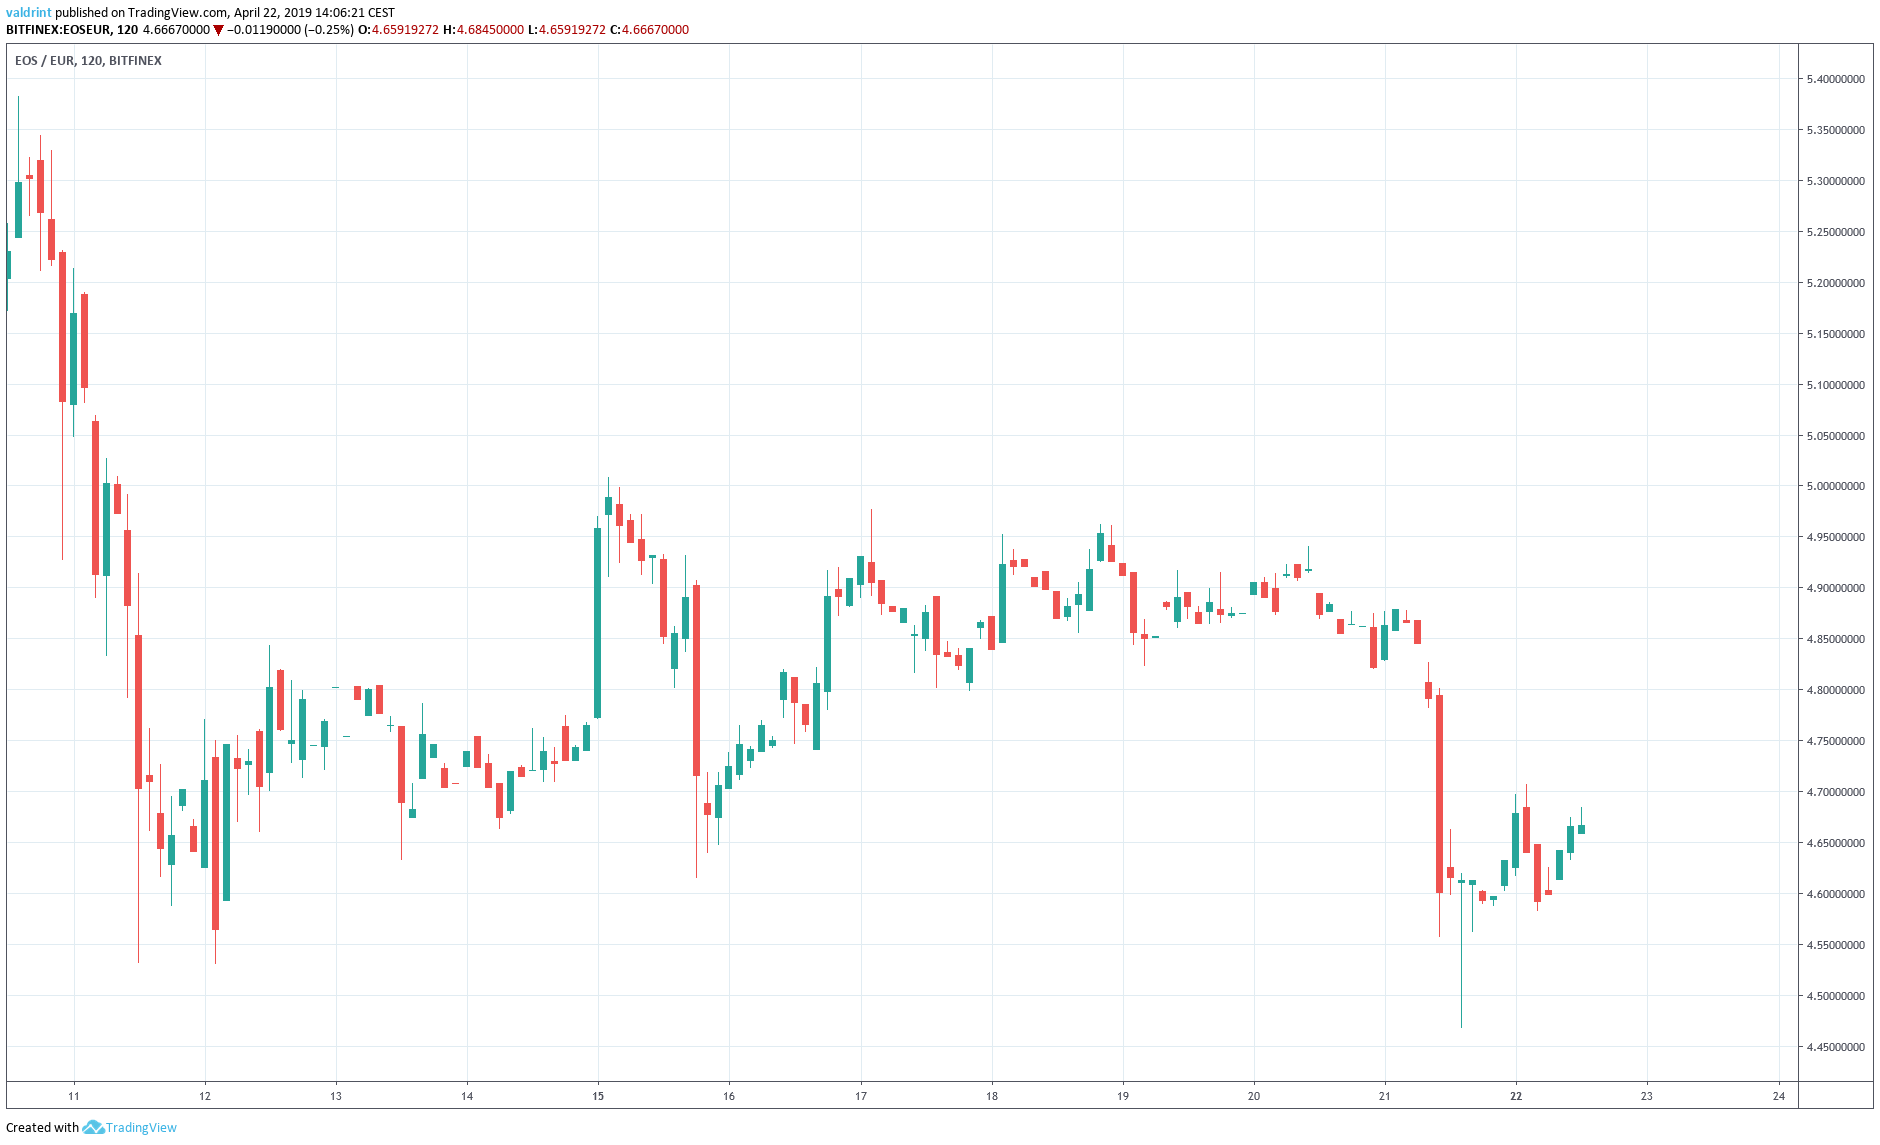
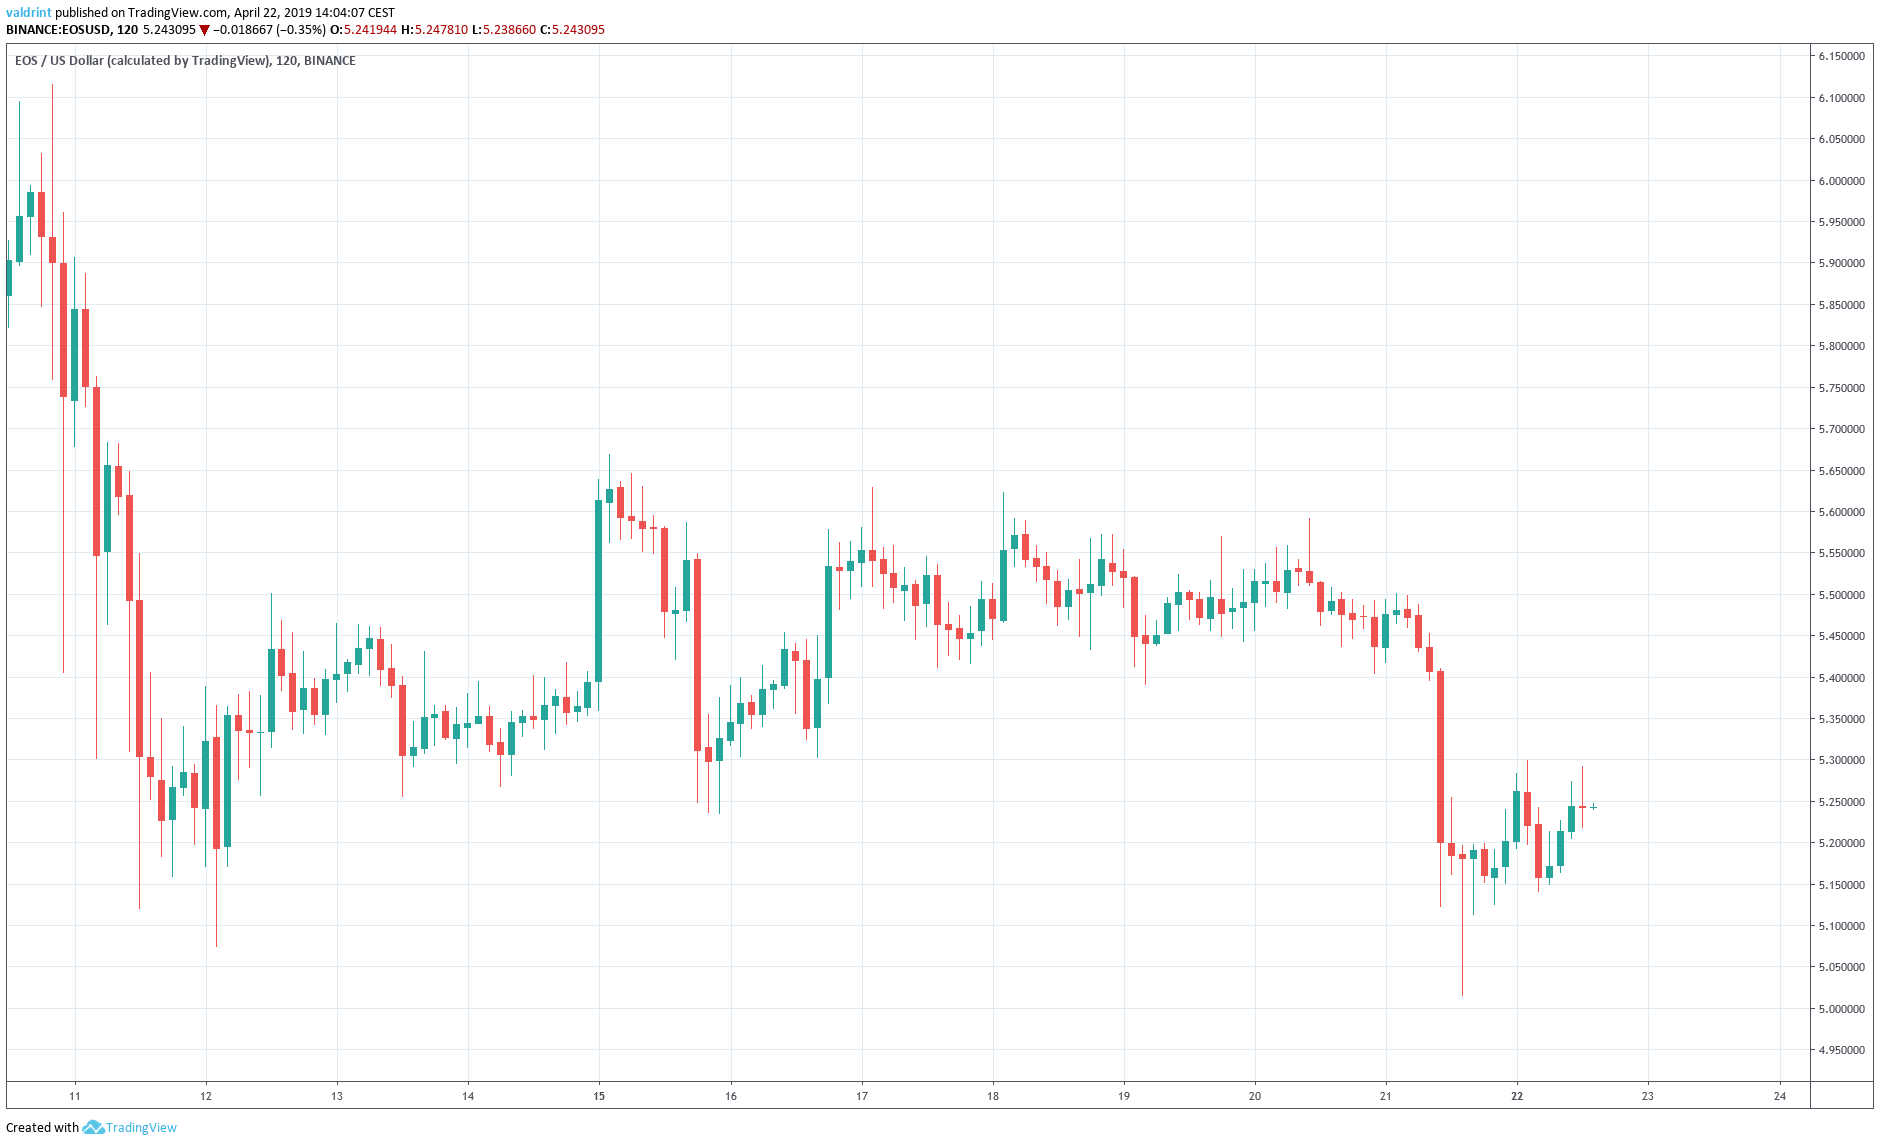
On Apr 10, 2019, the price of EOS reached a high of $6.07 and €5.38. A sharp increase ensued, and the price reached a low of $5.07 and €4.53 on Apr 12. After a gradual increase, the price dropped to the same levels on Apr 22.
Where will the price go next? Let’s find out.
EOS: Trends And Highlights For April 22, 2019
- EOS reached a high of $6.07 and €5.38 on Apr 10.
- It is trading inside a horizontal channel.
- Bullish divergence is developing in the RSI.
- There is support near $4.9 and €4.35.
Tracing the Current Trading Pattern
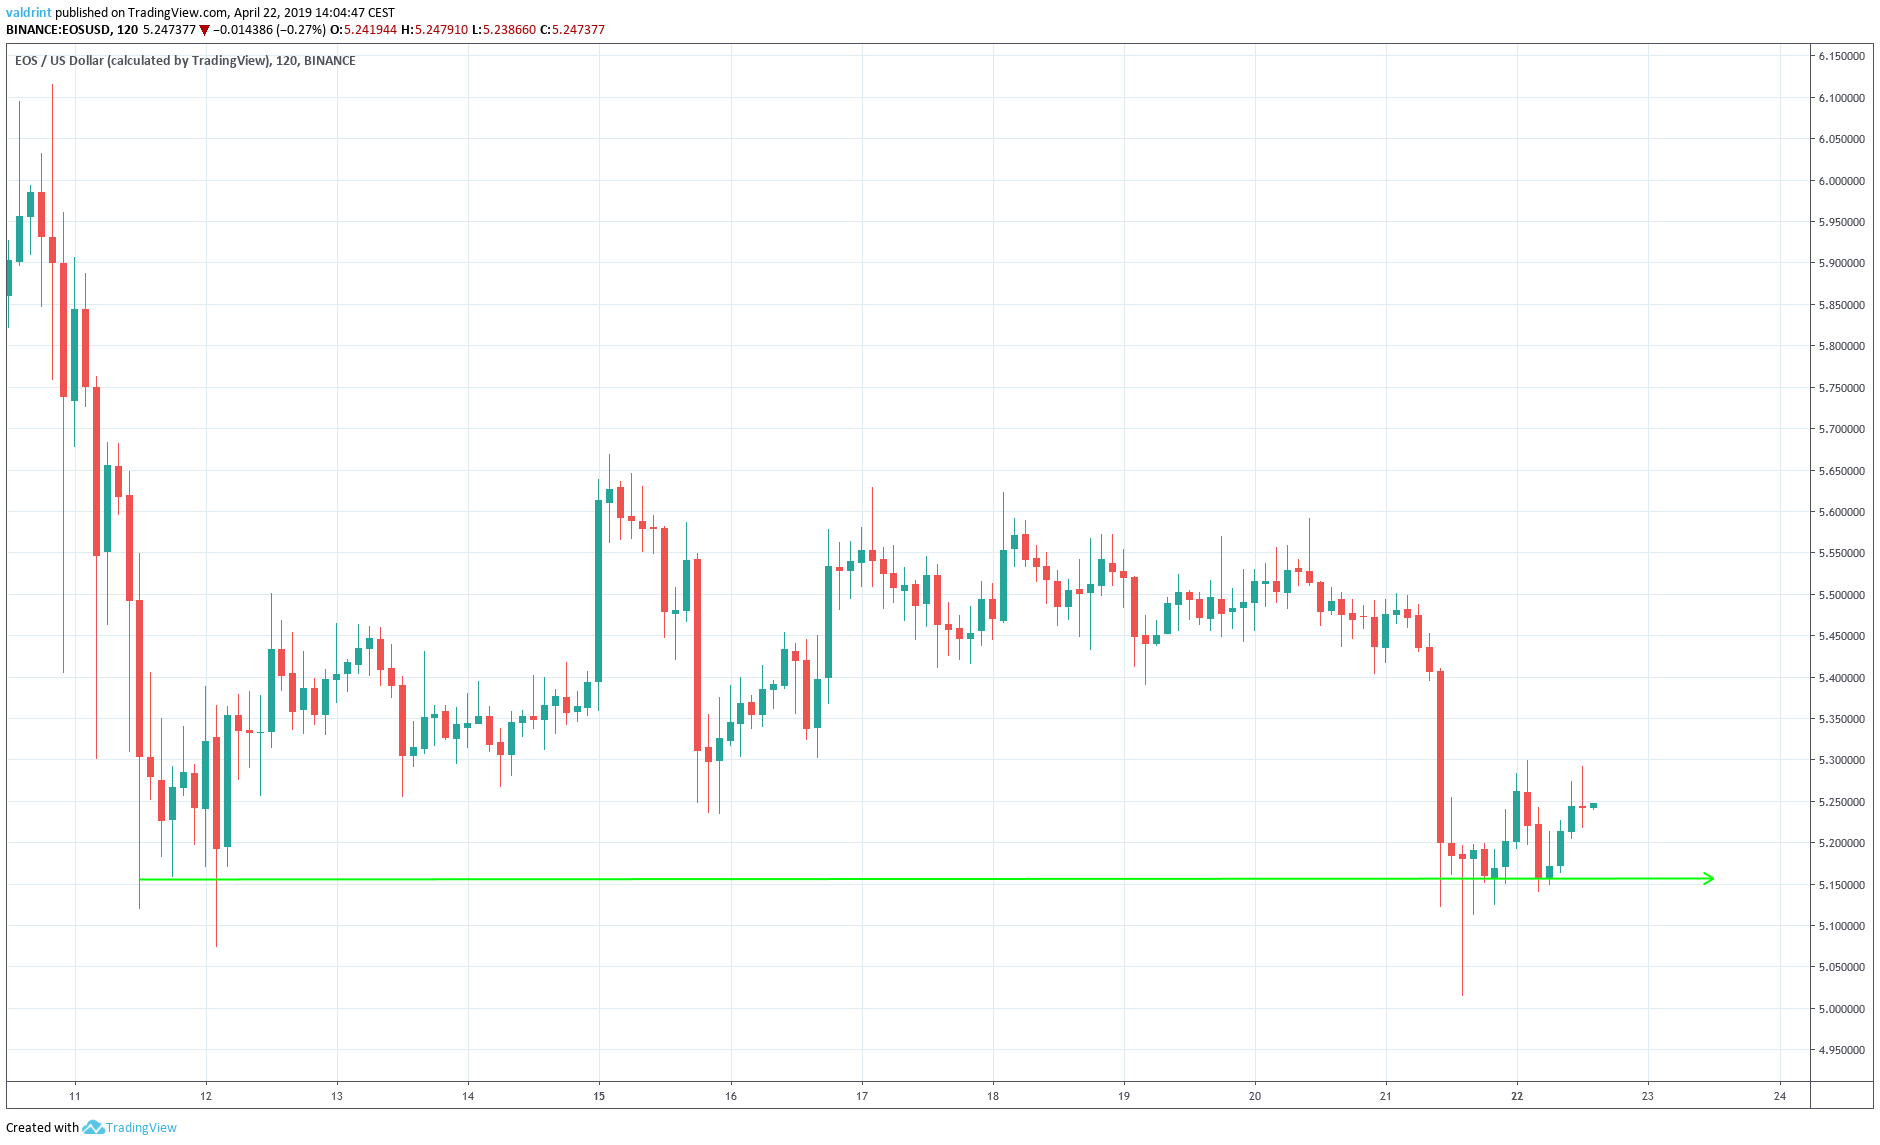
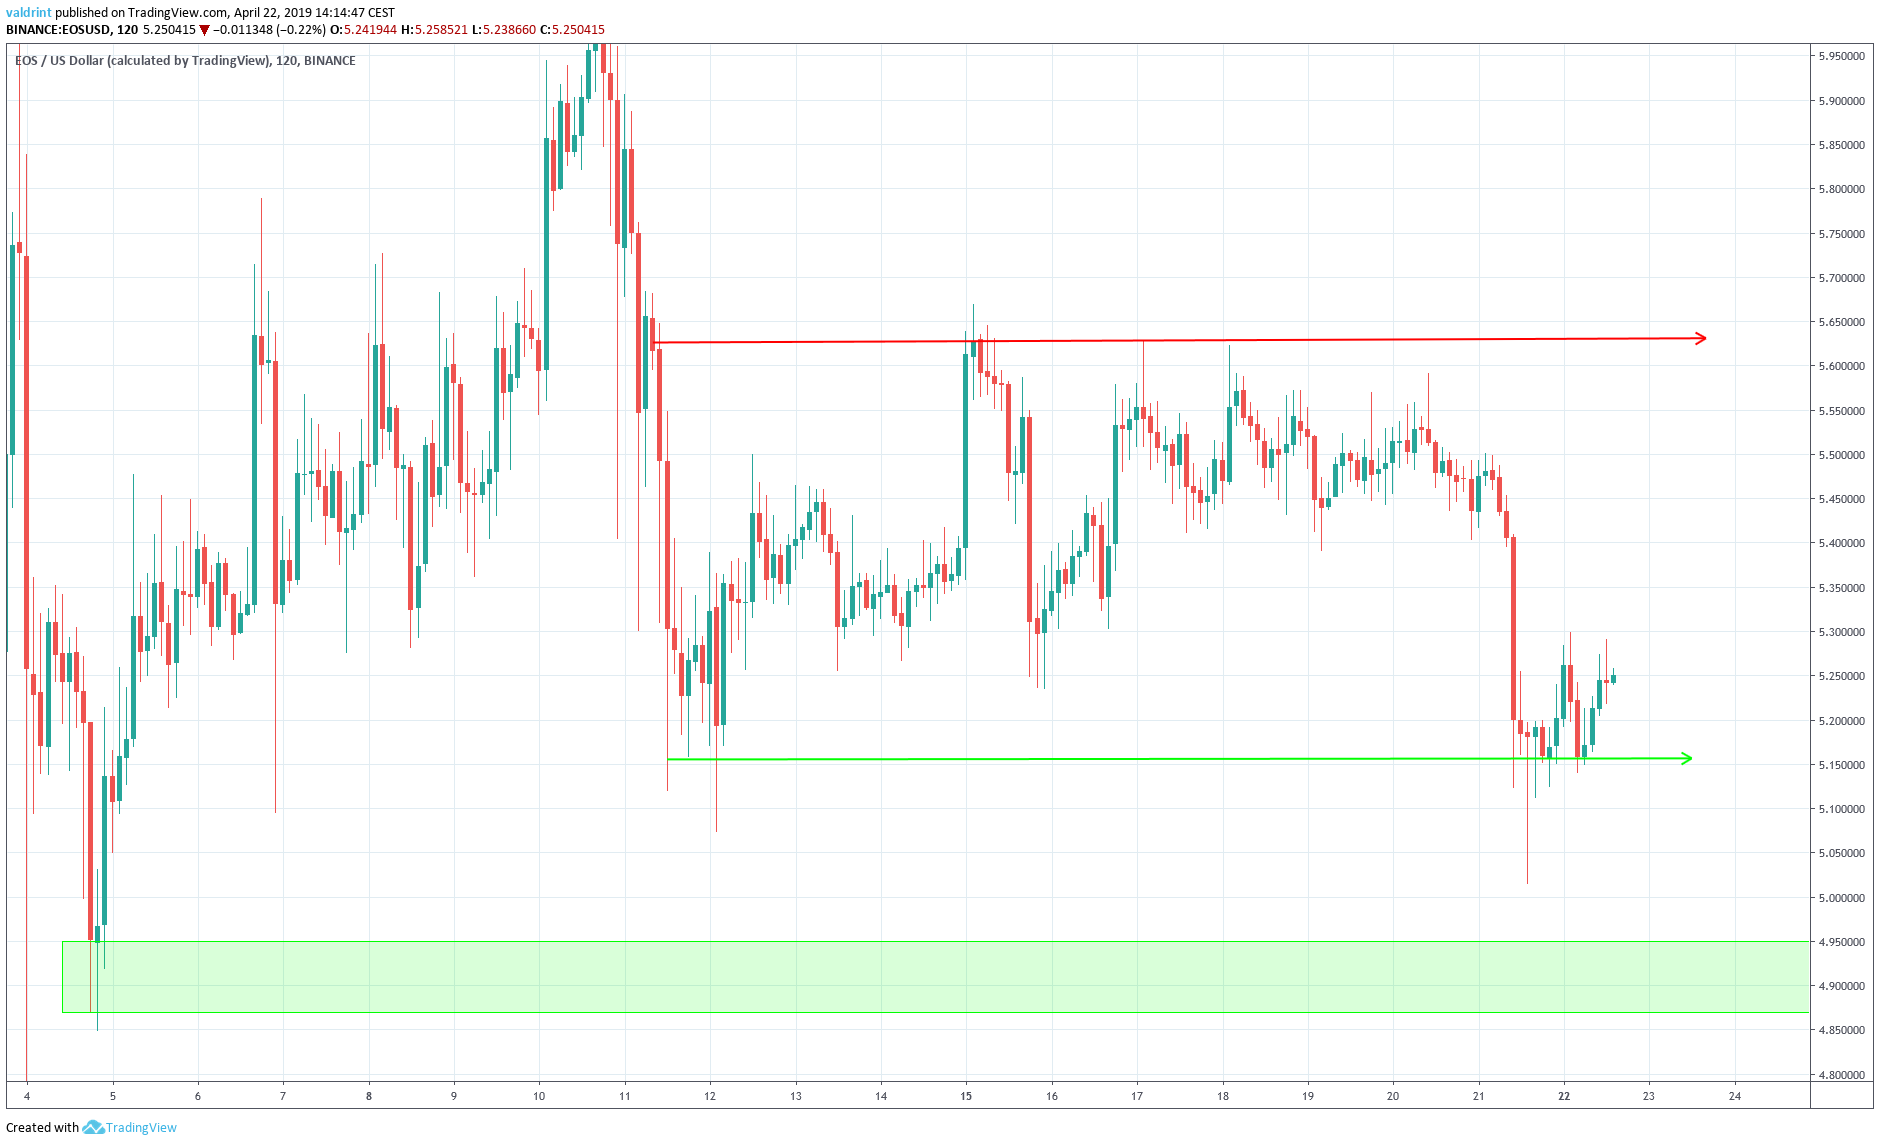
On Apr 11, the price made a low of $5.11. Several market cycles have been completed and the price has reached a similar level four times. Most recently, these levels were reached on Apr 21 and 22.
Tracing these lows gives us a horizontal support line:
On Apr 11, the price reached an hourly high of $5.64. Several market cycles have been completed and the price has reached the same level three times.
Tracing these highs gives us a horizontal resistance line.
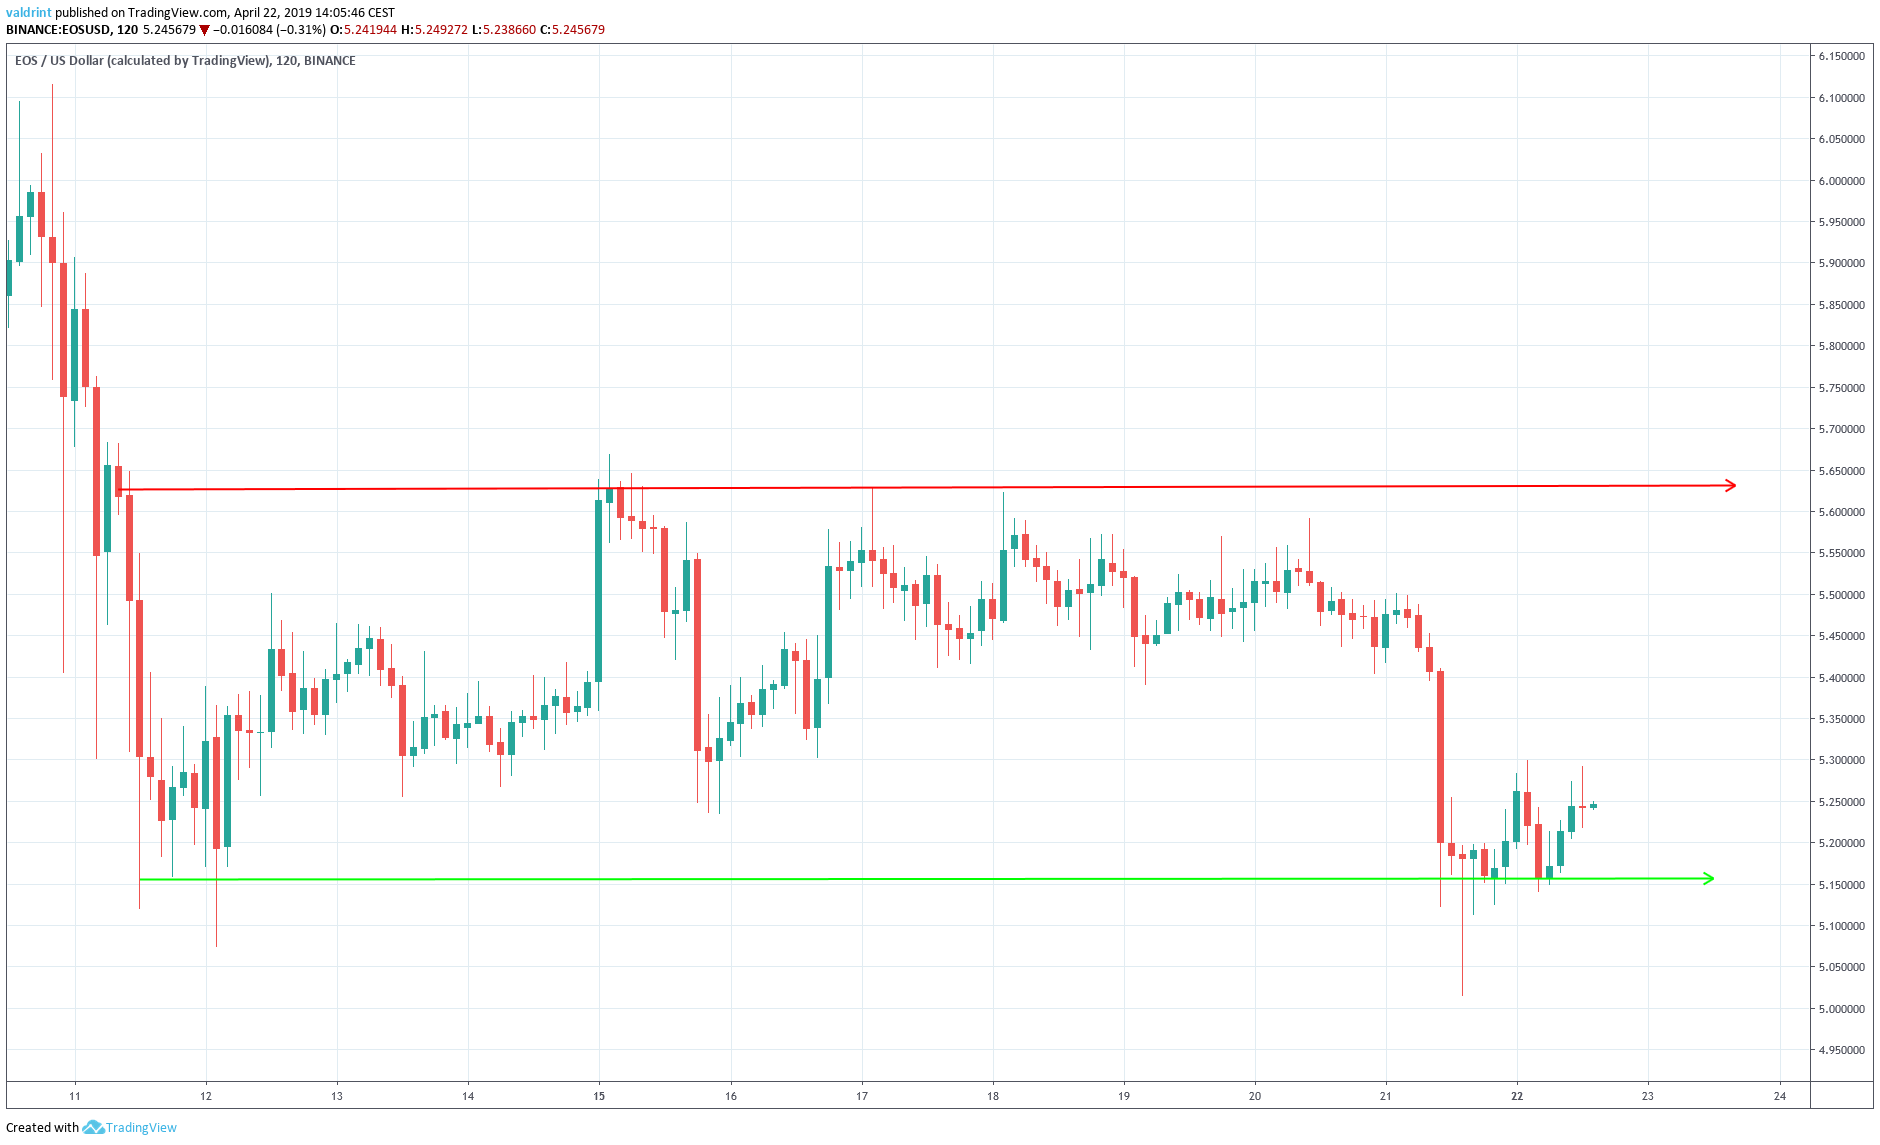
The resistance and support lines combine to create a horizontal channel.
It is likely that the price will keep trading inside the confines of this channel until a decisive move occurs.
In order to figure out the direction of the move, we need to look at some technical indicators.
Technical Indicators
In this section, we incorporate RSI in our analysis to better assess possible future price fluctuations.
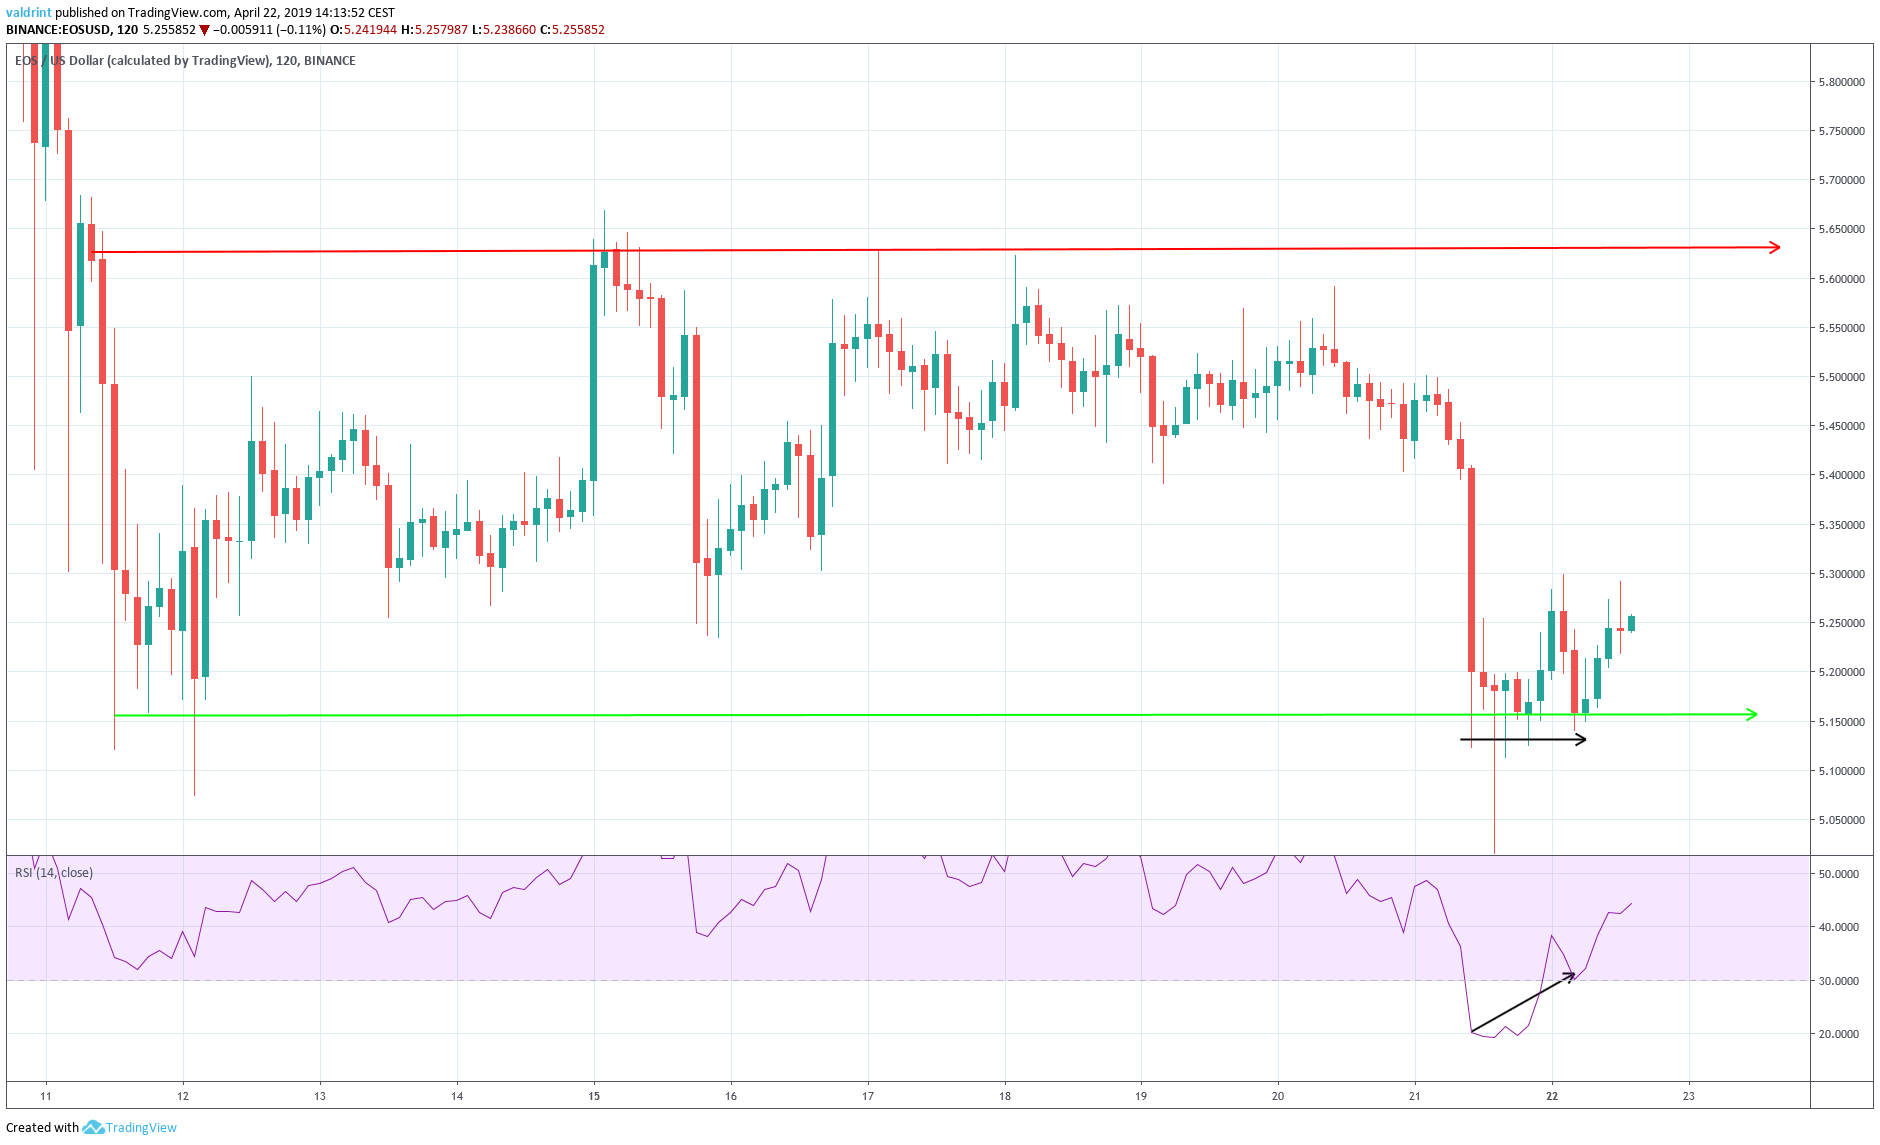
On Apr 21, the price reached an hourly low of $5.12. It reached the same level on Apr 22.
Similarly, the RSI made the first low on Apr 21. However, it has continued to generate higher values.
This is known as bullish divergence and often precedes price increases.
The use of RSI suggests that the price will increase towards the resistance line of the channel.
Future Movement
In this section, we incorporate support areas into the analysis to determine possible future price levels.
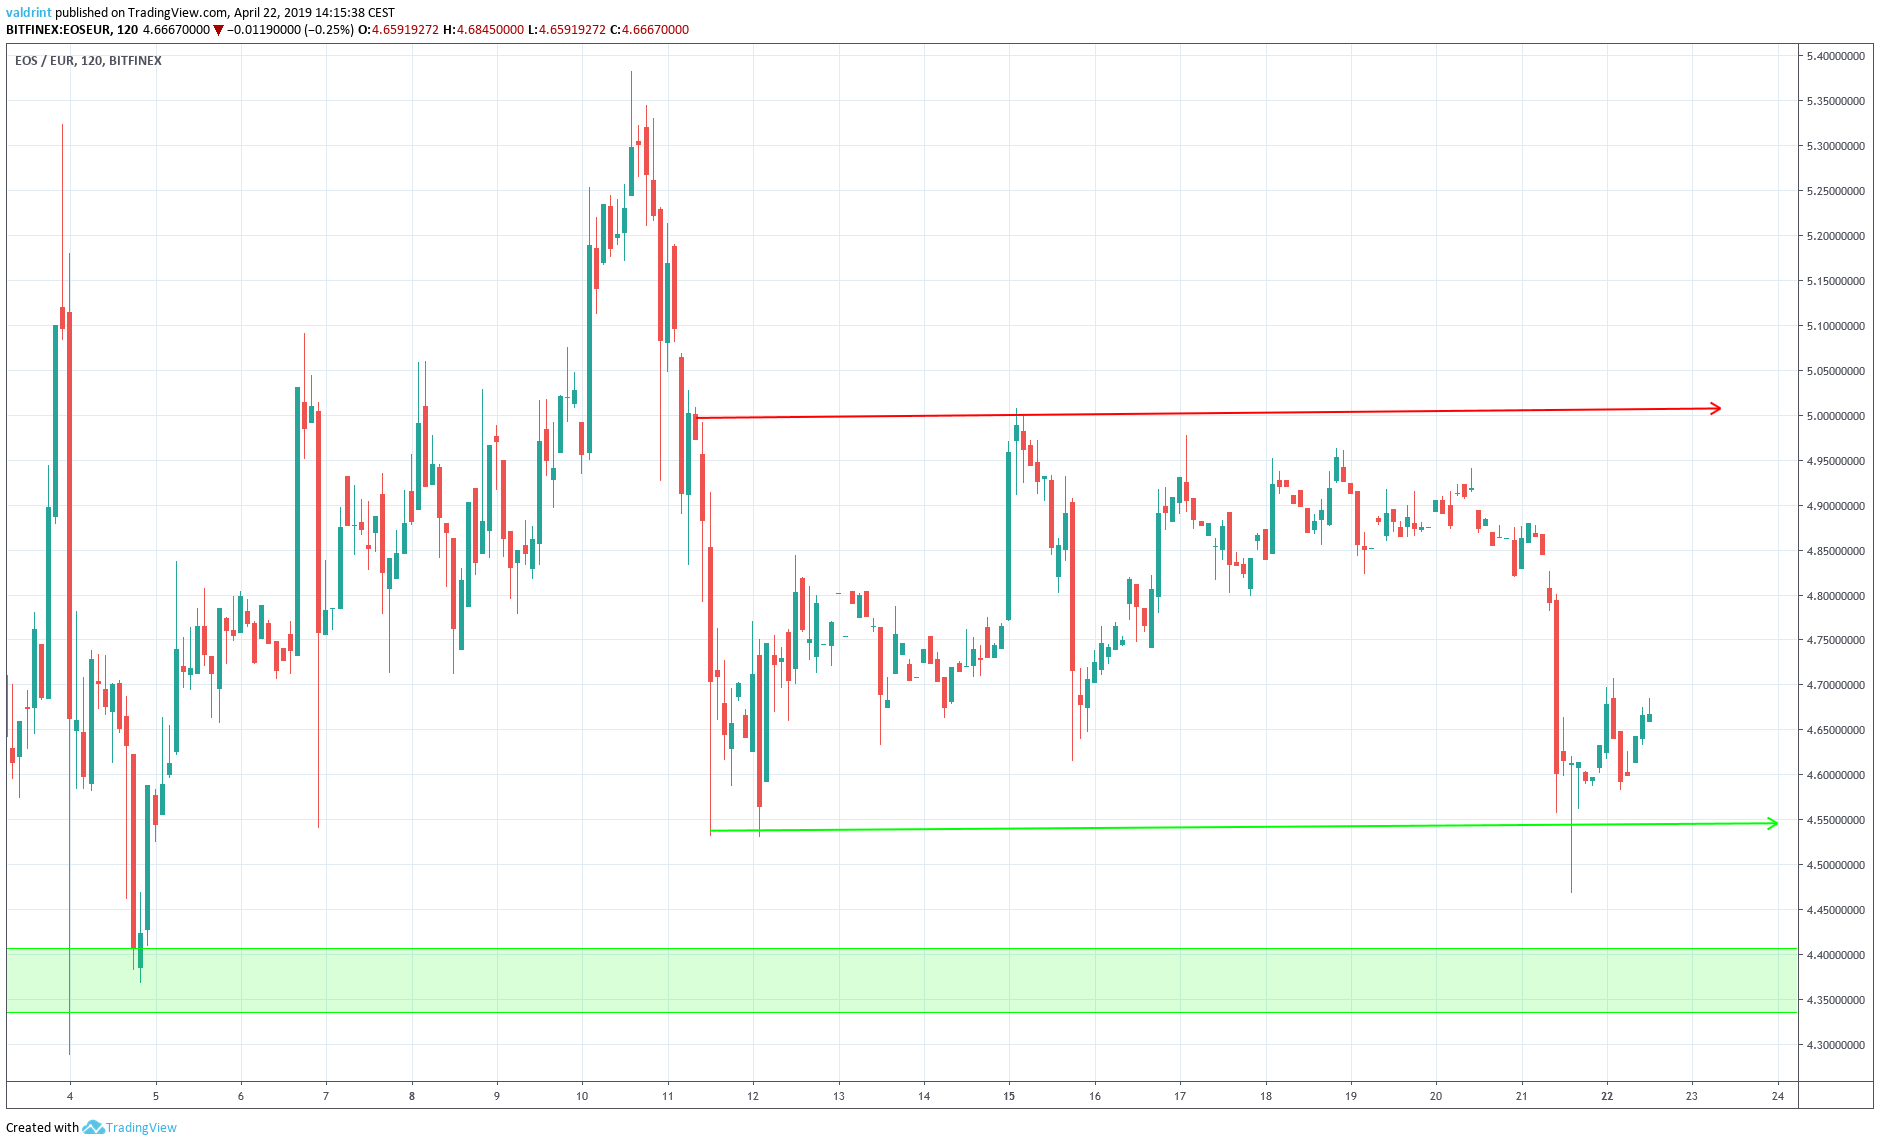
The price is currently trading on the support line of the channel. While we do not believe a breakdown is likely, it is still possible.
In case a breakdown occurs, the closest support area is found near $4.9 and €4.35. We do not believe the price will reach this area in the near future. It is more likely that EOS is currently beginning a reversal toward the resistance line of its current trading pattern.
Summary of Analysis
Based on our analysis, it is likely that the price of EOS will begin to increase towards the resistance line of the channel. This means that price gains may be seen in the near future.
Do you think the price of EOS will break down from the channel? Let us know your thoughts in the comments below!
For 2019 and 2020 price predictions, click on the green button below:
Disclaimer: This article is not trading advice and should not be construed as such. Always consult a trained financial professional before investing in cryptocurrencies, as the market is particularly volatile.
