See More

Will EOS Begin a Downward Move? (EOS/USD and EOS/EUR Price Analysis for 04/19/19)

3 mins
Updated by Alexander Fred
Join our Trading Community on Telegram
At BeInCrypto, we offer regular price analyses and predictions of the most popular and relevant cryptoassets. In our Apr 16 analysis of EOS (EOS), we predicted a slight increase in the price. Our prediction has since been validated. In this analysis, we take a look at the price in both euros and dollars to predict possible price fluctuations in USD($) and EUR(€).

On Apr 10, 2019, the price of EOS reached a high of  $6.07 and €5.38. A sharp increase ensued, and the price reached a low of $5.07 and €4.53 on Apr 12.
It has been on an uptrend since:
EOS Market Outlook
EOS/USD and EOS/EUR Prices: Apr 11 – Apr 19
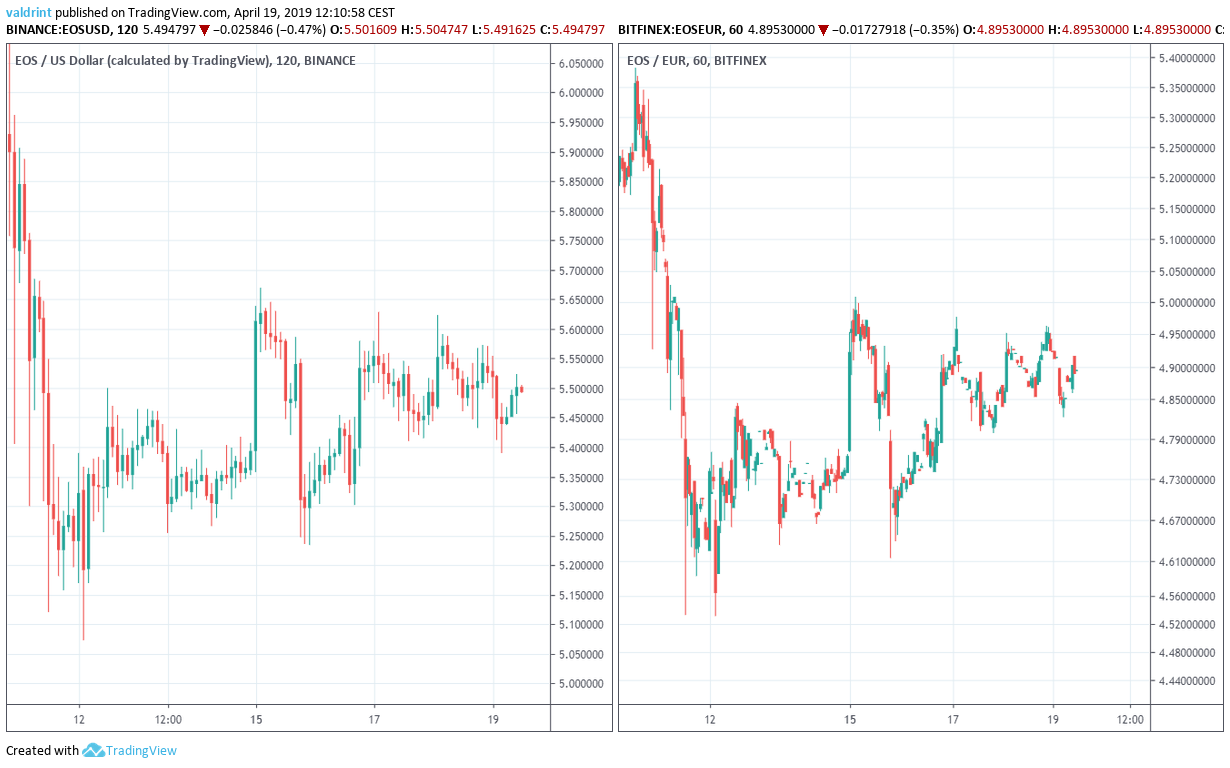
Will the price rise back up to $6/€5.3 or fall back down to $5/€4.4? Let’s find out:

EOS: Trends And Highlights For April 19, 2019

  • EOS reached a high of $6.07 and €5.38 on Apr 10.
  • It appears to be trading inside a symmetrical triangle.
  • Long-term bearish divergence is developing in the RSI.
  • There is support near $4.9 and €4.35.

Tracing the Current Trading Pattern

The price of EOS on Binance was analyzed at one-hour intervals from Apr 4 to Apr 19 to trace the current trading pattern. We do not include euros in this section because only one trading pair is needed to accomplish this. Both EOS/USD and EOS/EUR are discussed in the final section.
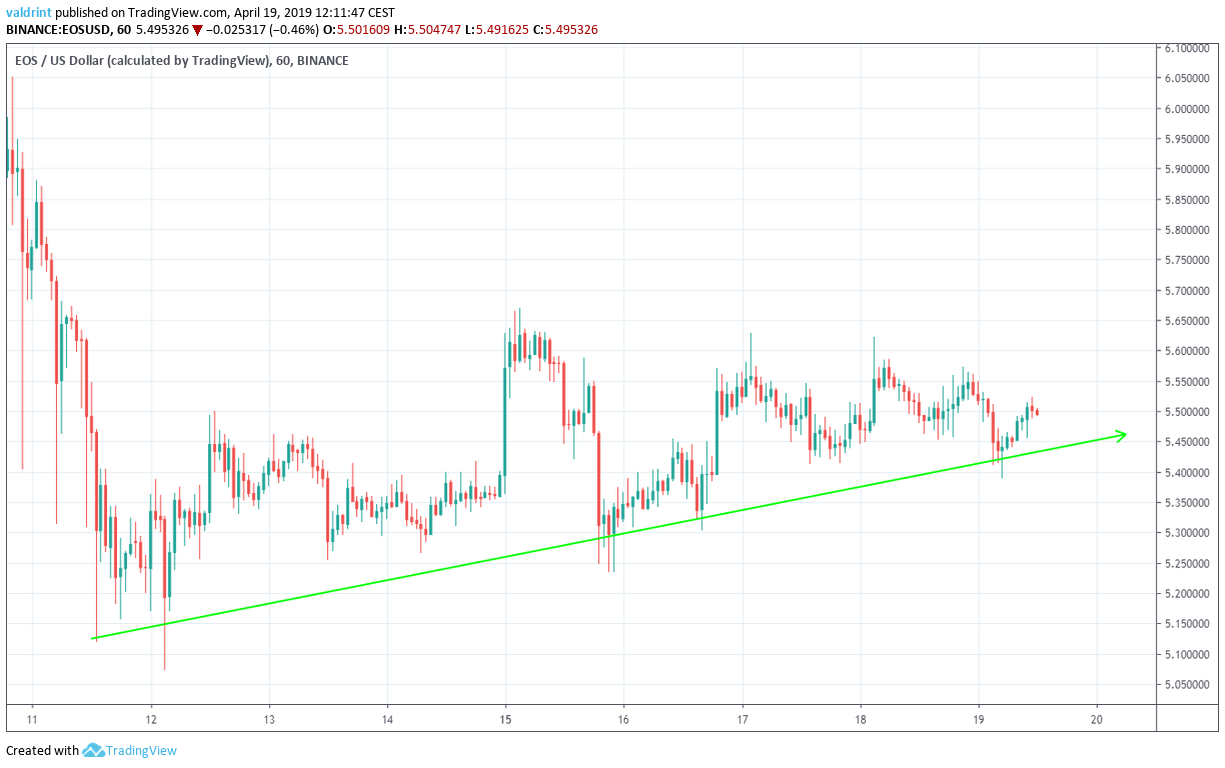
On Apr 11, the price made a low of $5.11. Since then, it has been increasing, creating several higher lows. Tracing these lows gives us an ascending support line: EOS Support Line On Apr 11, the price reached an hourly high of $5.67. Several market cycles have been completed and the price has made several lower highs. Tracing these highs gives us a descending resistance line. The resistance and support lines combine to create a symmetrical triangle: EOS Symmetrical Triangle 
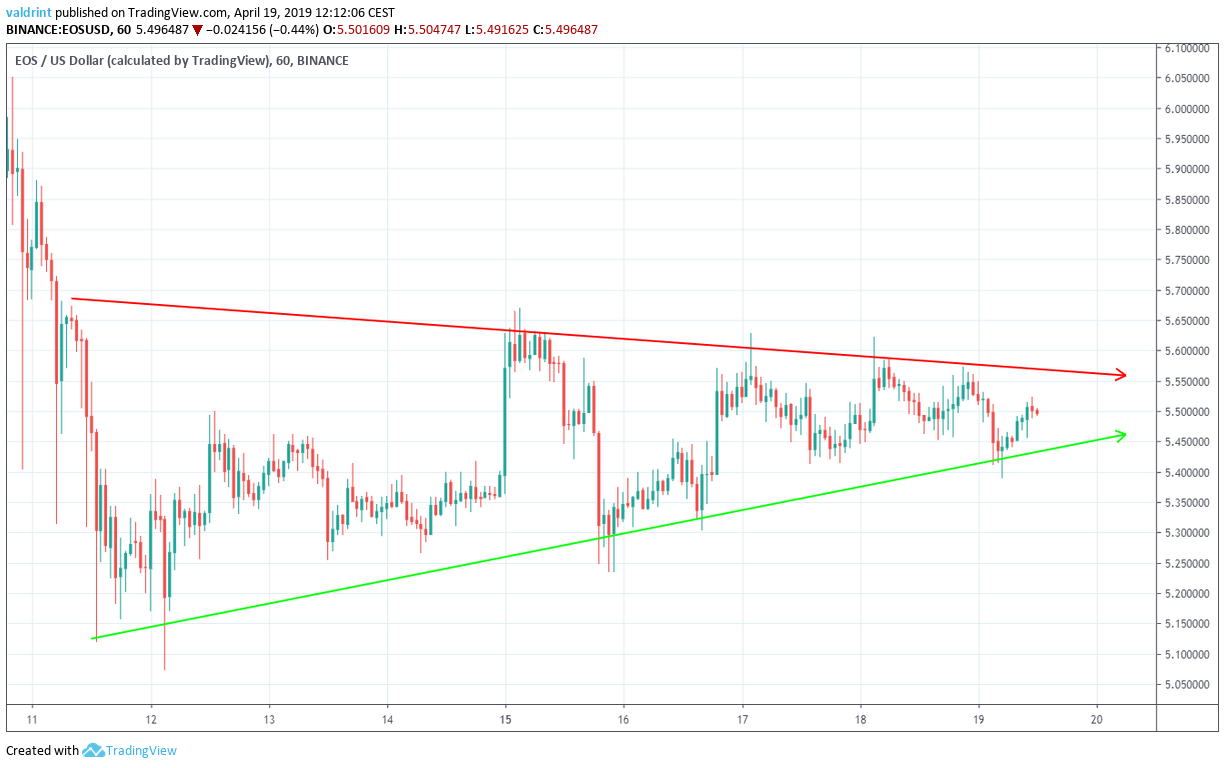
It is likely that the price will keep trading inside the confines of this triangle until a decisive move occurs. In order to figure out the direction of the move, we need to look at a longer time-frame and incorporate technical indicators.

Technical Indicators

The price of EOS on Binance was analyzed at one-day intervals from Oct 2018 to Apr 2019 alongside the relative strength index and resistance areas to determine possible future price movements.
The relative strength index (RSI) is an indicator which calculates the size of the changes in price in order to determine oversold or overbought conditions in the market.
Resistance areas are created when the price reaches a certain level numerous times. They can act as a reversal area in case a breakdown or breakout occurs.
RSI and one resistance area are traced for EOS/USD below:
EOS Bearish Divergence
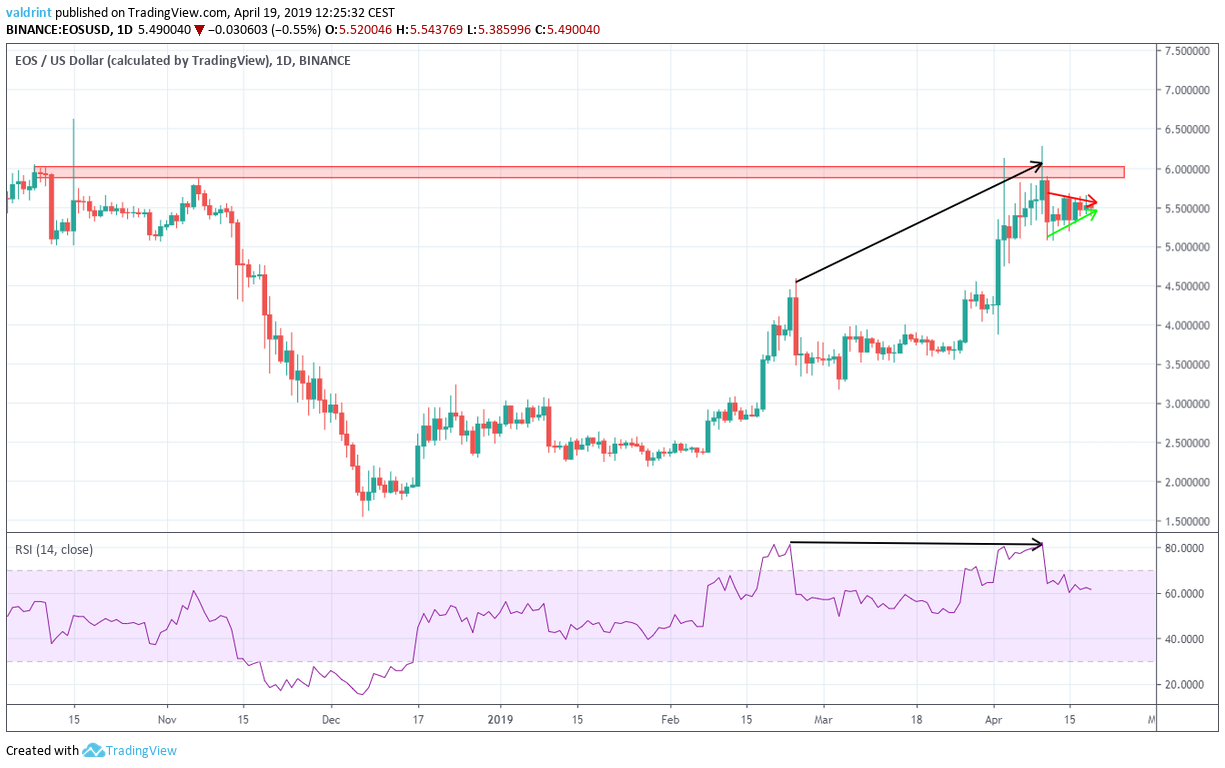
On Feb 24, the price reached a high of $4.58. It continued to increase and on Apr 10 it reached a high of $6.06. Similarly, the RSI made the first high on Feb 24. However, it has continued to generate lower or identical values. This is known as bearish divergence and often precedes price decreases. The divergence is very significant in value. Furthermore, it is occurring close to a major resistance area near $6. The use of this indicator makes it unlikely that the price will have enough strength to move above the resistance area at $6. Price losses and a breakdown seem more likely.

Future Movement

In this section, we incorporate support areas into the analysis to determine possible future price levels.
Support areas are created when the price reaches a certain level numerous times. They can act as a reversal area in case a breakdown or breakout occurs.
One support area is shown for EOS/EUR (first graph) and EOS/USD (second graph) below:
Support Areas
EOS/EUR Support Areas
Reversal Areas
EOS/USD Support Areas
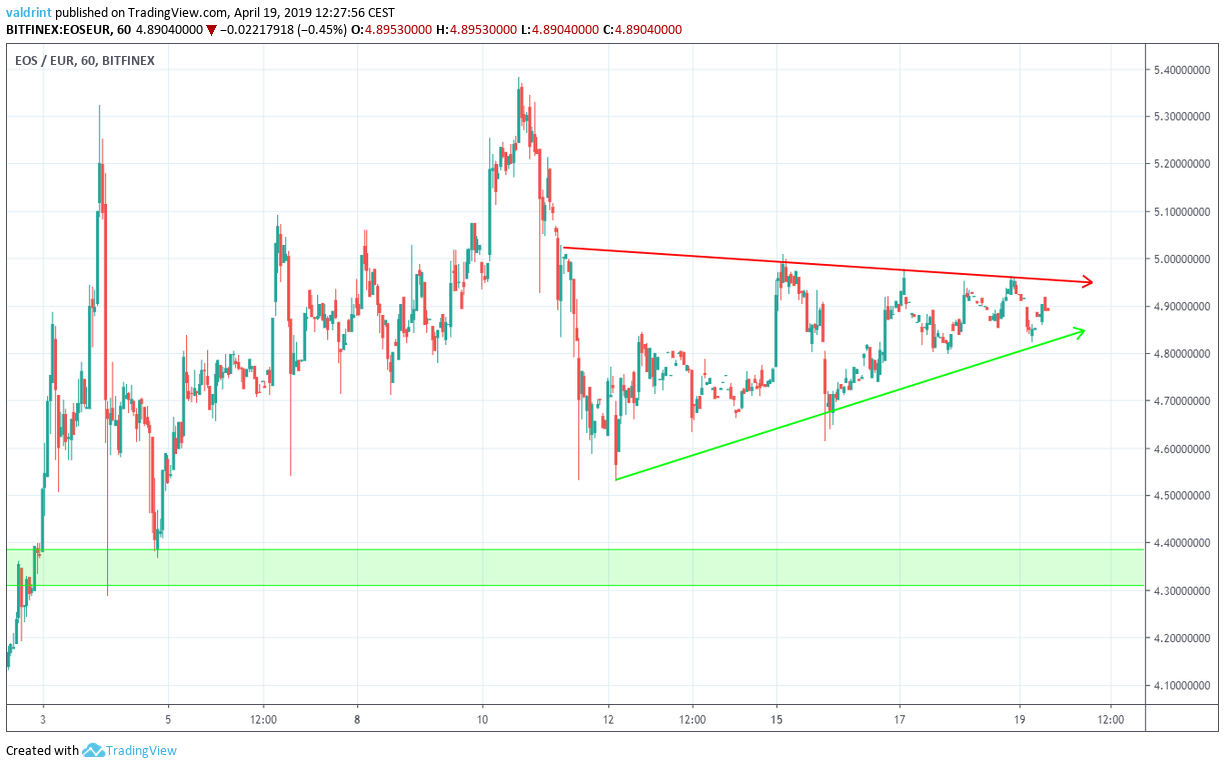
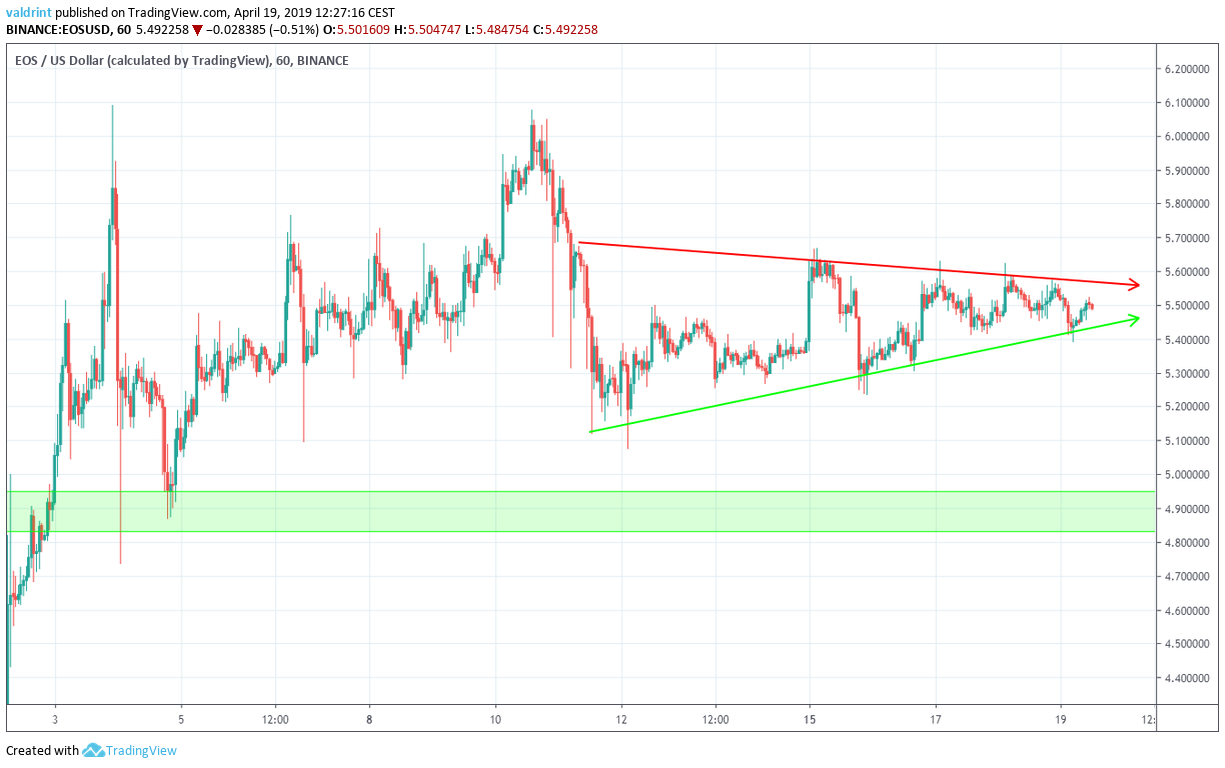
The closest support area is found near $4.9 and €4.35. If the price breaks down from the symmetrical triangle, it is likely that it will reach this area.

Summary of Analysis

Based on our analysis, it is likely that the price of EOS will keep trading inside the confines of the triangle until a breakdown occurs. Do you think the price of EOS will break down from the triangle? Let us know your thoughts in the comments below! For 2019 and 2020 EOS price predictions, click on the green button below:

2019/2020 EOS/USD PREDICTIONS

Disclaimer: This article is not trading advice and should not be construed as such. Always consult a trained financial professional before investing in cryptocurrencies, as the market is particularly volatile.
Top crypto projects in the US | April 2024

Trusted

Disclaimer

In line with the Trust Project guidelines, this price analysis article is for informational purposes only and should not be considered financial or investment advice. BeInCrypto is committed to accurate, unbiased reporting, but market conditions are subject to change without notice. Always conduct your own research and consult with a professional before making any financial decisions. Please note that our Terms and ConditionsPrivacy Policy, and Disclaimers have been updated.

Valdrin-Tahiri.jpg
Valdrin Tahiri
Valdrin discovered cryptocurrencies while he was getting his MSc in Financial Markets from the Barcelona School of Economics. Shortly after graduating, he began writing for several different cryptocurrency related websites as a freelancer before eventually taking on the role of BeInCrypto's Senior Analyst. (I do not have a discord and will not contact you first there. Beware of scammers)
READ FULL BIO
Sponsored
Sponsored