


Axie Infinity (AXS) broke down from an ascending wedge but bounced at the $50 support area.
Enjin Coin (ENJ) is trading inside an ascending parallel channel.
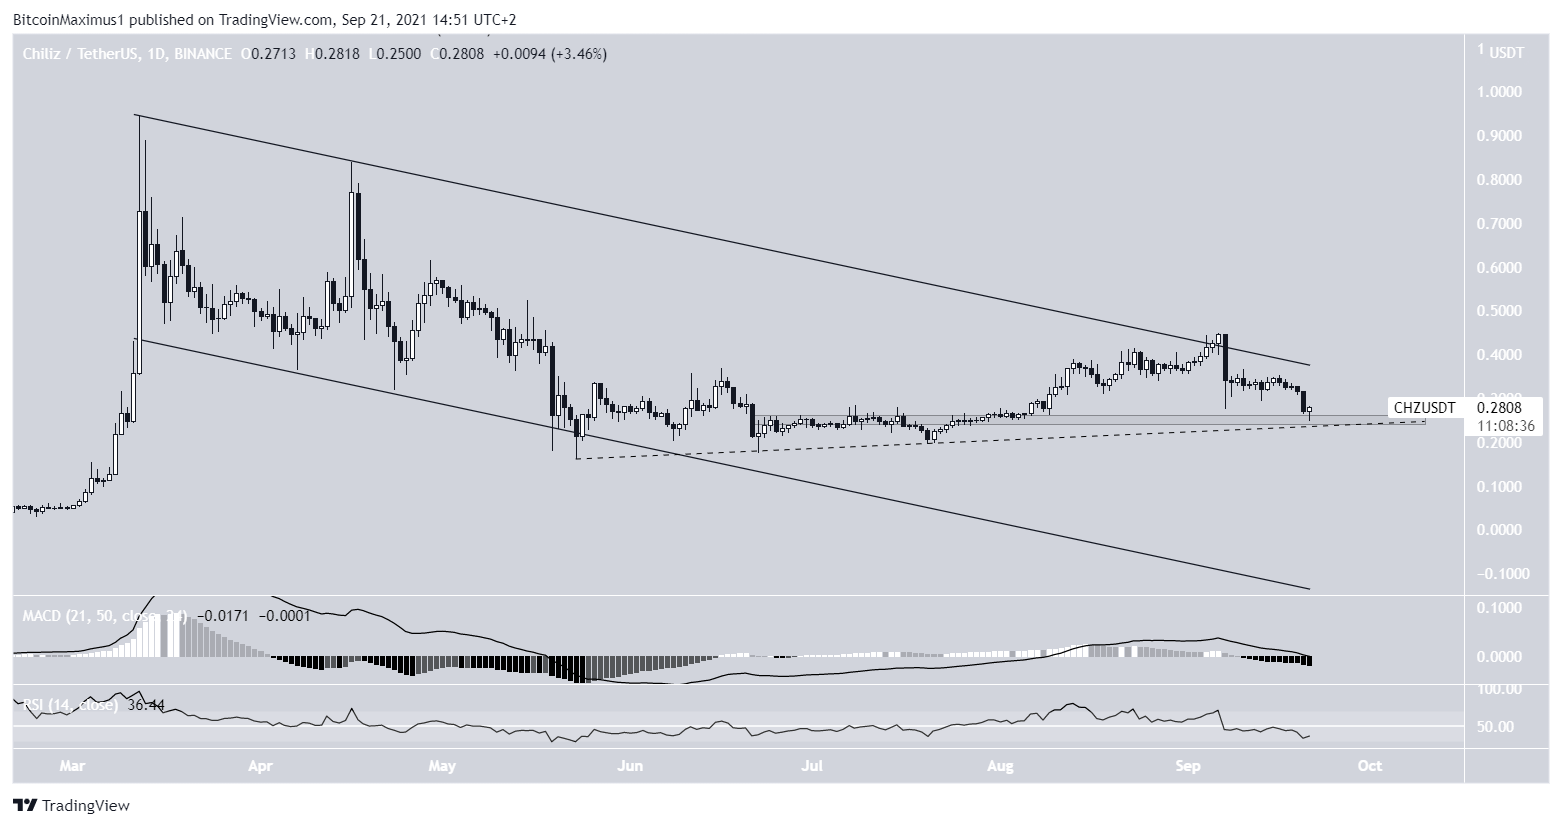
Chiliz (CHZ) is following an ascending support line and is trading above the $0.25 horizontal support area.
AXS
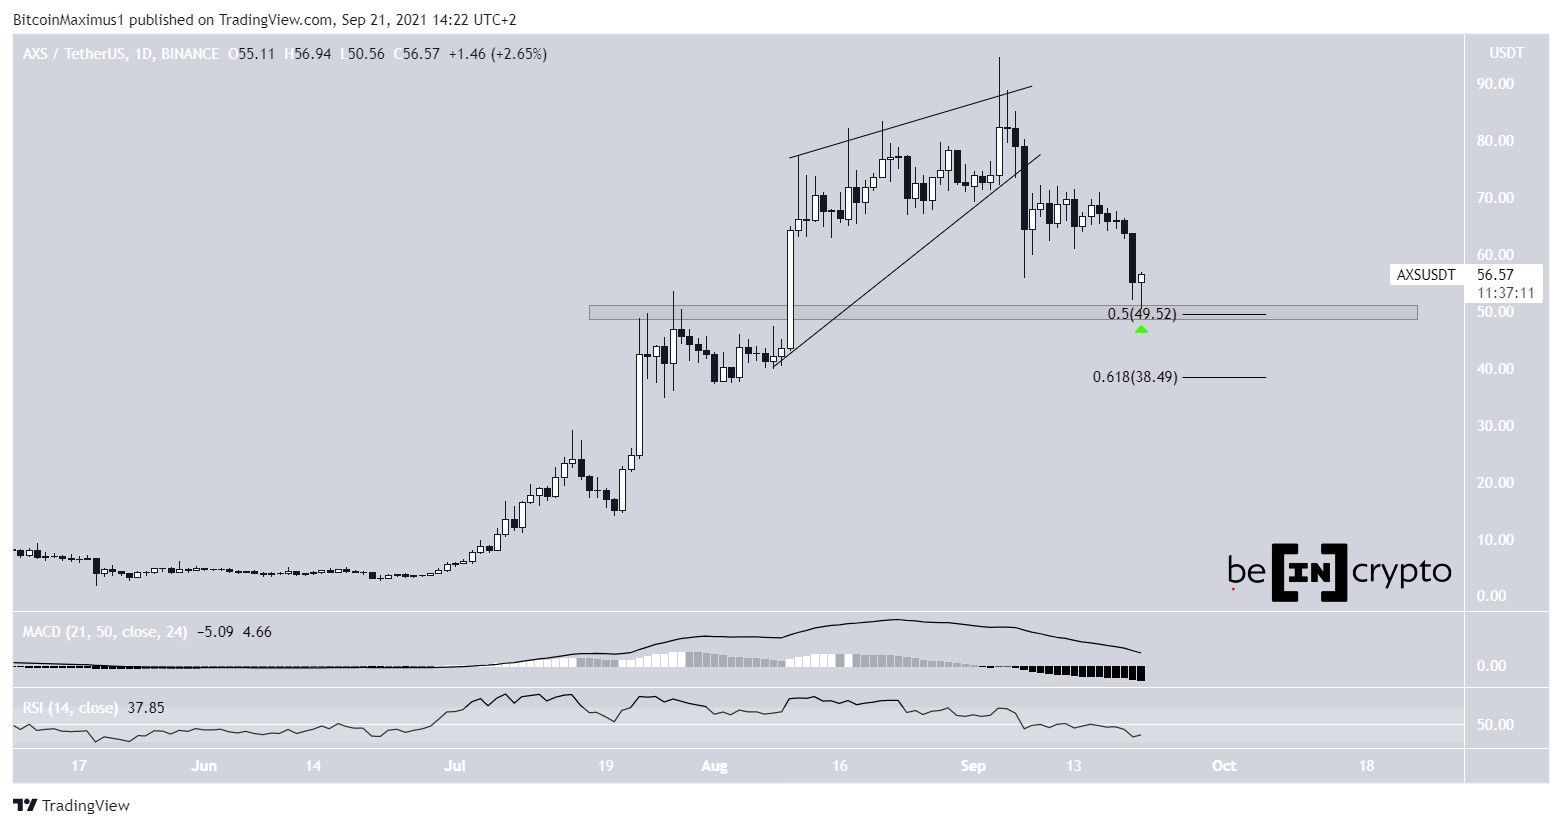
AXS has been falling since Sept 4, when it reached an all-time high of $94.67. The same day, it created a long upper wick and a shooting star candlestick.
Shortly afterwards, it broke down from an ascending wedge, and proceed to reach a low of $50.56 on Sept 21. It is in the process of creating a lower wick, validating the $50 area as support (green icon).
This is the 0.5 Fib retracement support level and a horizontal resistance area.
Despite the bounce, technical indicators are bearish. The MACD and RSI are both decreasing and the latter is below 50.
Therefore, it is not certain if the low has been reached or if AXS will break down further.
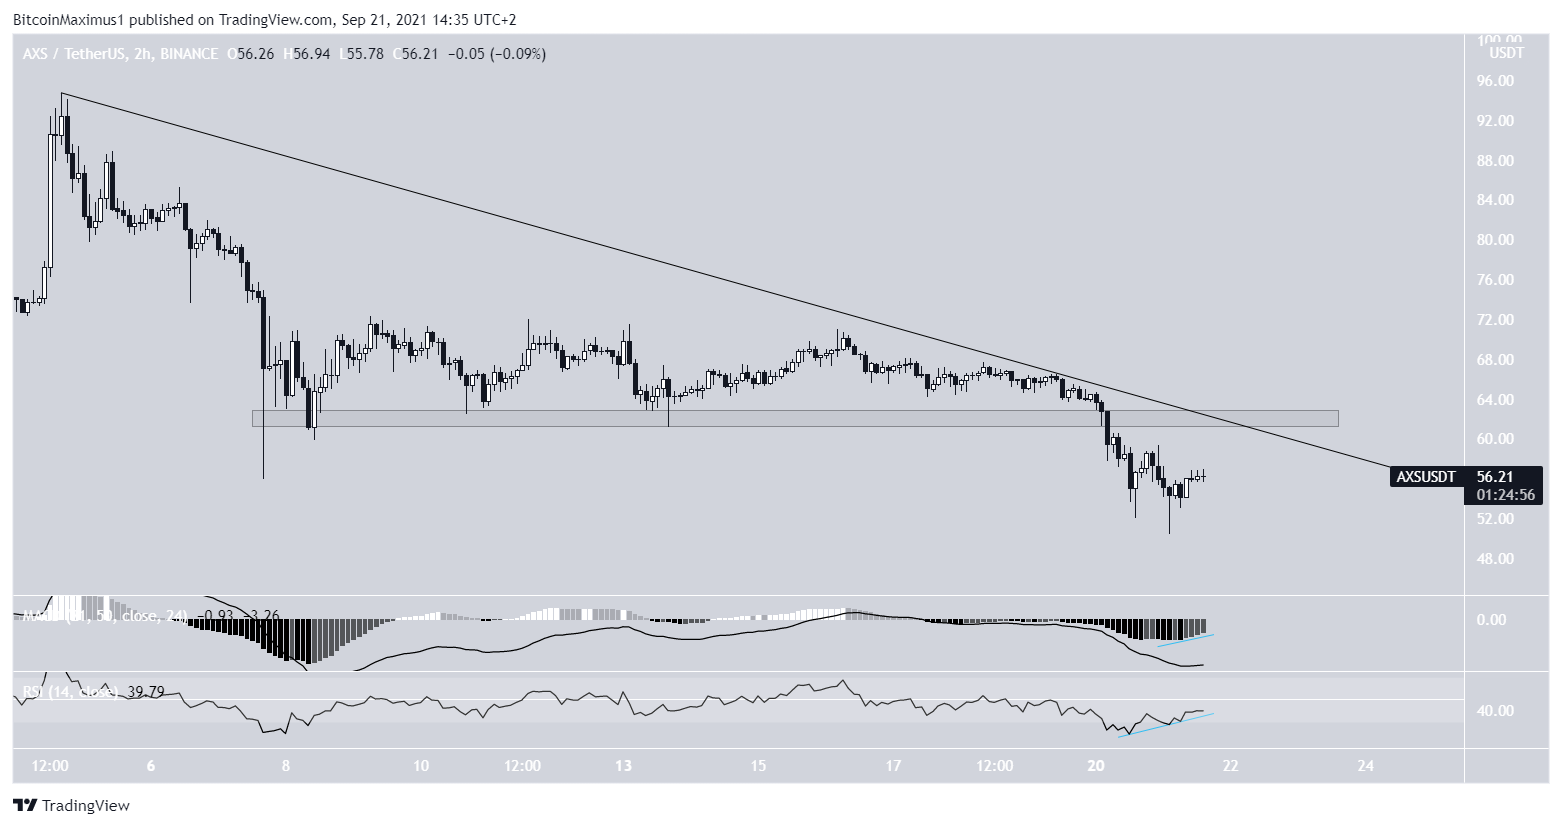
The shorter-term two-hour chart is more bullish, since it shows bullish divergences in both the RSI and MACD.
When combined with the two long lower wicks, it indicates that a bounce is likely.
However, there is a very significant resistance at $62.50, both a horizontal resistance area and a descending resistance line.
Until AXS managed to break it, the short-term trend cannot be considered bullish.
If the token is successful in moving above this level, it would go a long way in suggesting that the ongoing decrease is corrective and new highs will follow afterwards.
Highlights
- AXS broke down from an ascending wedge
- There is support and resistance at $52 and $62.5, respectively.
ENJ
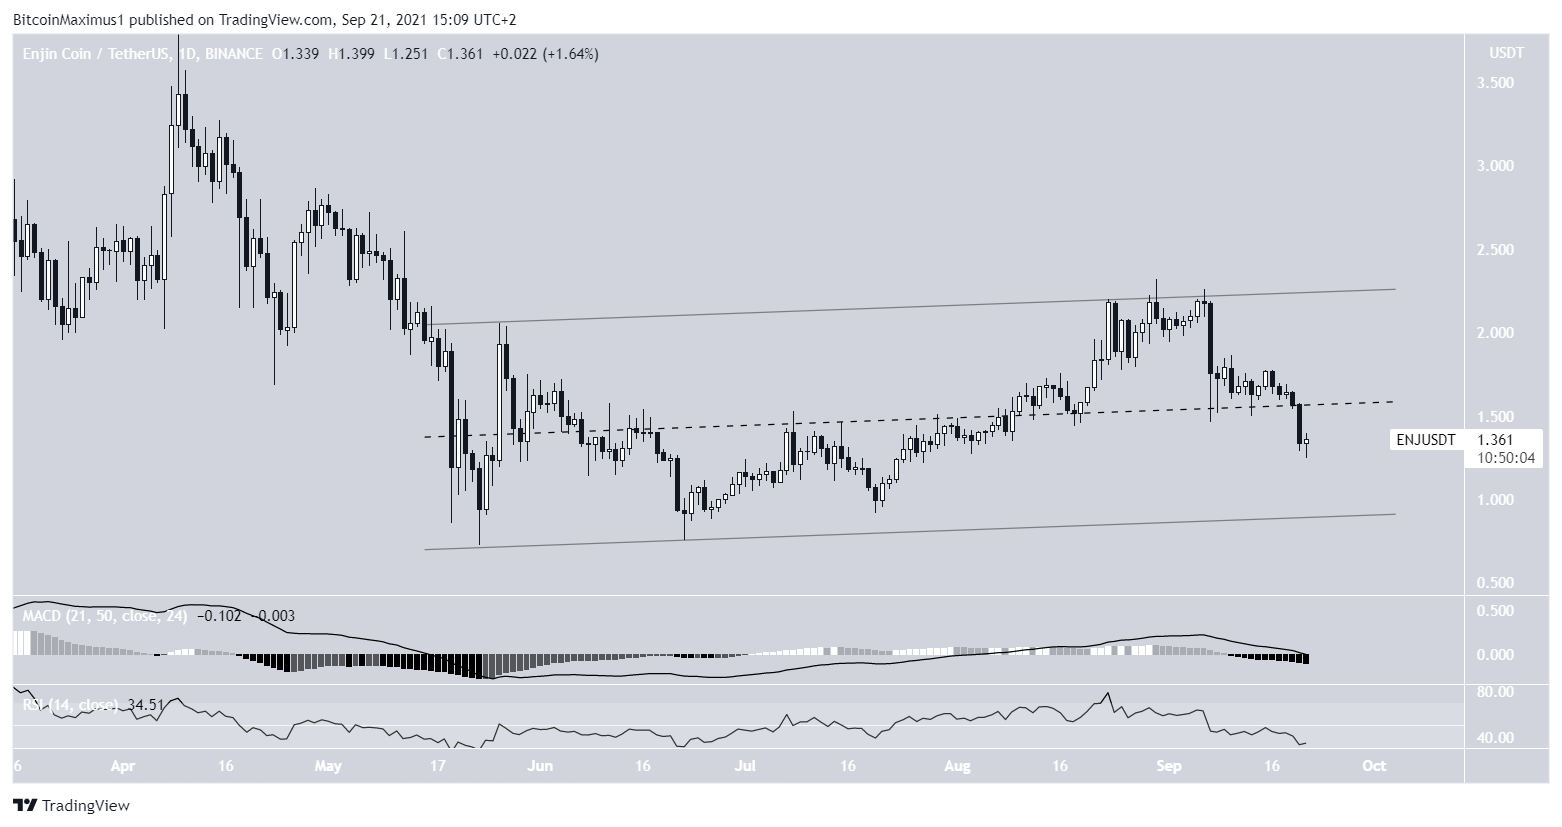
ENJ has been trading inside an ascending parallel channel since reaching a low on May 23. Such channels often contain corrective structures.
On Aug 30, the token was rejected by the resistance line of the channel and has been moving downwards since.
On Sept 21, it reached a low of $1.25 and is currently trading in the lower portion of the channel.
Technical indicators in the daily time-frame are bearish, since both the RSI and MACD are falling.
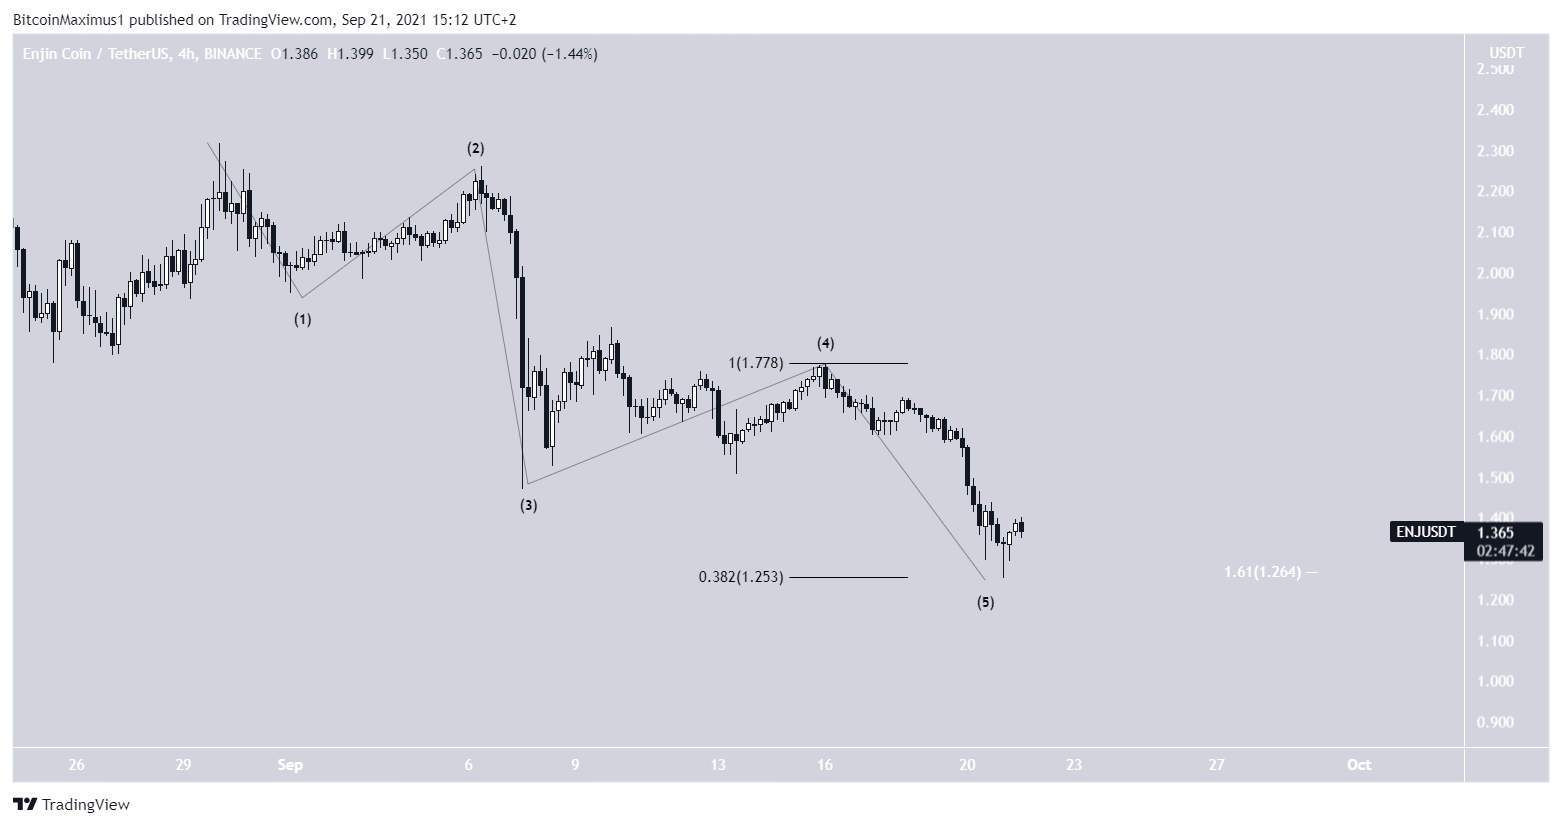
The shorter-term two-hour chart shows a completed five wave bearish impulse.
The current low coincides with two Fib targets, that of the 0.618 length of waves 1-3 (black) and the 1.61 external Fib retracement of wave four (white).
Therefore, at least of a short-term bounce is expected.
Whether ENJ manages to hold on above the middle of the channel will likely determine the direction of the future movement.
Highlights
- ENJ is trading inside an ascending parallel channel.
- It has completed a short-term bearish impulse.
CHZ
CHZ has been decreasing alongside a descending parallel channel since reaching an all-time high price of $0.945 on March 12. Such channels usually contain corrective structures, which eventually lead to breakouts.
The decrease culminated with a low of $0.164 on May 23. CHZ has been increasing alongside an ascending support line (dashed) since.
On Sept 6, the token initially broke out from the parallel channel. However, it quickly fell back inside the resistance line, rendering the alleged breakout as only a deviation.
Technical indicators are bearish, since both the RSI and MACD are falling.
However, CHZ is trading above a confluence of support levels, created by the $0.25 horizontal support area and the ascending support line. If it manages to hold on above this level, the possibility of a breakout still remains valid.
Highlights
- CHZ is trading inside a descending parallel channel.
- There is strong support at $0.25.
For BeInCrypto’s latest Bitcoin (BTC) analysis, click here.
What do you think about this subject? Write to us and tell us!


