Enjin Coin (ENJ) has fallen below a crucial horizontal area, which is now expected to act as resistance. Until the area is reclaimed, the trend cannot be considered bullish.
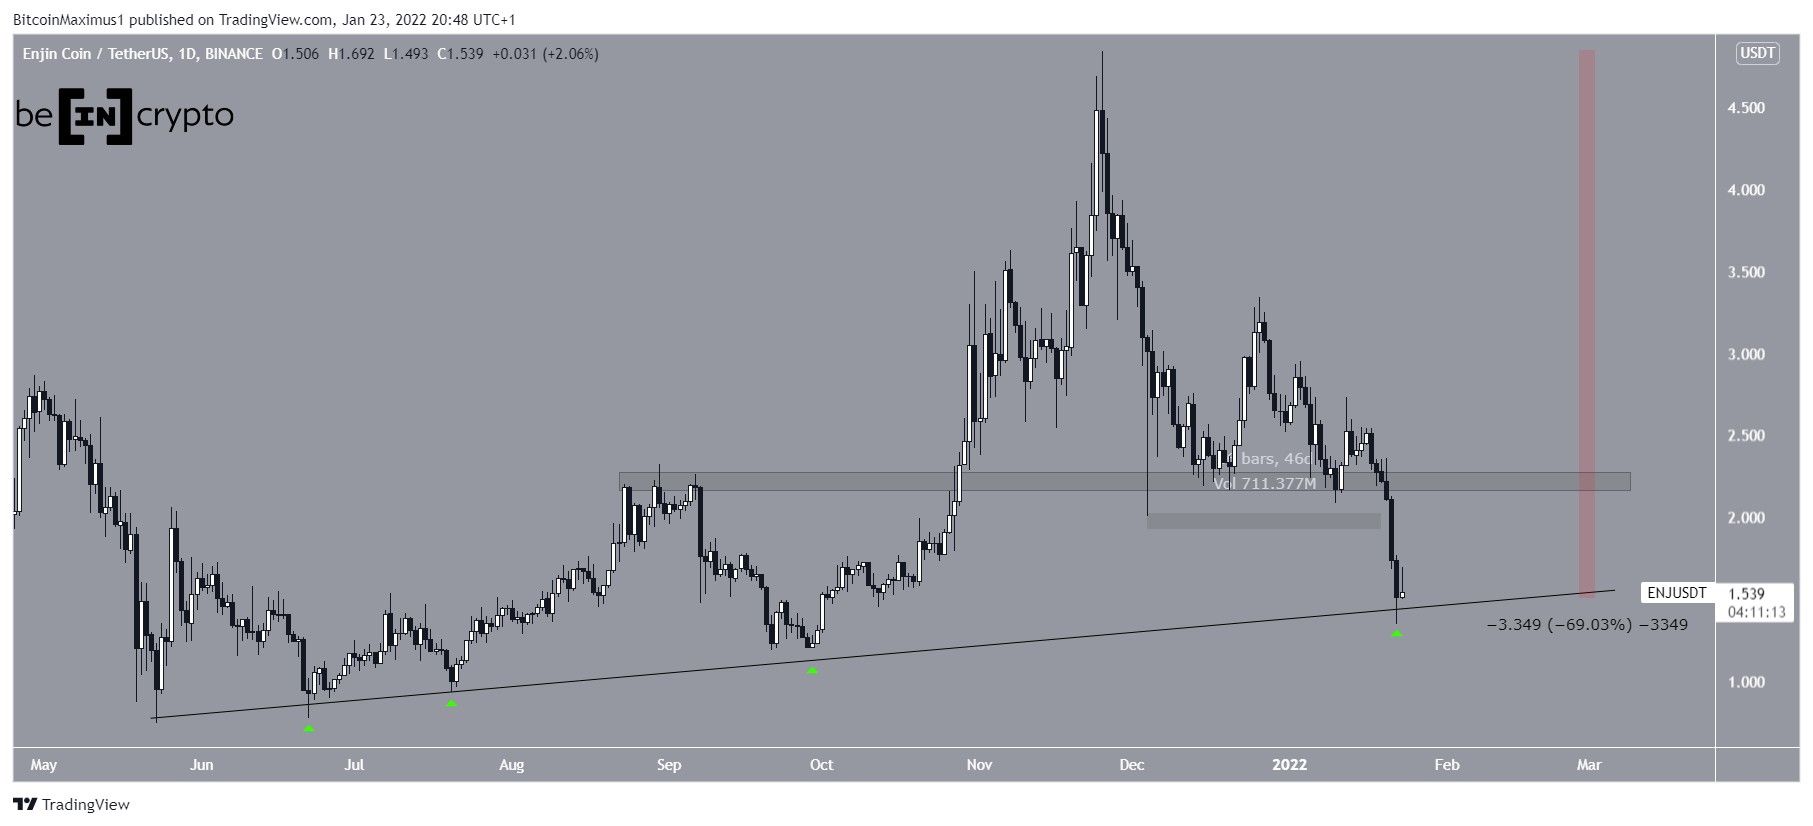
Enjin Coin has been decreasing since Nov 25 after it reached an all-time high price of $4.84. The downward move was initially halted on Dec 4 when ENJ bounced at the $2.22 horizontal support area, creating a long lower wick in the process.
ENJ managed to stay above this level for 46 days before finally breaking down on Jan 20. Up to this point, ENJ has decreased by 69% since the all-time high.
It has bounced at an ascending support line that has been in place since May. This was the fourth time that the line was validated (green icons) as support. Since it’s a long-term structure, ENJ could likely rebound from the line again.
If this occurs, the $2.22 area would be expected to act as resistance.
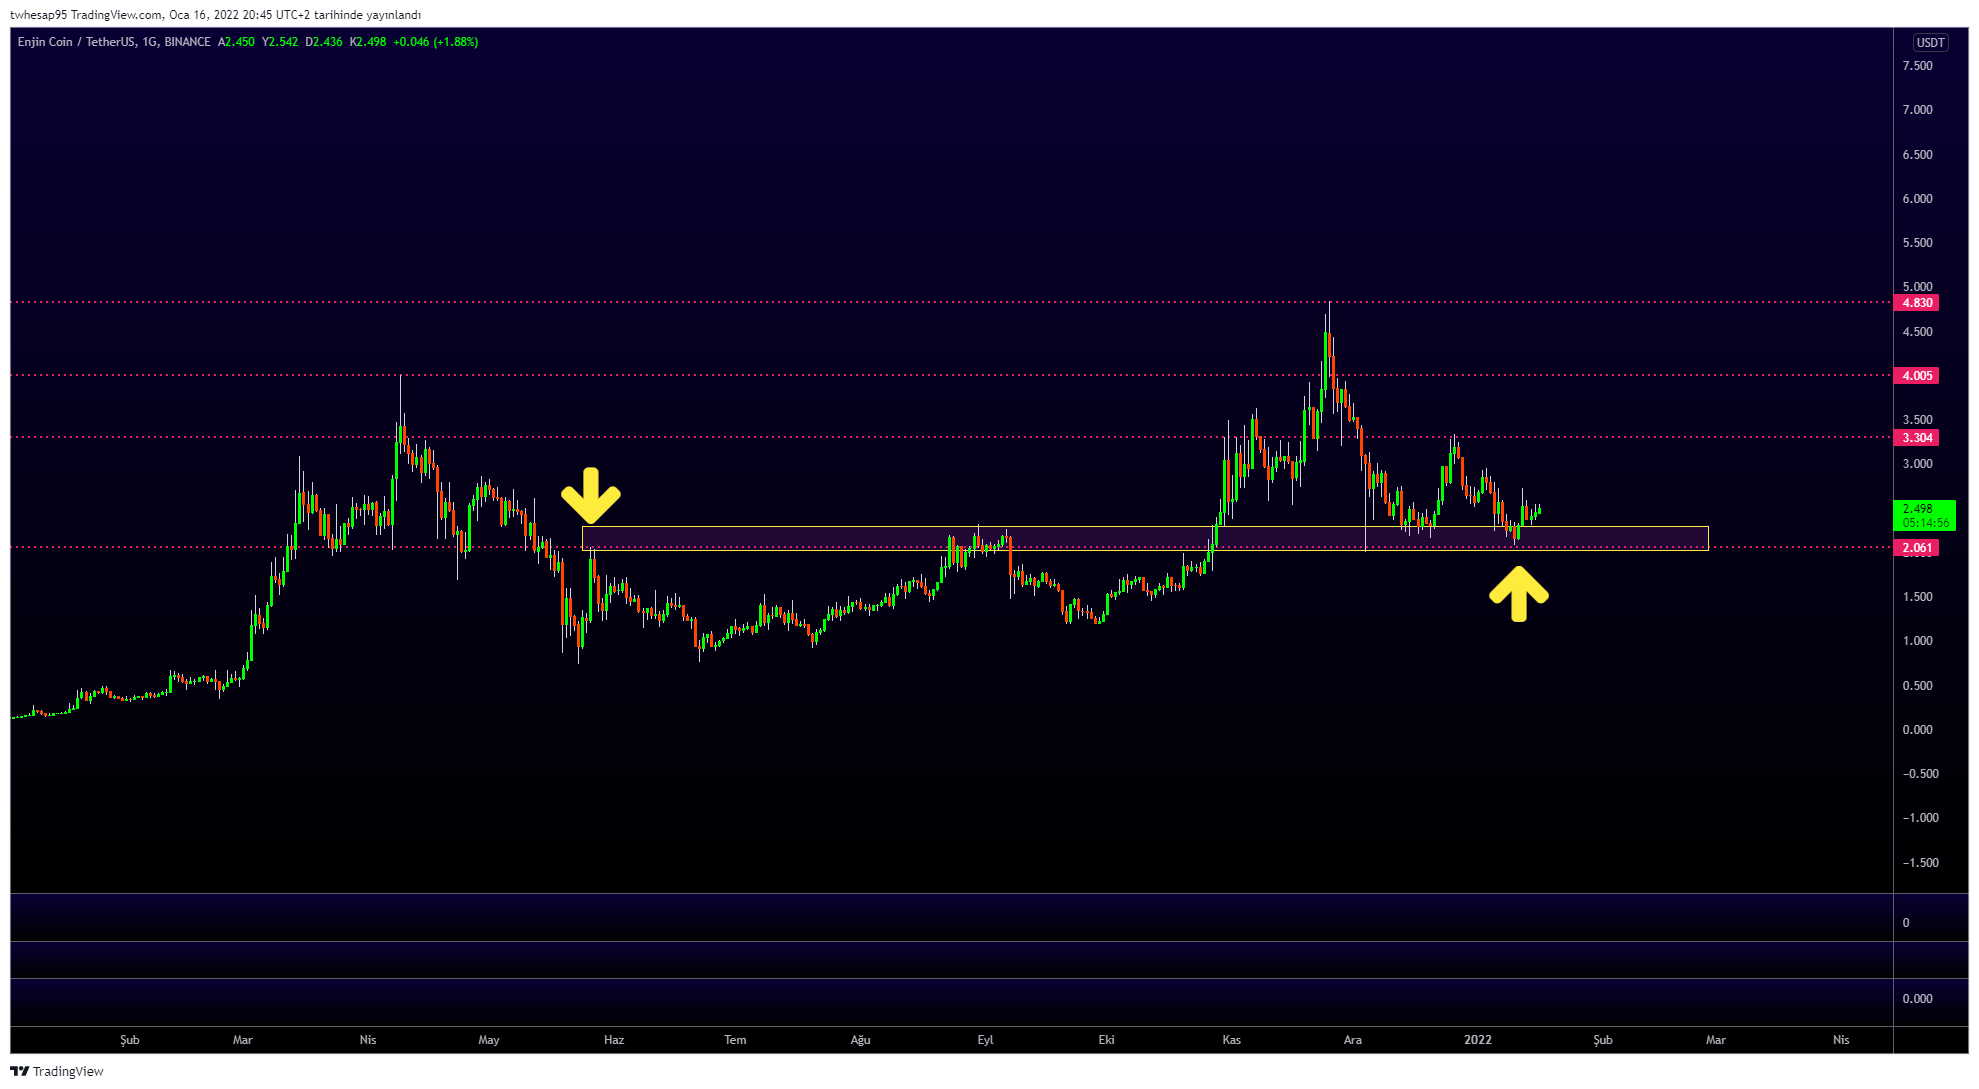
Cryptocurrency trader @pippen_tr tweeted an ENJ chart, stating that the trend can still be considered bullish as long as it’s trading above the $2 horizontal level. Since the tweet, ENJ has broken down from this area.
Future movement
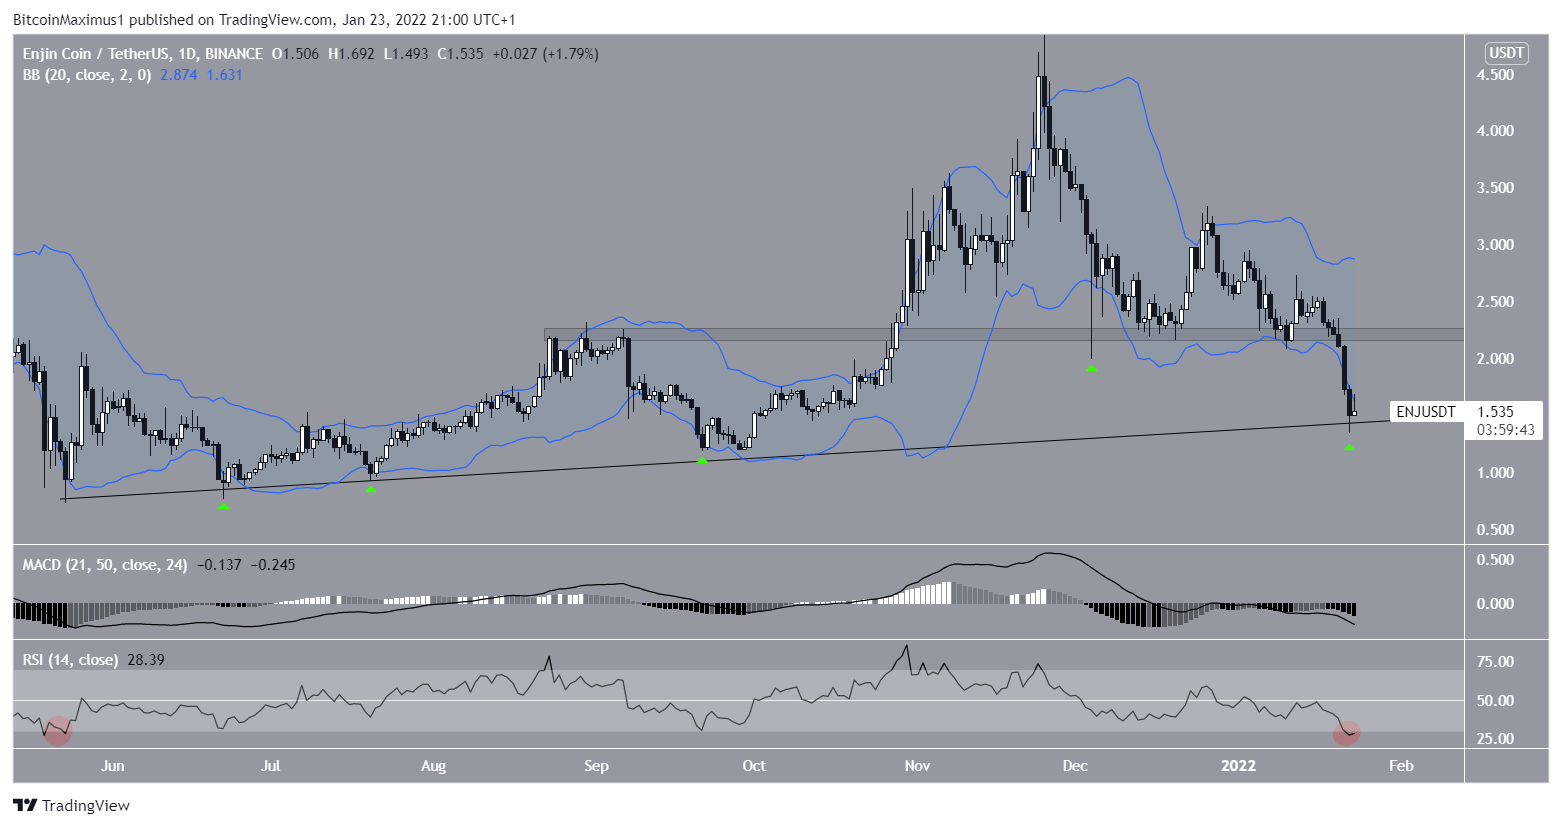
Technical indicators in the daily time frame suggest that the price is oversold. At first glance, this can be seen by observing the Bollinger Bands, which use a standard deviation in order to determine whenever the price deviates above/below its usual range.
Currently, ENJ has fallen below the lower portion of the indicator. Each time this occurred in the past, a significant bounce followed after (green icons).
Furthermore, the RSI is oversold, showing a reading of 29. The RSI is a momentum indicator and readings below 30 are considered oversold. The previous time the RSI fell below this threshold was in May 2021, preceding the entire upward move to the all-time high price.
However, both the RSI and MACD are decreasing, suggesting that momentum is still bearish.
Therefore, while the significant drop has caused the market to create oversold conditions, there are no bullish reversal signs in place yet.
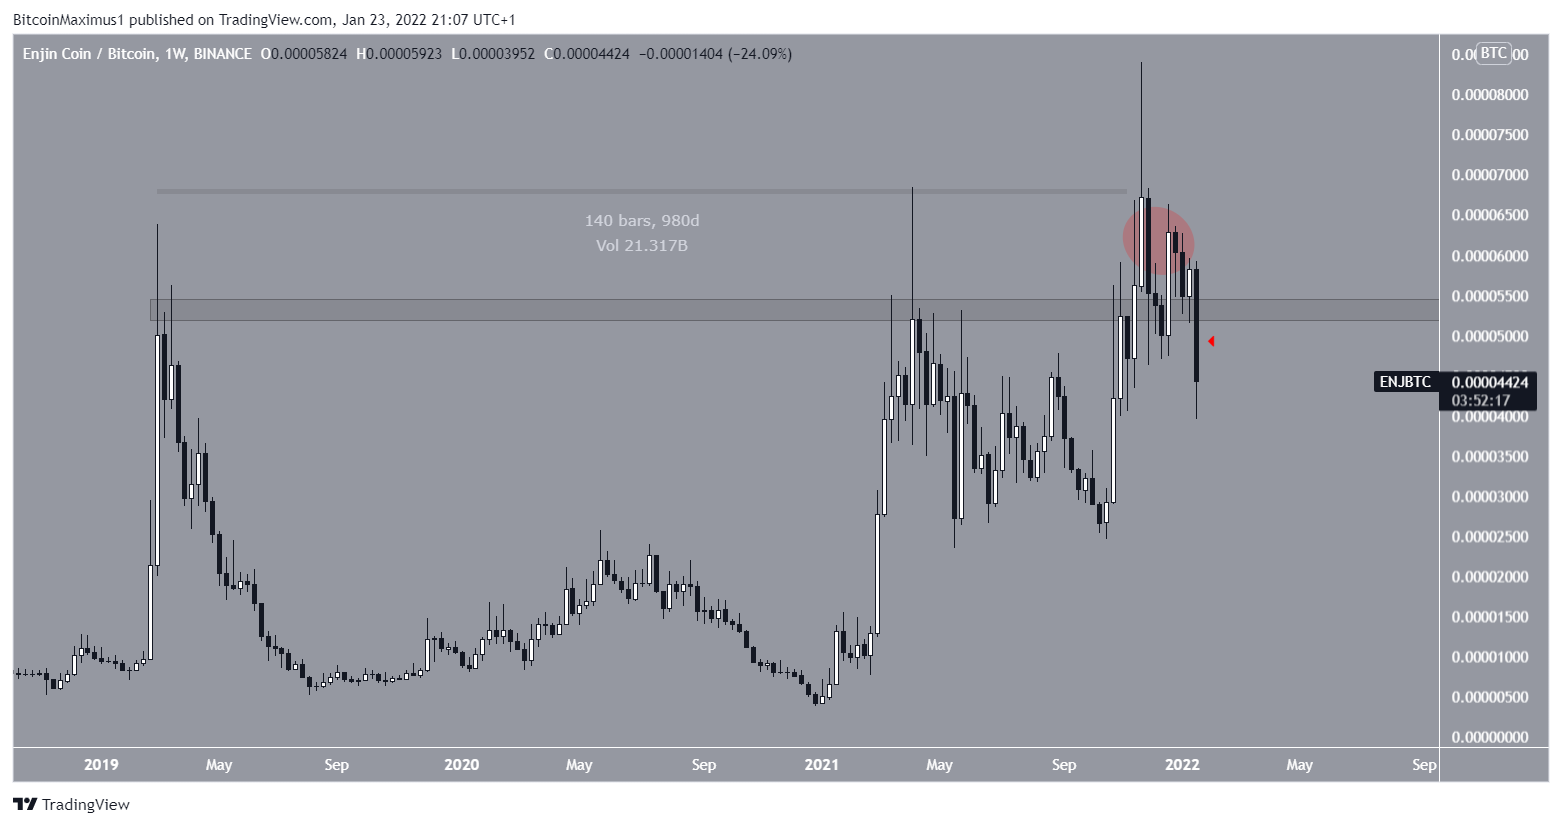
ENJ/BTC
The ENJ/BTC chart also provides a bearish outlook. The pair had been facing resistance from the 5,350 satoshi area since January 2019. After 980 days, ENJ finally broke out and reached a high of 8,413 satoshis on Nov 25.
At the time, this seemed like a decisive breakout above a long-term resistance area.
However, the upward move could not be sustained and ENJ fell back below that resistance on Jan 19.
Therefore, the previous breakout is now considered a deviation (red circle). Until ENJ manages to reclaim the 5,350 satoshi area, the trend cannot be considered bullish.