The Enjin Coin (ENJ) price reached a new all-time high price on March 15 before decreasing slightly.
Monero (XMR) is trading right below long- and short-term resistance. Readings from technical indicators are mixed.
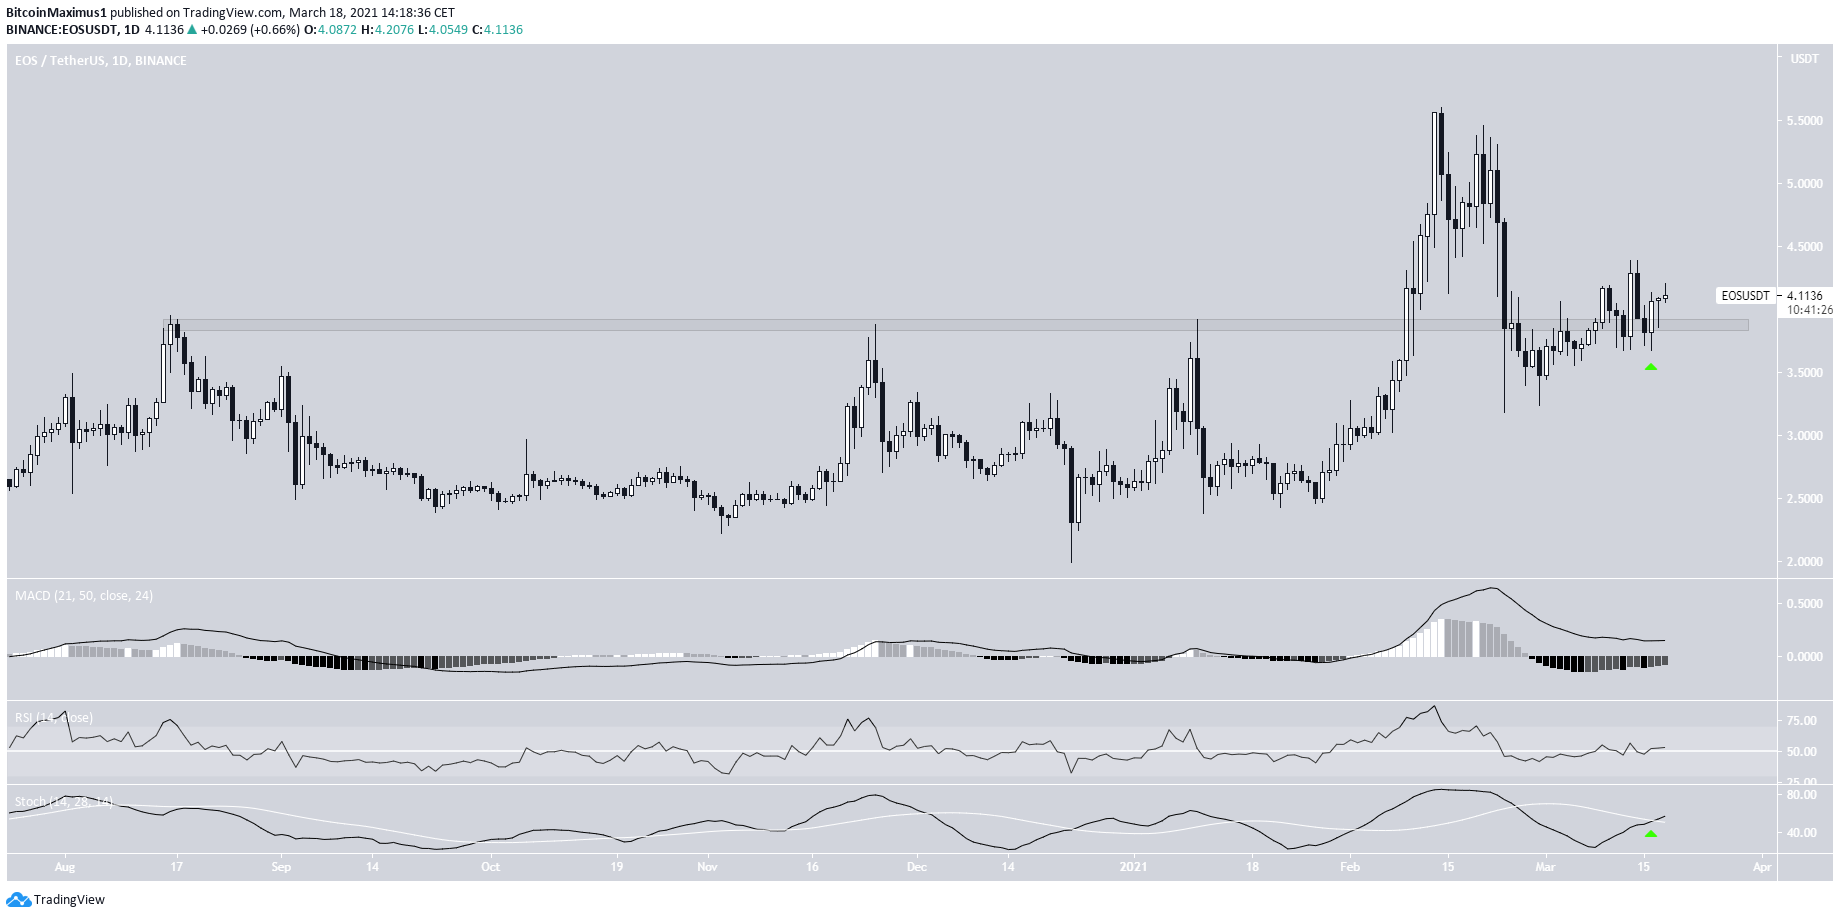
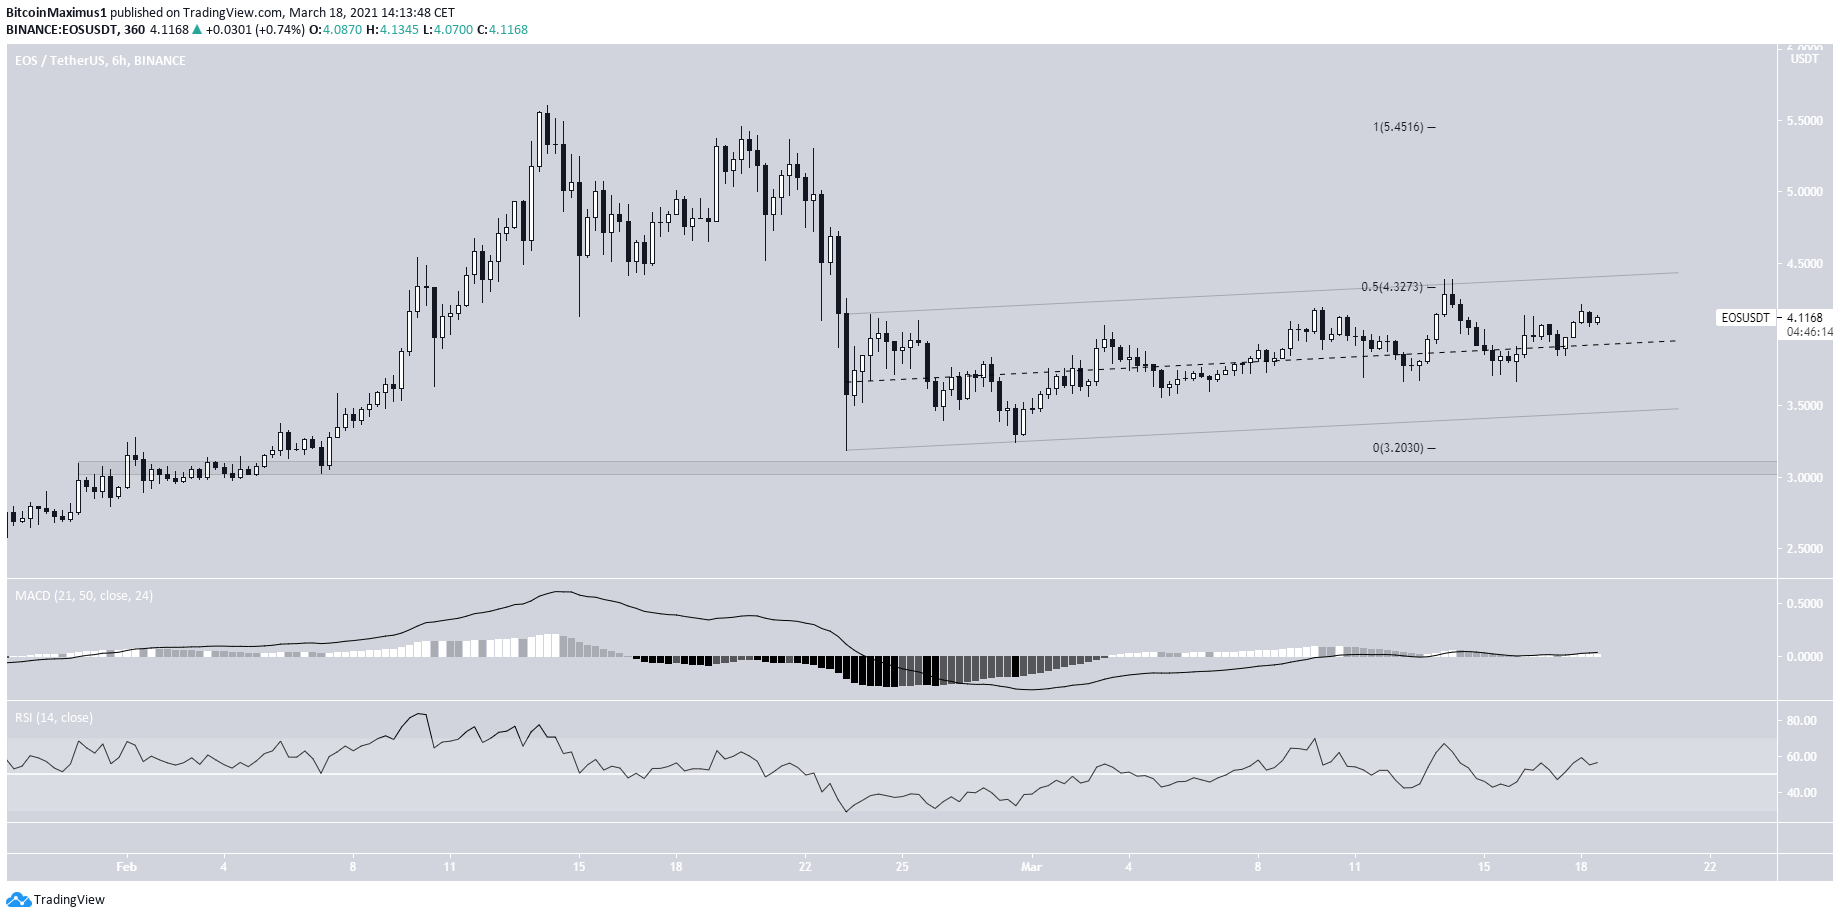
EOS (EOS) has reclaimed the $3.90 support area but is trading inside a parallel ascending channel.
Enjin Coin (ENJ)
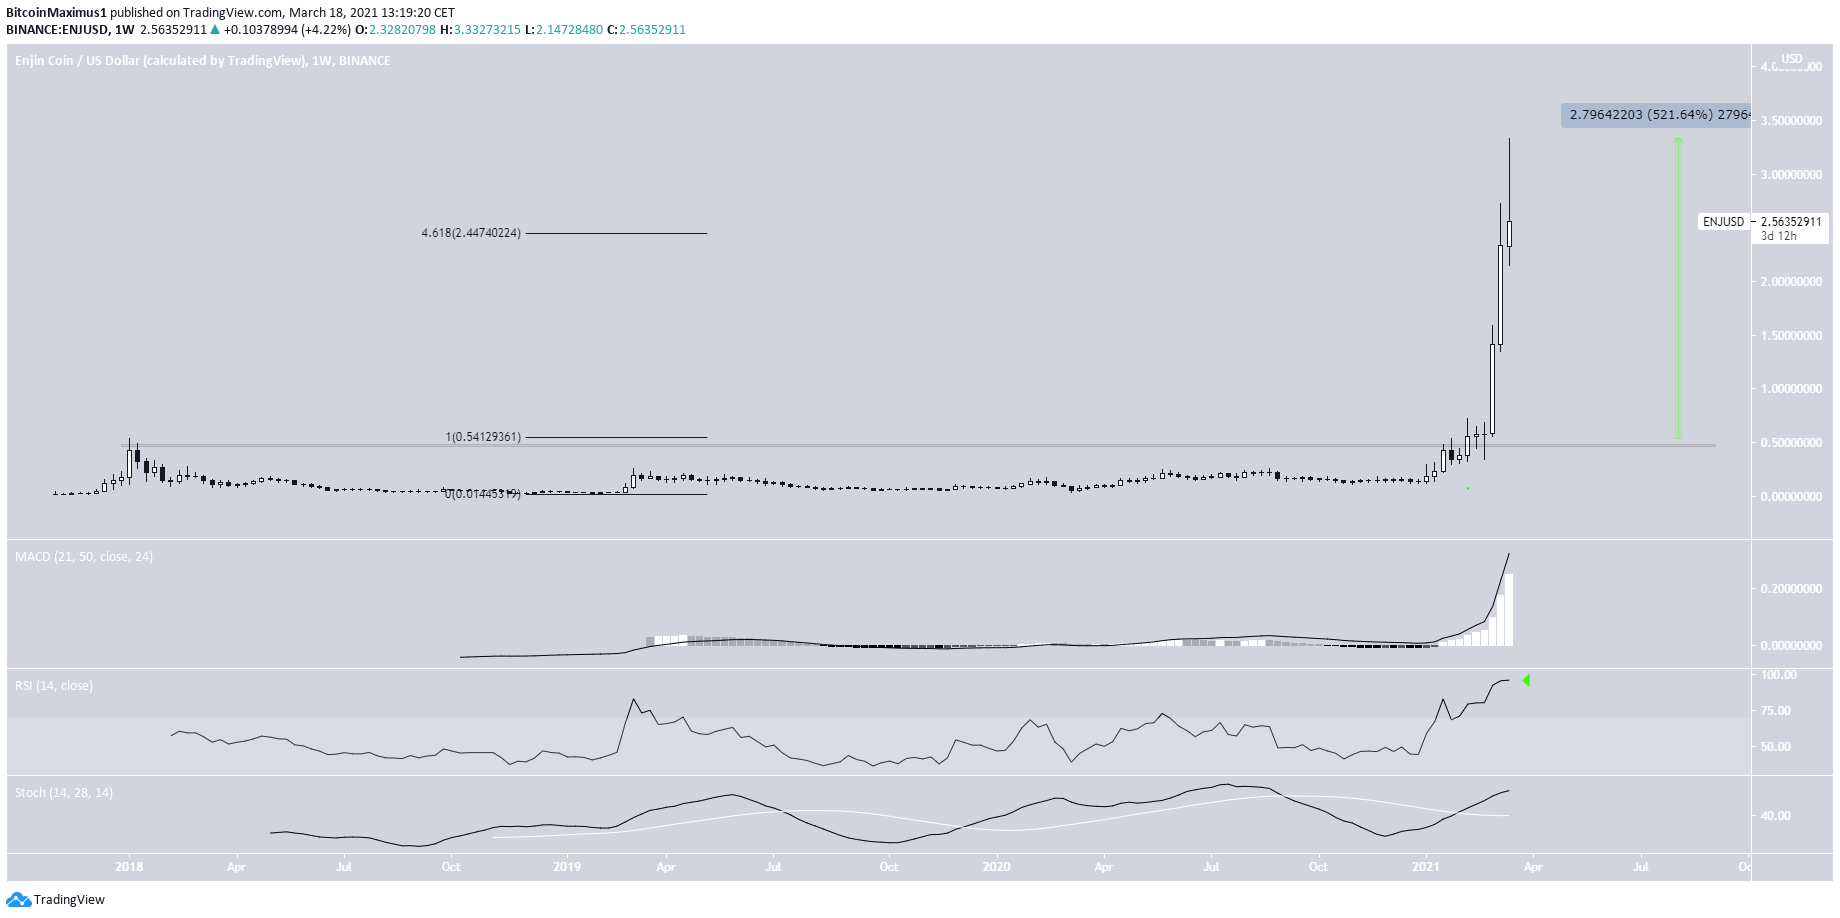
ENJ has been increasing parabolically since initially breaking out and reaching a new all-time high price at the beginning of February.
Since then, it has increased by a massive 523%. This led to a new all-time high price of $3.08. ENJ reached the high on March 15.
Despite being bullish, technical indicators show an extremely overextended rally. The weekly RSI value of 95 is the highest ever recorded.
Also, ENJ has already moved above the 4.618 external Fib retracement level at $2.44.
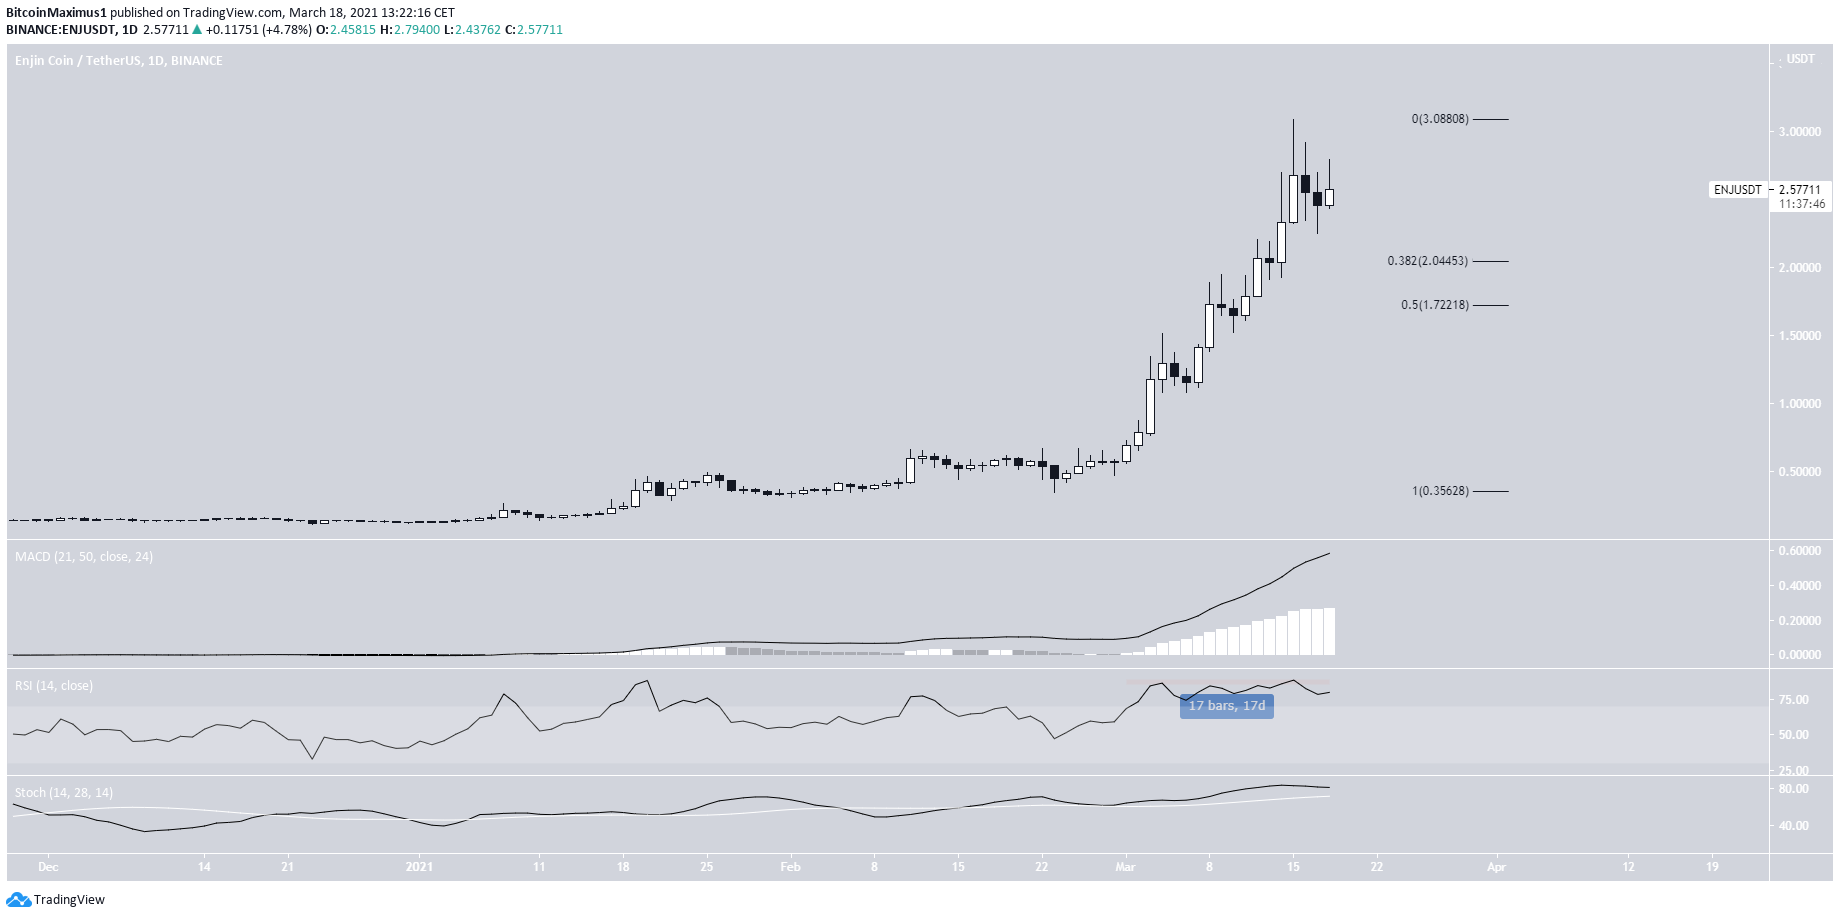
The daily chart shows a similarly overextended rally. The RSI has been overbought for a full 17 days.
If ENJ begins to decrease, the closest support levels are found at $2.05 and $1.72.
Highlights
- ENJ reached an all-time high price on March 15.
- There is support at $2.05 and $1.72.
Monero (XMR)
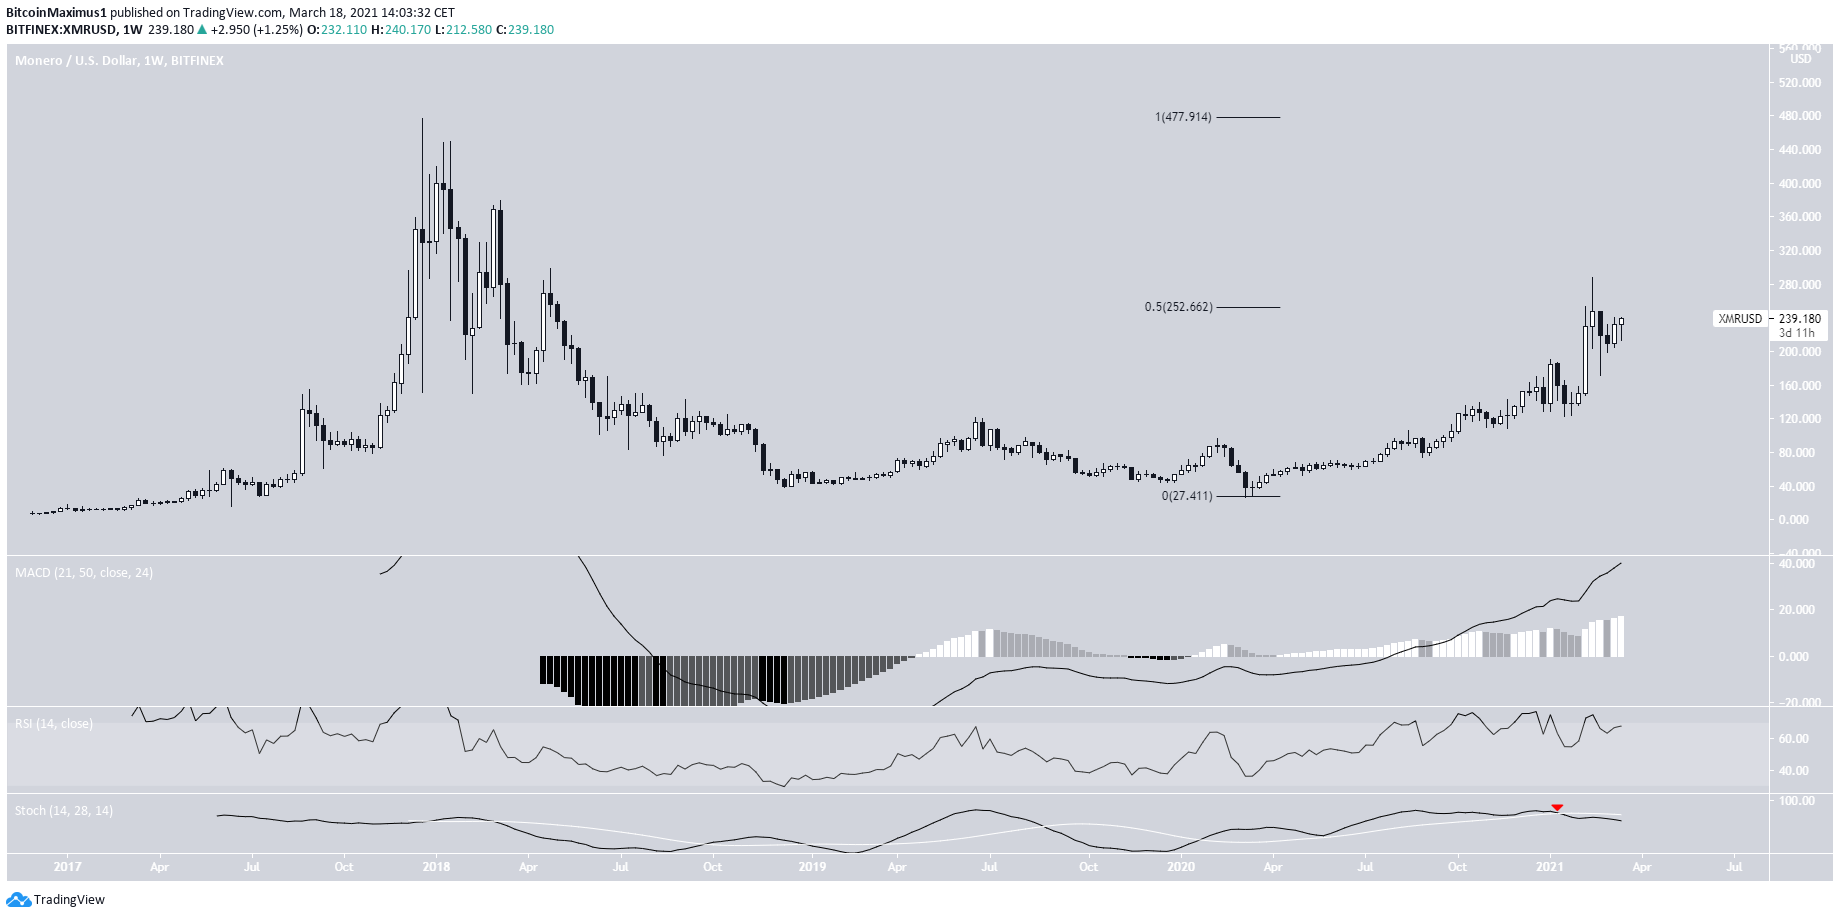
On Feb. 20, XMR reached a high of $287 but has been decreasing since. The rejection occurred right at the 0.5 Fib retracement of the entire previous downward movement.
The reading from technical indicators is mixed. The MACD is increasing, but the RSI is decreasing. The Stochastic oscillator has made a bearish cross.
Therefore, until XMR manages to rr the $252 resistance area, we cannot consider the trend bullish.
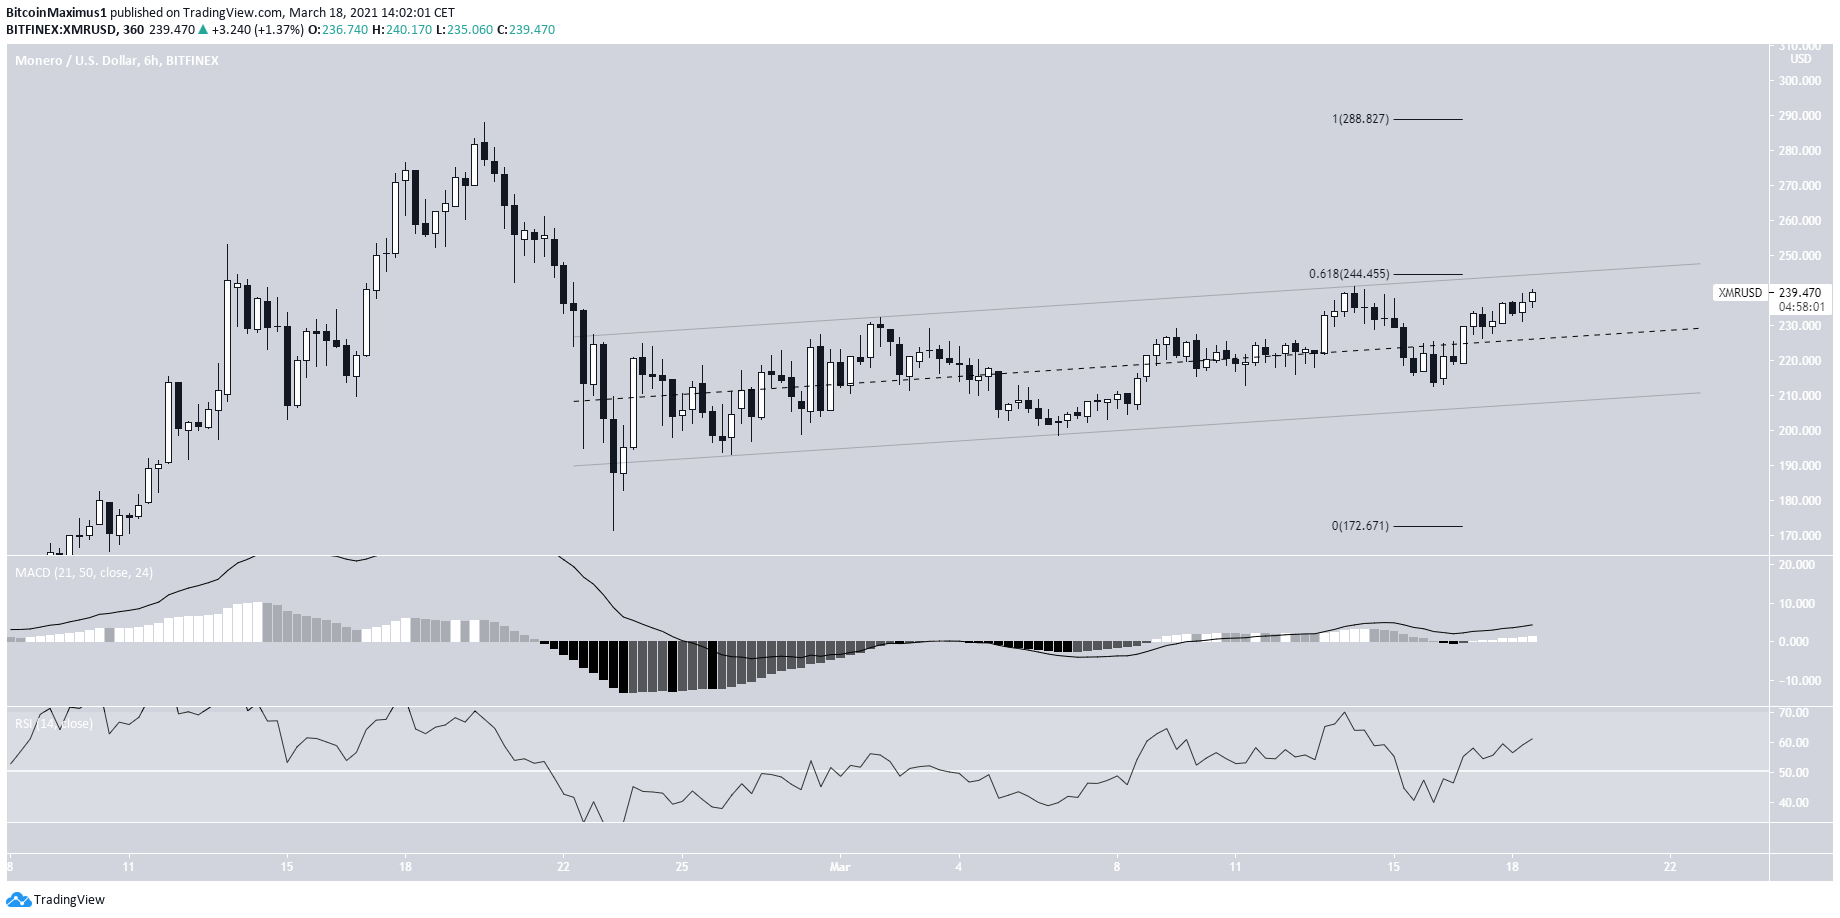
The shorter-term chart shows that XMR is trading inside a parallel ascending channel. This is often a corrective movement. In addition, XMR is facing resistance at $245.
Therefore, despite the RSI & MACD being bullish, we cannot consider the trend bullish until XMR breaks out from this channel and resistance.
Highlights
- XMR is trading inside an ascending parallel channel.
- There is resistance at $245.
EOS (EOS)
After deviating considerably below the $3.90 support area, EOS has been increasing since Feb. 23.
It has now reclaimed this area, and potentially validated it as support.
Technical indicators are leaning on bullish. The MACD has given a bullish reversal sign, and the Stochastic oscillator has made a bullish cross.
However, the shorter-term six-hour chart is not as bullish.
EOS is also trading inside a parallel ascending channel. The resistance line of the channel coincides with the $4.30 resistance area.
Until EOS manages to clear it, we cannot consider the trend bullish.
Unlike XMR, in which the MACD & RSI are bullish, they are relatively neutral for EOS.
If a breakdown occurs, the closest support area would be found at $3.05.
Highlights
- EOS is trading inside an ascending parallel channel.
- It is trading above support at $3.90
For BeInCrypto’s latest Bitcoin (BTC) analysis, click here.
Disclaimer
In adherence to the Trust Project guidelines, BeInCrypto is committed to unbiased, transparent reporting. This news article aims to provide accurate, timely information. However, readers are advised to verify facts independently and consult with a professional before making any decisions based on this content. Please note that our Terms and Conditions, Privacy Policy, and Disclaimers have been updated.


