


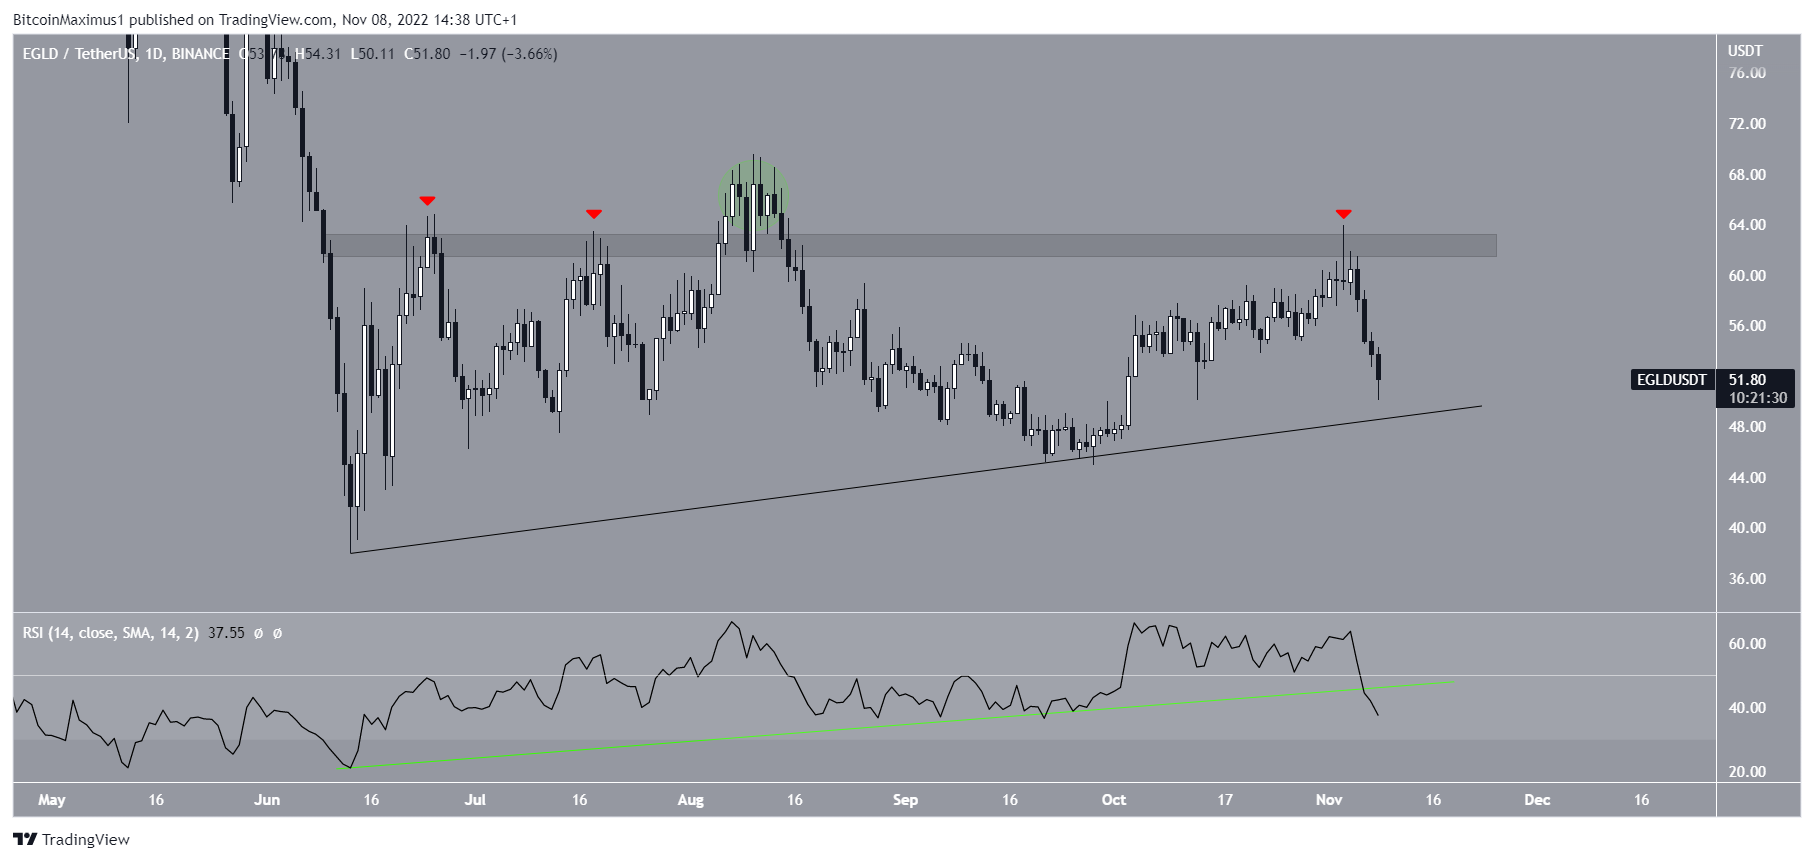
The Elrond (EGLD) price was rejected by a resistance area in place since June. A breakdown from the current ascending support line would accelerate the rate of decrease.
The EGLD price has been increasing alongside an ascending support line since June 13. Throughout this period, it faced resistance at $63.
After two unsuccessful breakout attempts (red icon), the Elrond price seemingly broke out successfully in the beginning of Aug (green circle).
However, the ensuing decrease rendered this breakout as only a deviation. The EGLD price validated the area as resistance on Nov. 3.
Besides the decrease, technical analysis indicators are also turning bearish. This is visible in the daily RSI decrease below 50 and breakdown from bullish divergence trend line (green line). Such breakdowns often precede similar decreases in price.
As a result, a breakdown from the ascending support line would give a bearish EGLD price prediction.
Elrond Price Prediction: Is Short-Term Breakout Beginning of Crash?
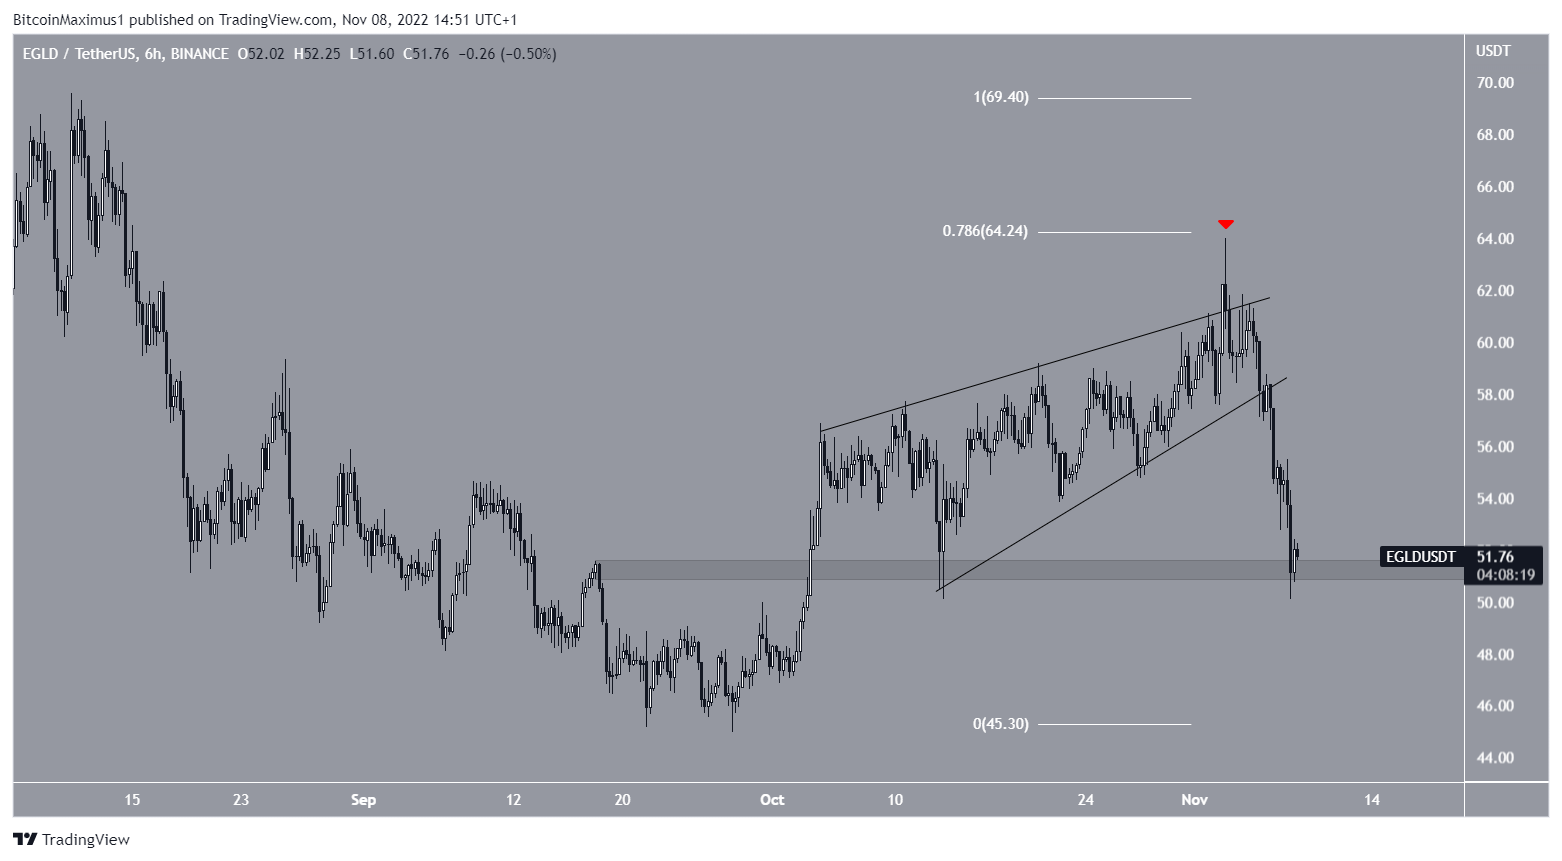
The six-hour time frame also provides a bearish outlook. The main reason is the breakdown from a short-term ascending wedge and rejection (red icon) from the 0.786 Fib retracement level (white).
Currently, the EGLD price is barely above the $51 horizontal support area. This is the final horizontal support level before the ascending support line. As a result, a breakdown below it could accelerate the rate of decrease.
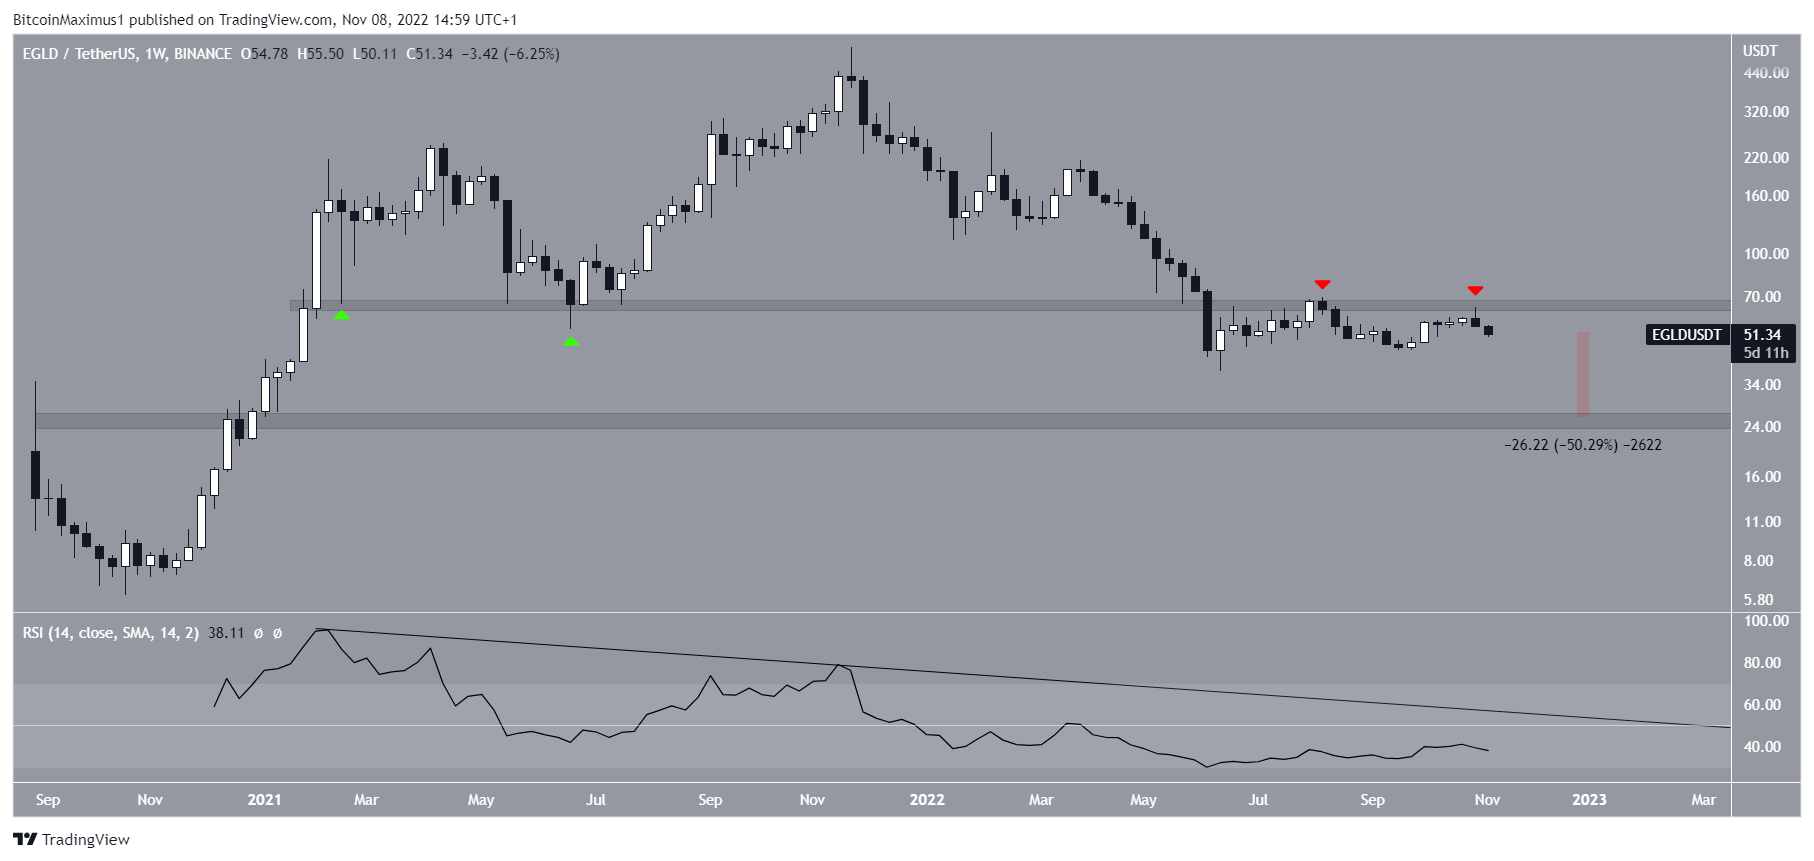
Long-Term Outlook Turning Bearish
Finally, the long-term weekly time frame can provide a potential outline for the future price. In it, EGLD has been rejected by the $66 area, which has intermittently acted as support (green icons) and resistance since 2021. The Elrond price prediction cannot be considered bullish until it reclaims it.
Moreover, the weekly RSI still follows a descending resistance line and is below 50. Both are considered bearish signs and support the continuation of the downward movement. If that occurs, the closest support area would be at $25. This amounts to a roughly 50% drop from the current price.
A weekly close above $66 would invalidate this bearish EGLD price prediction.
For BeInCrypto’s latest Bitcoin (BTC) analysis, click here.
Disclaimer: BeInCrypto strives to provide accurate and up-to-date information, but it will not be responsible for any missing facts or inaccurate information. You comply and understand that you should use any of this information at your own risk. Cryptocurrencies are highly volatile financial assets, so research and make your own financial decisions.
