


The Elrond (EGLD) price is increasing alongside an ascending support line and is ready to attempt breaking out above $62.50.
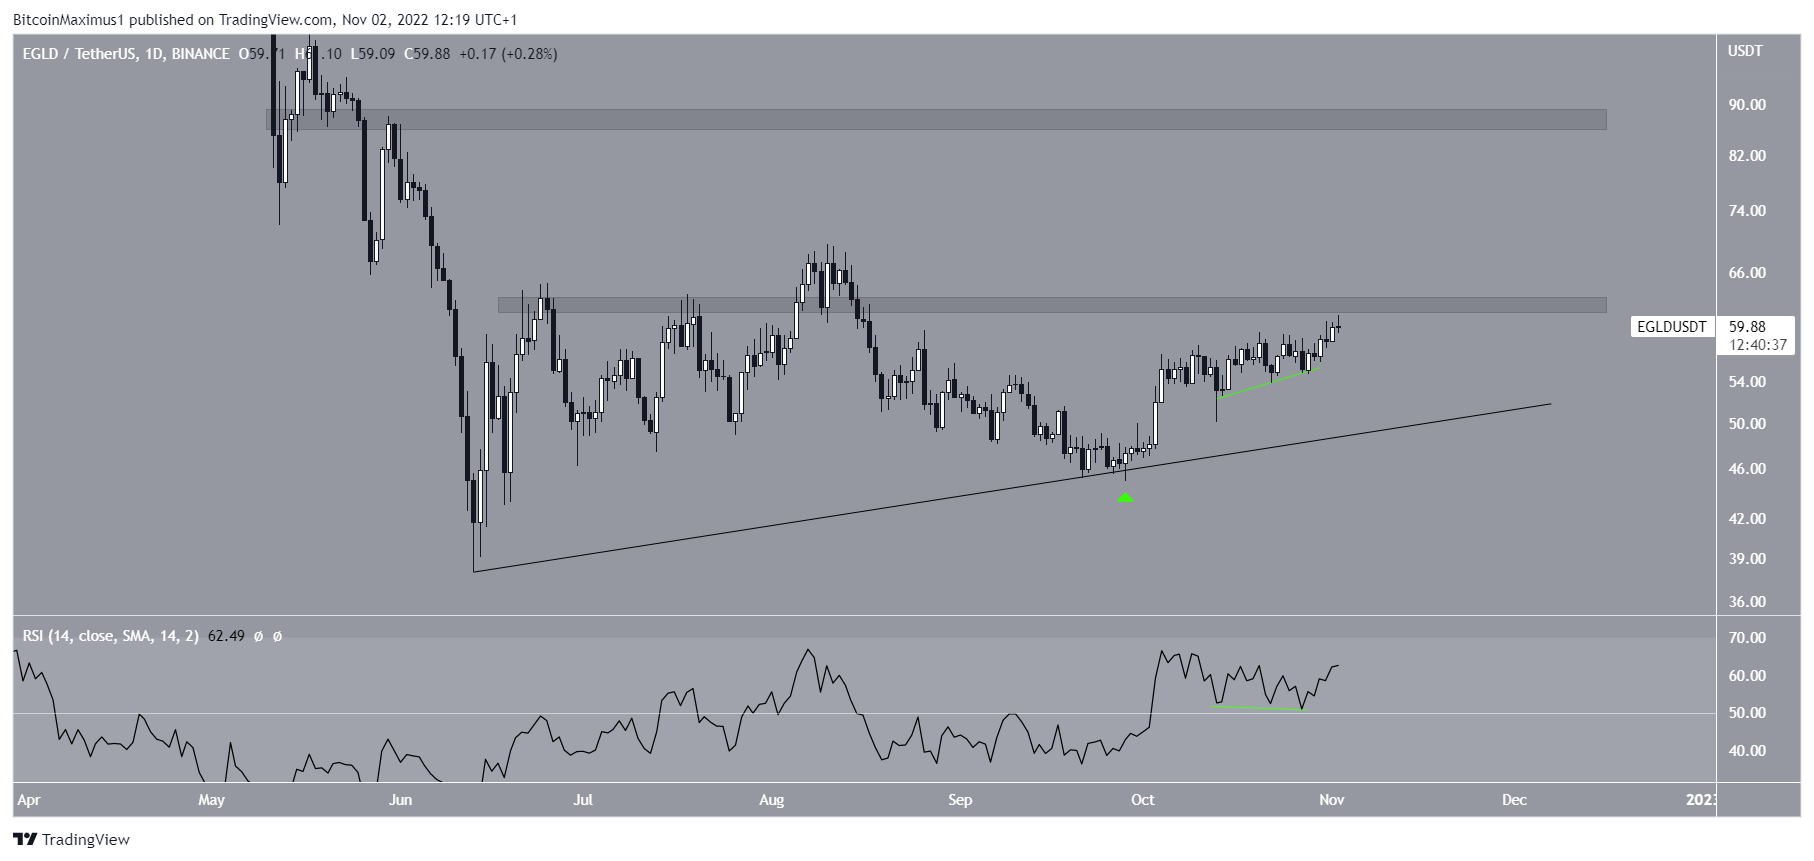
The EGLD price has been moving upwards alongside an ascending support line since June 13. More recently, it bounced at the line on Sept. 28 (green icon), validating its slope.
Throughout the upward movement, the main resistance area has been at $62.50. The Elrond price initially broke out above it between Aug. 7 and 10, but has fallen below it since. The area is now expected to provide resistance once more.
Technical analysis indicators are bullish. The daily RSI supports the continuation of the upward movement. The indicator is above 50 and has generated hidden bullish divergence (green line).
As a result of these readings, a breakout from the $62.50 area seems likely. If one occurs, the next closest resistance would be at $87.50. Interestingly, the sentiment and price action over the past 24 hours is positive despite another potential rate hike after today’s Fed meeting.
Conversely, a daily close below the support line would invalidate the bullish Elrond price prediction and suggest that new highs are in store.
Elrond Price Prediction: Correction or Impulse?
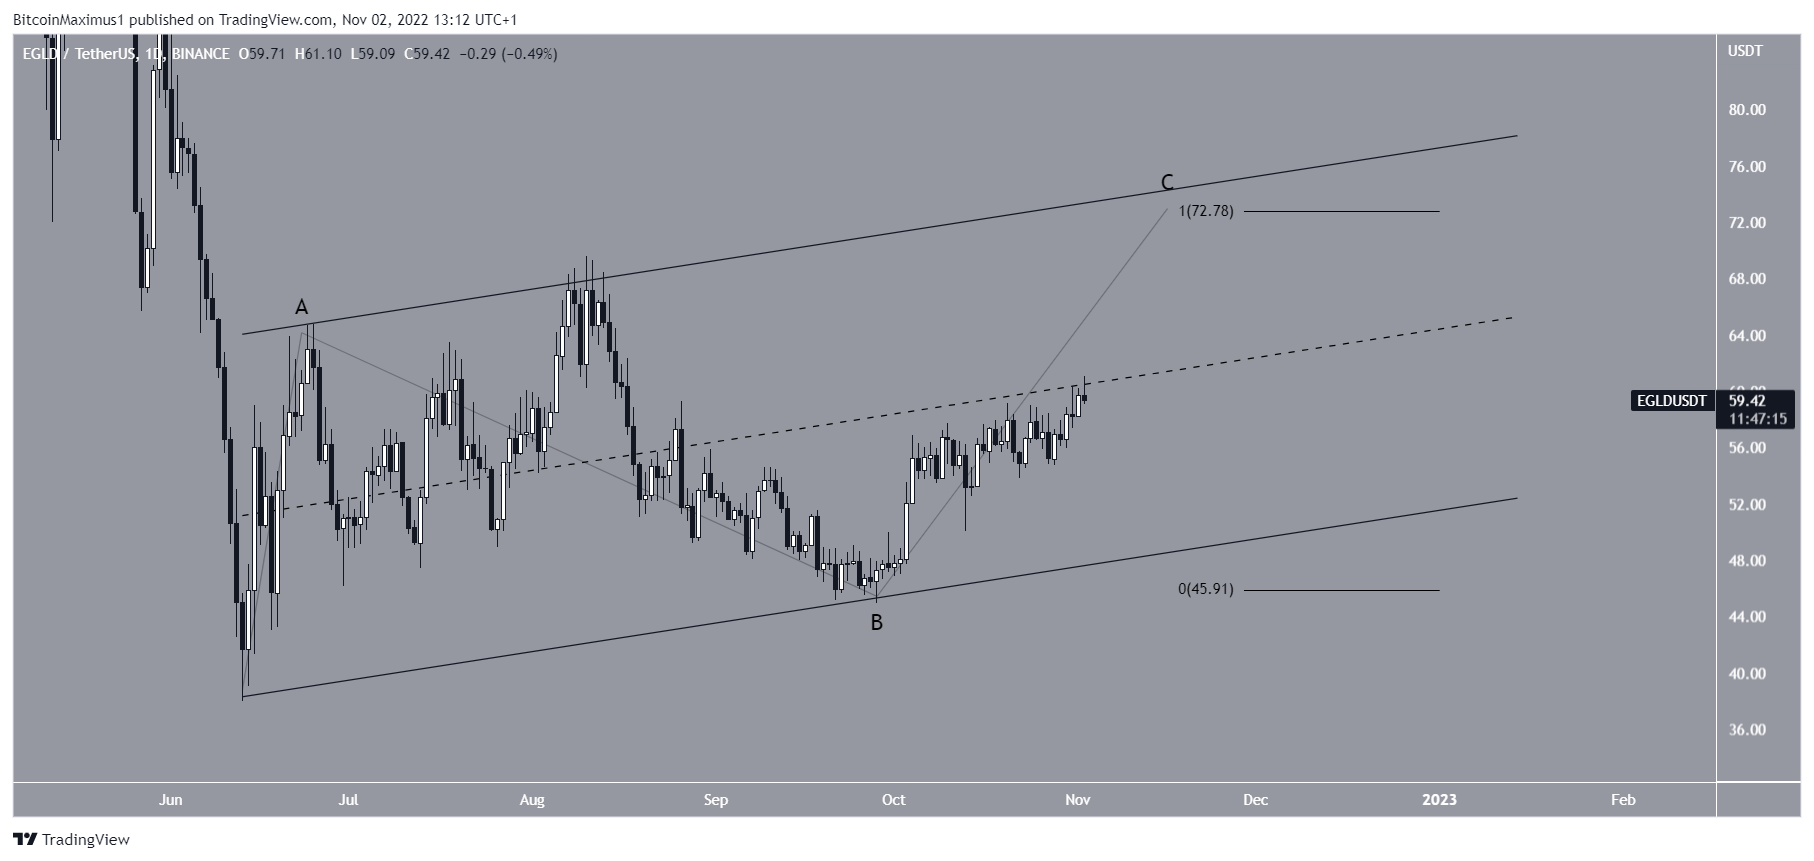
The upward movement since the June lows could be an A-B-C corrective structure, in which the EGLD price is currently in wave C (black). Giving waves A:C a 1:1 ratio would lead to a future price high of $72.80. This would be made right at the resistance line of the channel.
Currently, EGLD is attempting to move above the middle of the channel. If successful, it would be expected to increase towards the resistance line.
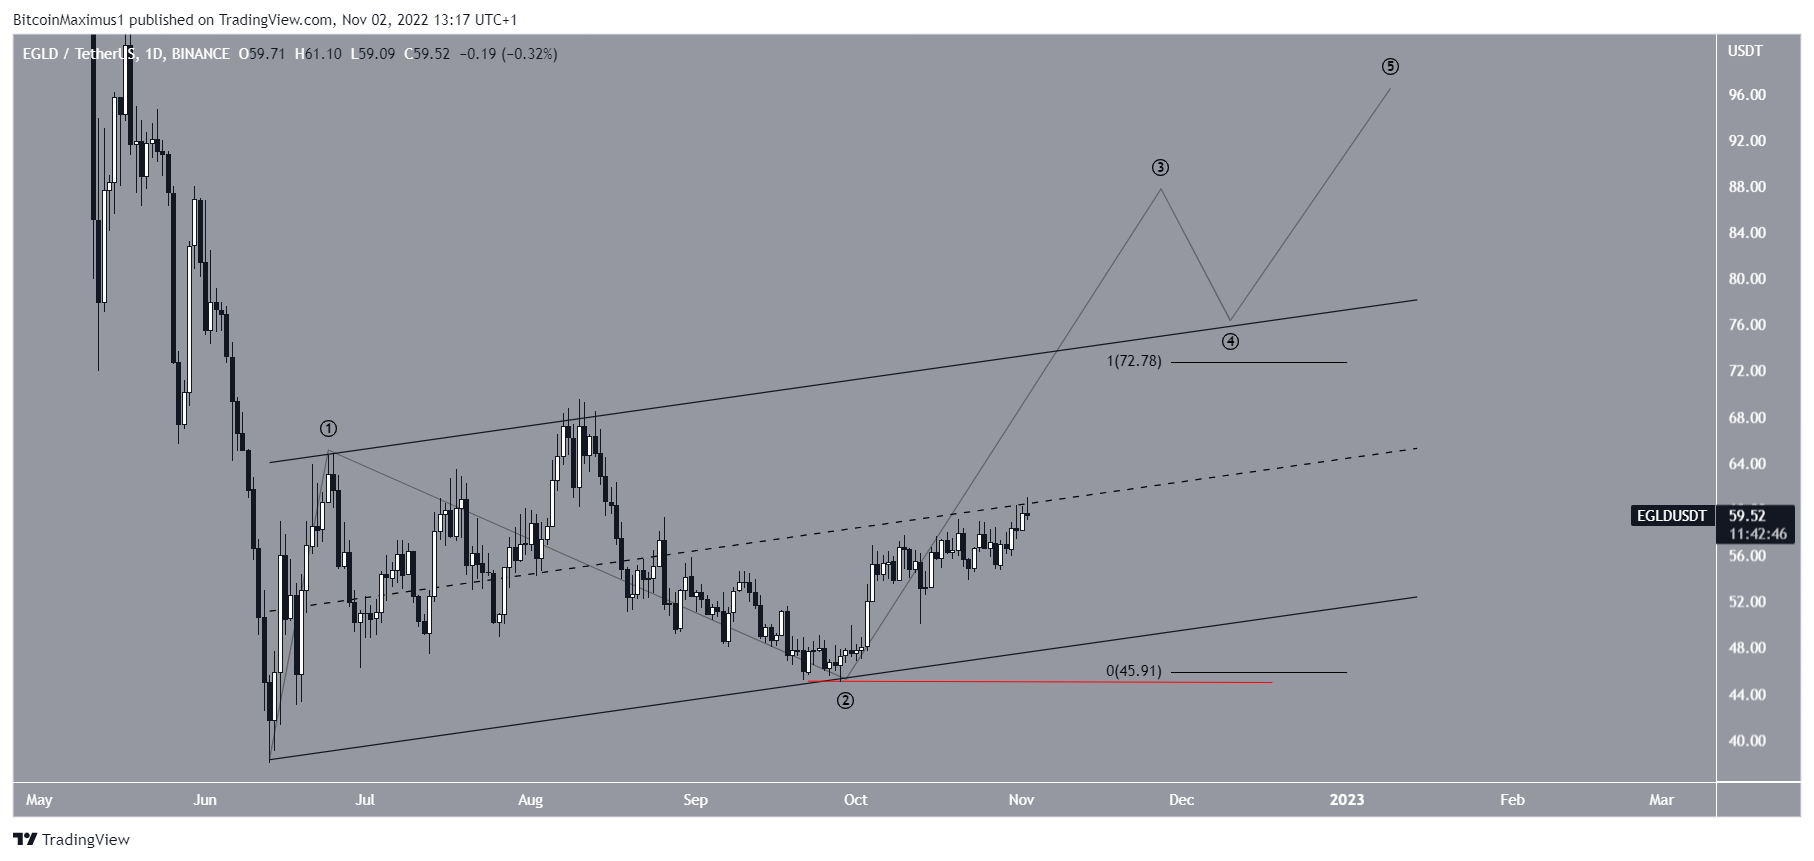
If the Elrond price breaks out from the channel, it would indicate that the long-term upward movement is impulsive. In this case, EGLD is expected to reach the next resistance of $78.50 would be expected.
On the other hand, a fall below the wave 2 low of $75 (red line) would invalidate the bullish EGLD price prediction and instead suggest that the price is expected to make new lows.
For the latest BeInCrypto Bitcoin (BTC) and crypto market analysis, click here
Disclaimer: BeInCrypto strives to provide accurate and up-to-date information, but it will not be responsible for any missing facts or inaccurate information. You comply and understand that you should use any of this information at your own risk. Cryptocurrencies are highly volatile financial assets, so research and make your own financial decisions


