


Elrond (EGLD) has broken out from a descending resistance line that had previously been in place since April 12.
While technical indicators are bullish, a bullish trend reversal has not been confirmed yet.
EGLD breaks out
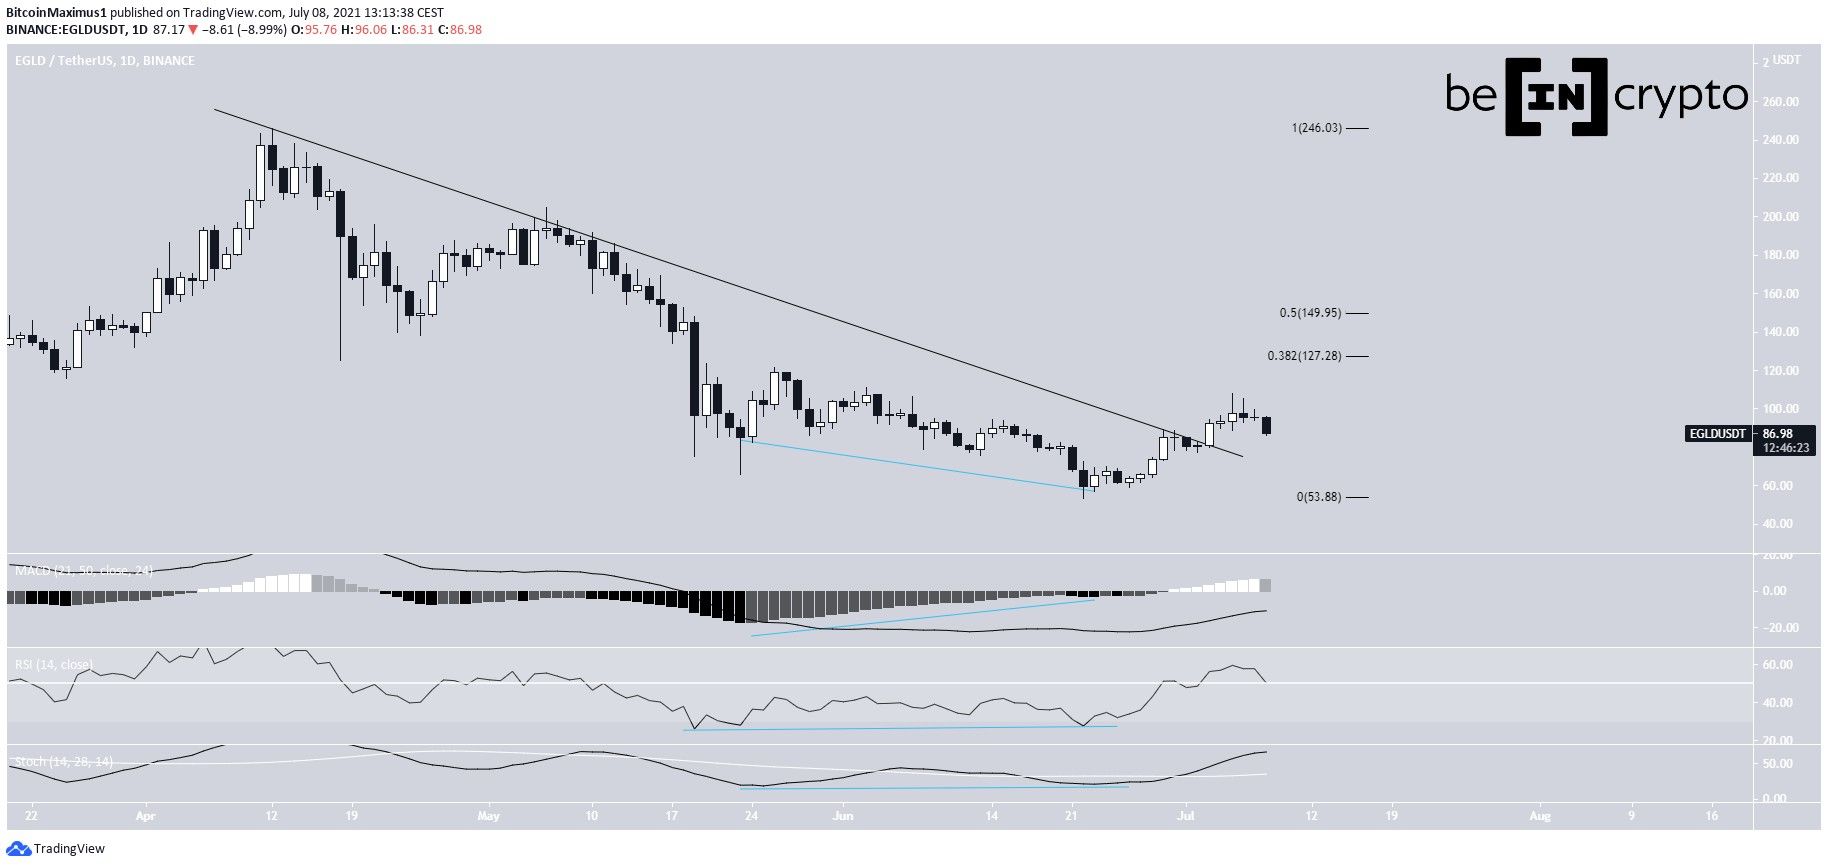
Elrond has been decreasing alongside a descending resistance line since April 12. On this day, it reached an all-time high price of $245.80. The downward movement continued until June 22, when a low of $67.39 was reached.
The low was combined with bullish divergences in the MACD, RSI, and Stochastic oscillator. Afterward, the RSI moved above 50 and the Stochastic oscillator made a bullish cross. Therefore, technical indicators are bullish.
EGLD has been moving upwards since then, eventually breaking out from the aforementioned descending resistance line on July 3. It reached a high of $107.81 before dropping.
The main resistance levels are found at $127 and $150. These targets are the respective 0.382 and 0.5 Fib retracement resistance levels.
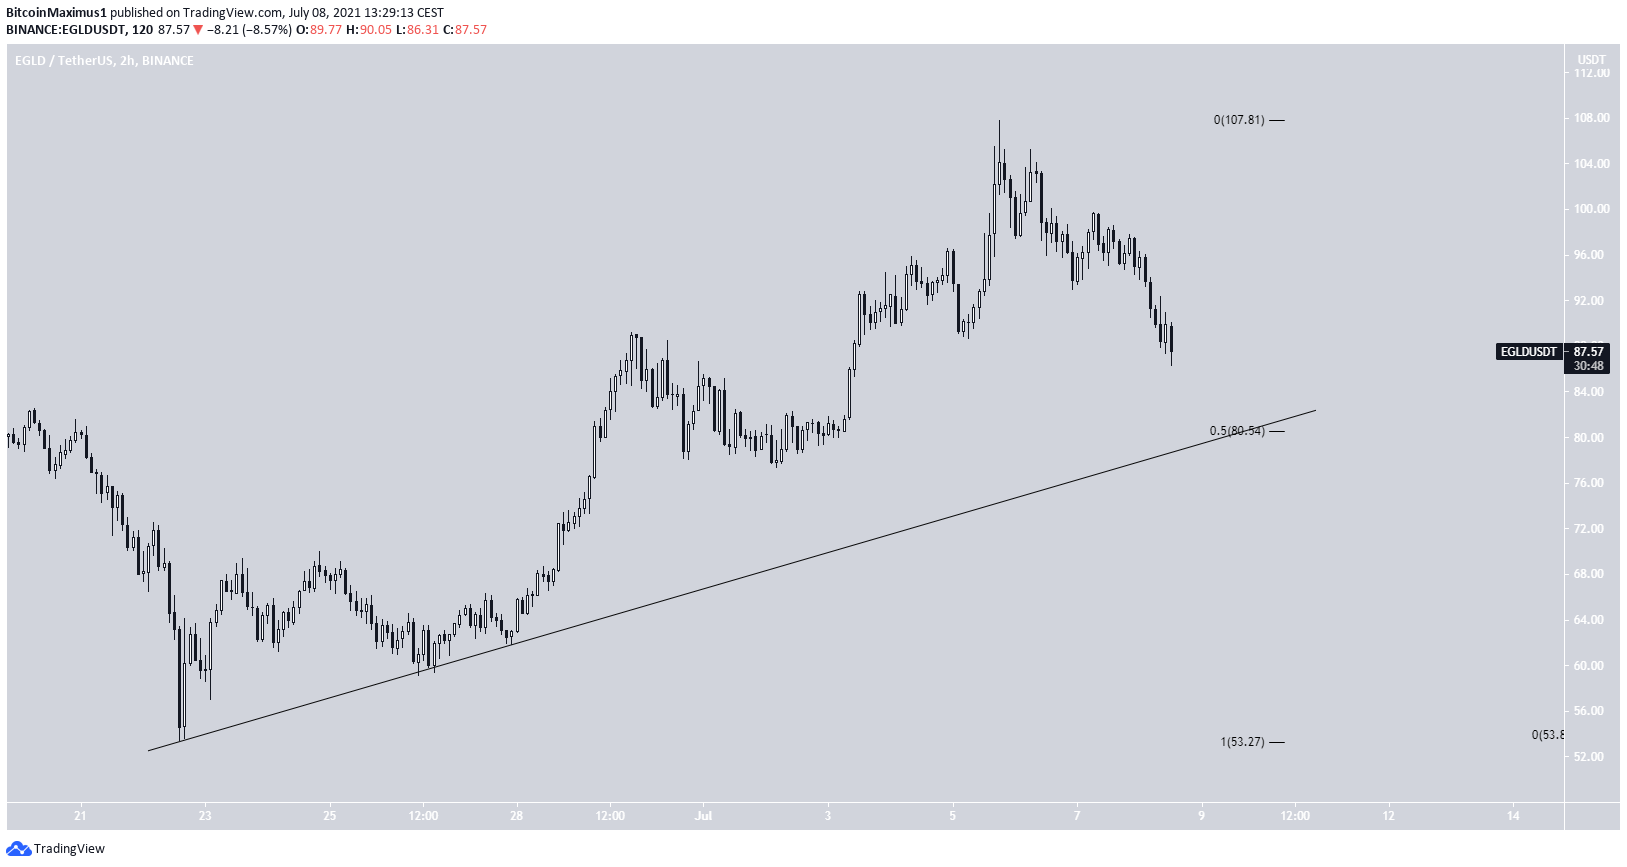
The two-hour chart shows a confluence of support levels at $80. This is the 0.5 Fib retracement support level and a potential ascending support line.
Therefore, EGLD would be expected to bounce once it reaches the level.
Wave count
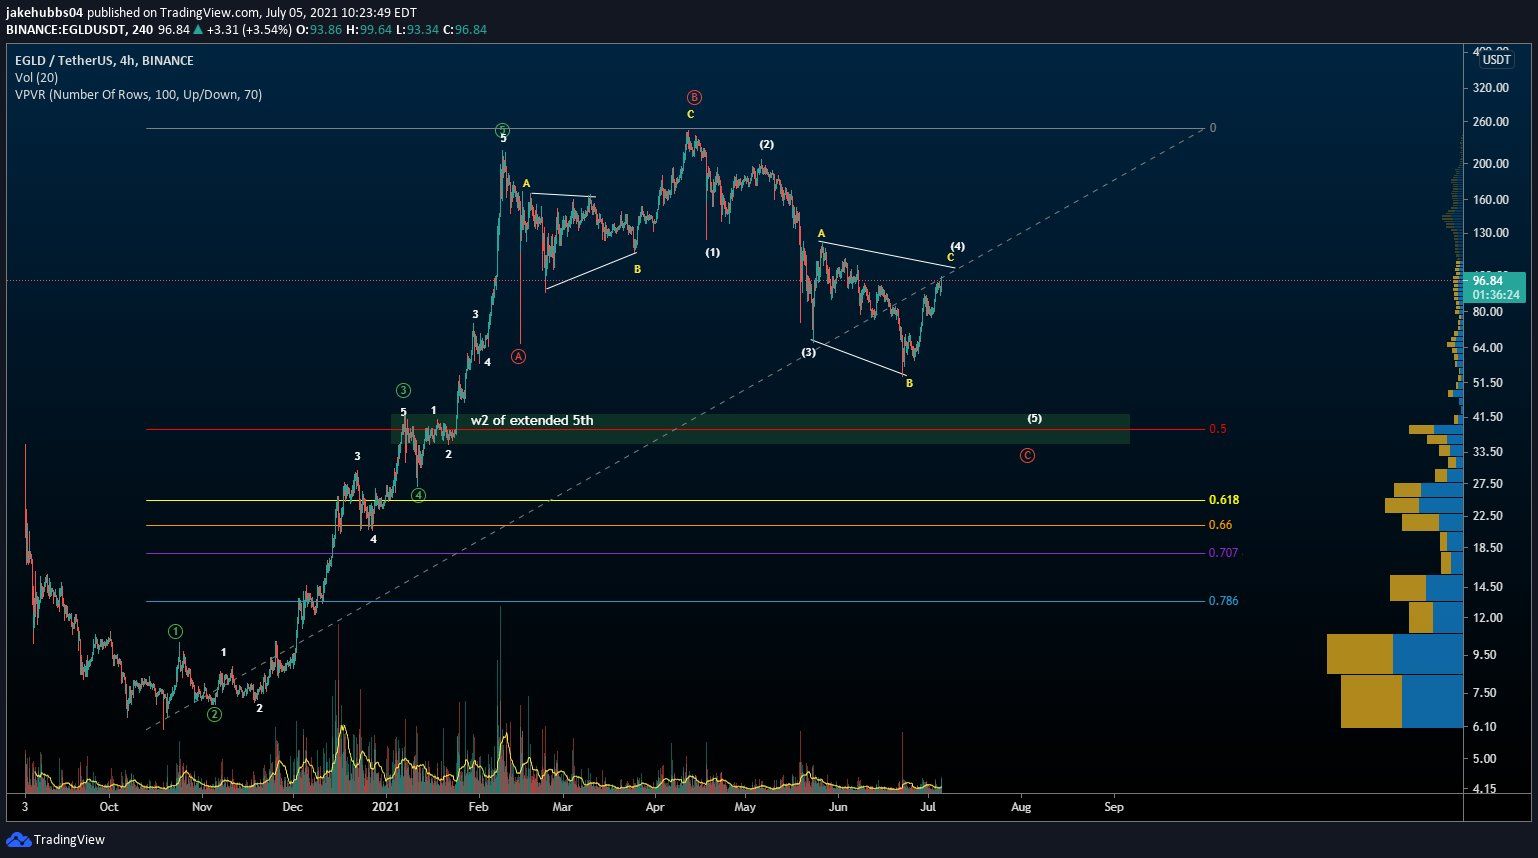
Cryptocurrency trader @TheTradingHubb outlined an EGLD chart, stating that if another downward movement would follow, the price could dip to the $40 region.
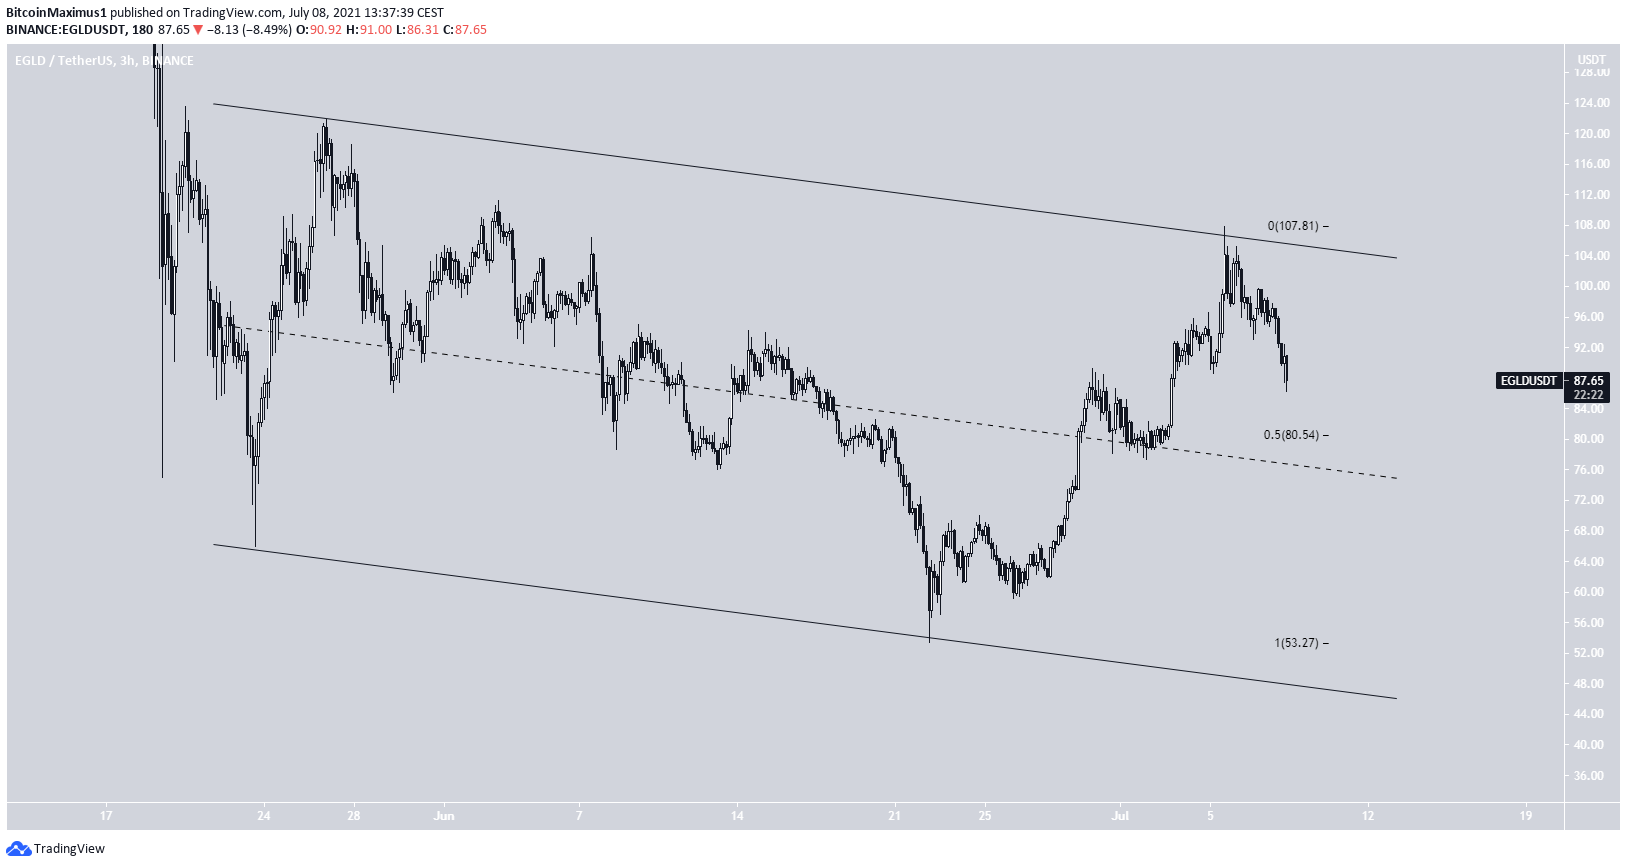
The fact that the entire movement since May 19 has been contained inside a descending parallel channel indicates that this could indeed be a running flat correction.
If EGLD breaks down below the $80 area, which is also the midline of the channel, it would indicate that another downward move toward the $40 area is likely.
EGLD/BTC
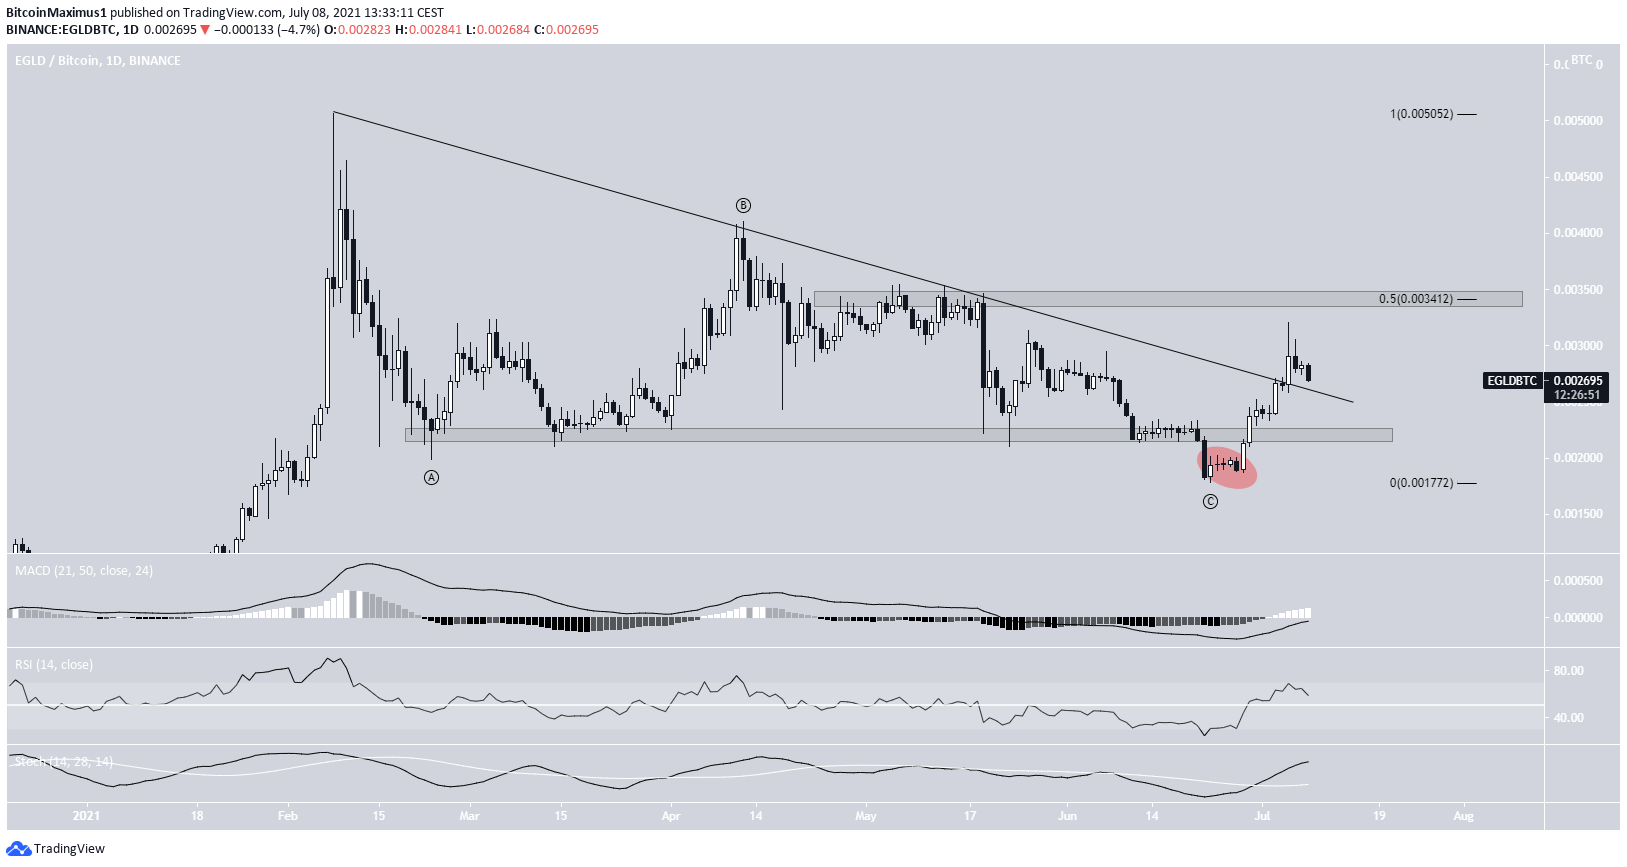
EGLD/BTC has been moving downwards since Feb. 8, when it reached an all-time high of 0.005 satoshis.
Throughout the decrease, it bounced above the 0.022 satoshi support area several times. While it initially broke down on June 28, the decrease was only a deviation before an upward move caused it to reclaim the level (red circle). The entire decrease resembles a completed A-B-C corrective structure.
EGLD then broke out from a descending resistance line that had been in place since the aforementioned Feb. 8 high.
Similar to the USD pair, technical indicators in the daily time-frame are bullish.
The closest resistance area is found at 0.0034 satoshis.
For BeInCrypto’s latest bitcoin (BTC) analysis, click here.


