


If Elrond (EGLD) manages to hold on above the $44 to $46 horizontal support area, it could break out from the current descending wedge pattern.
On Thursday, Opera, one of the largest web browsers in the world, announced that it had integrated Elrond. This allows it to provide direct access to the Elrond ecosystem for its more than 300 million users.
Elrond’s CEO Beniamin Mincu said that: “‘Elrond is one of the first carbon-negative blockchains in Europe, and its integration with Opera will help millions of new users to access the Web3 ecosystem.”
Additionally, Opera will offer an integrated crypto noncustodial wallet. This allows it to further advance mainstream blockchain adoption.
Easy access to blockchain products if essential for expansion, and this is a step in the right direction for both companies.
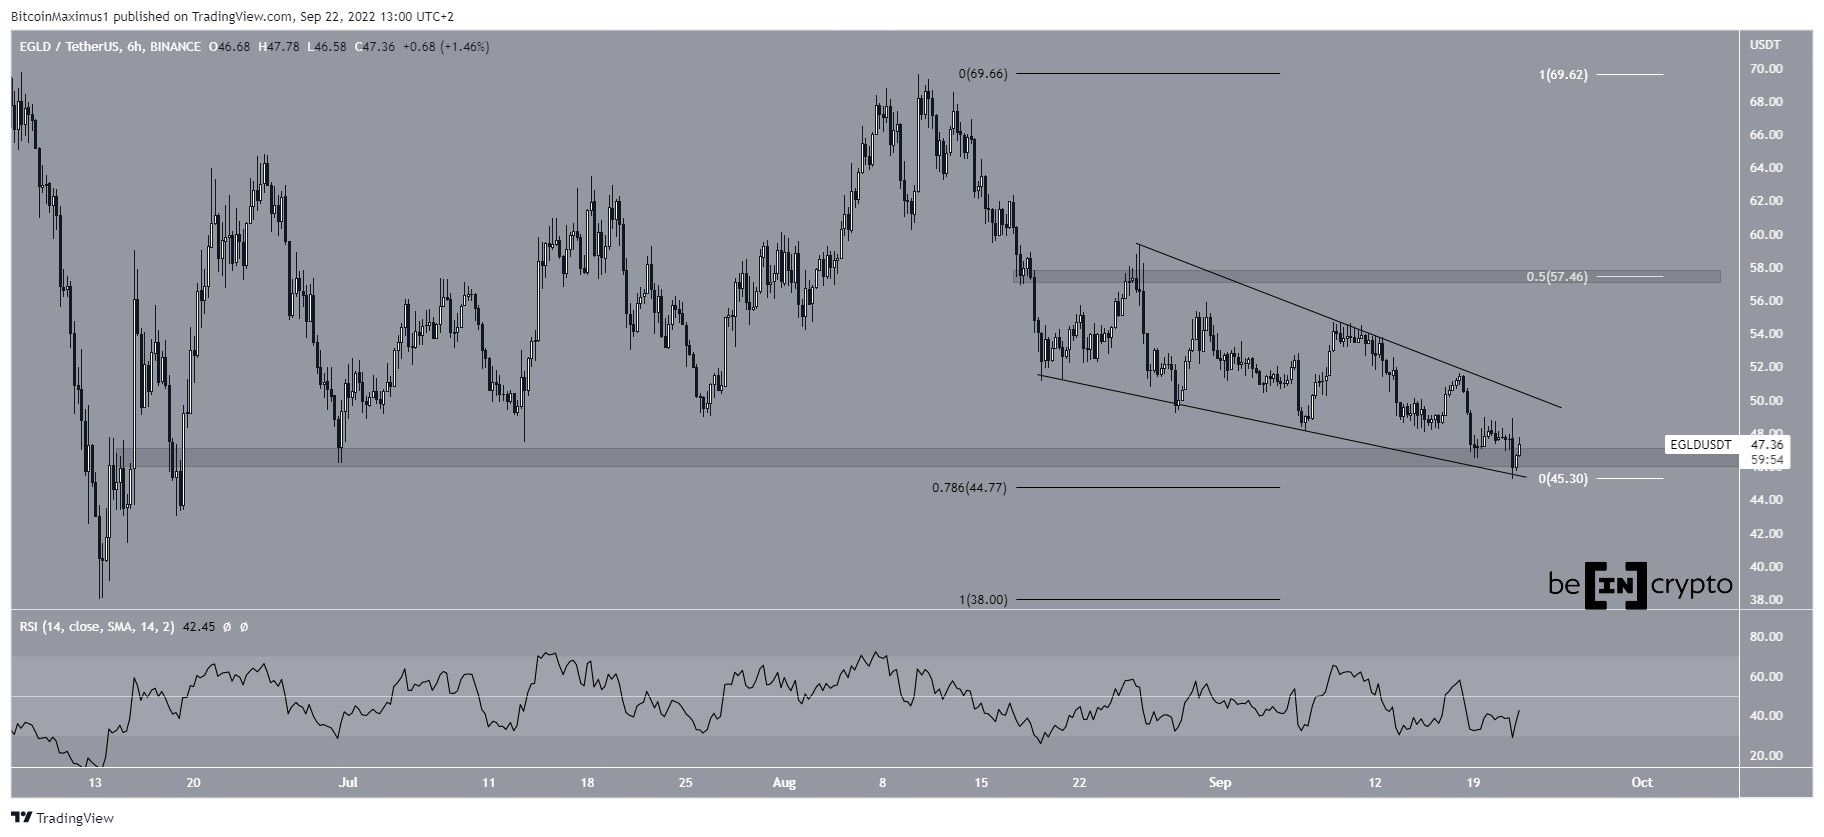
Wedge pattern
EGLD has been decreasing very gradually since Aug. 16, creating a descending wedge pattern in the process. The descending wedge is considered a bullish pattern. So, an eventual breakout from it is expected.
Furthermore, the price has reached a confluence of support levels between $44 and $46, created by:
- Horizontal support area
- 0.786 Fib retracement support level
- Support line of the wedge
Therefore, while the RSI has yet to provide any bullish signs, a breakout is expected as long as EGLD does not reach a close below this confluence of support levels. If one occurs, the closest resistance area would be at $57.50.
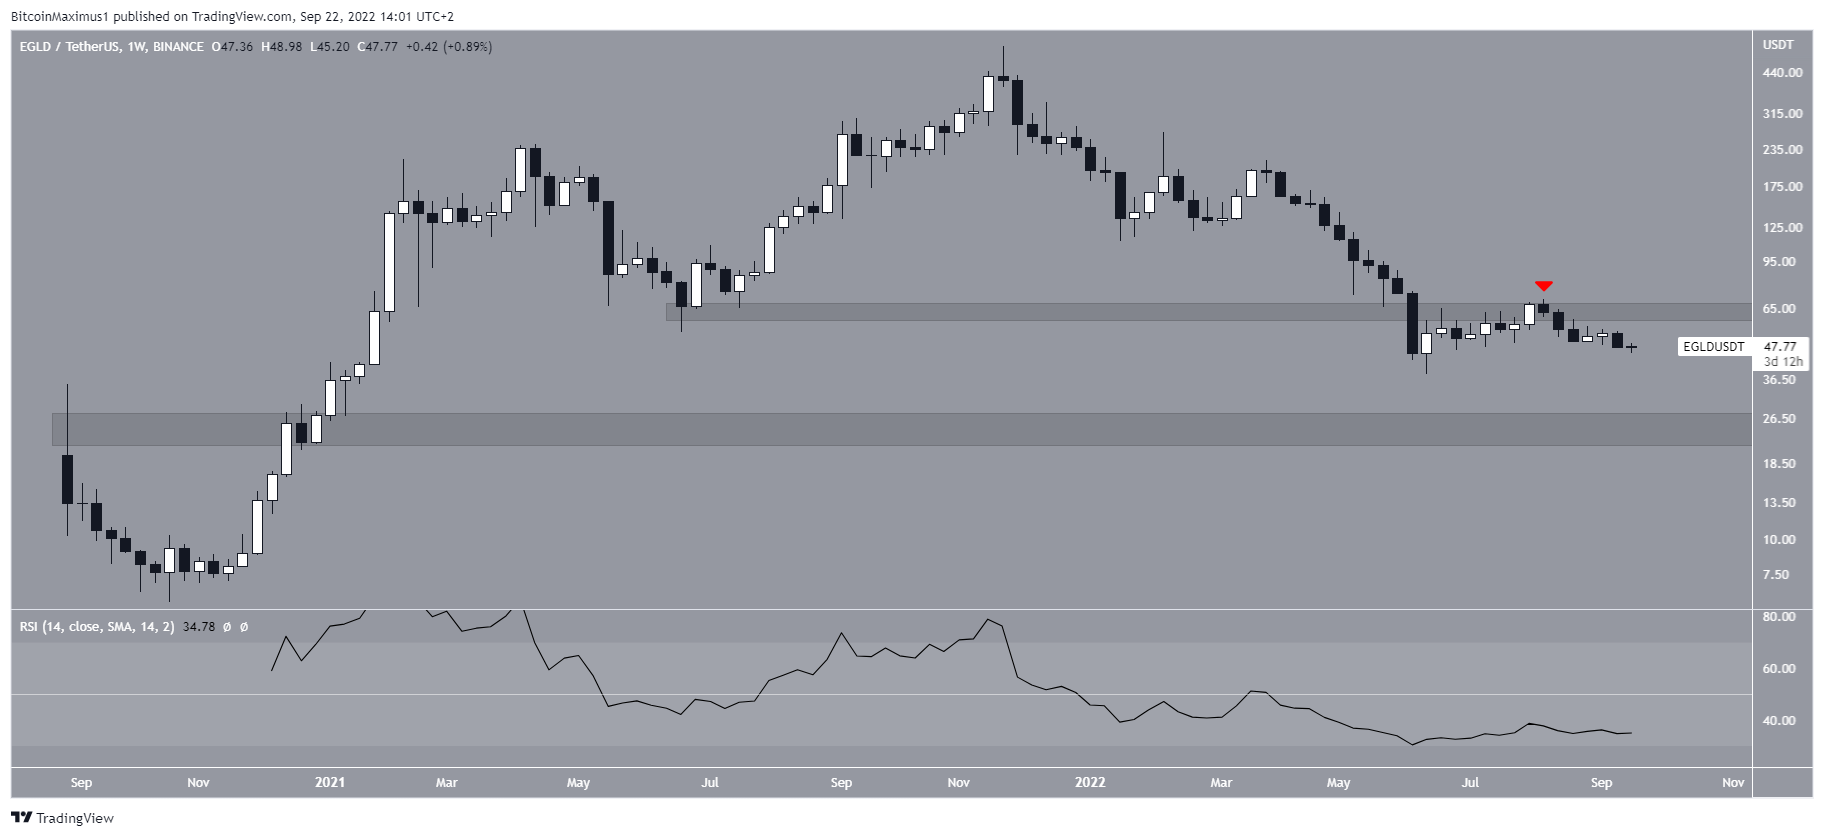
Long-term EGLD movement
Despite the likelihood of a short-term breakout, the weekly chart remains bearish. The two main reasons for this are:
- The rejection from the $66 resistance area (red icon)
- The fact that the weekly RSI is below 50.
Unless the price manages to reclaim this resistance, an eventual decrease towards the next closest support area at $23 seems likely.
For Be[In]Crypto’s latest Bitcoin (BTC) analysis, click here


