
The Polkadot (DOT) price is approaching an important support area that could initiate a bounce and possibly signal the end of the current correction.
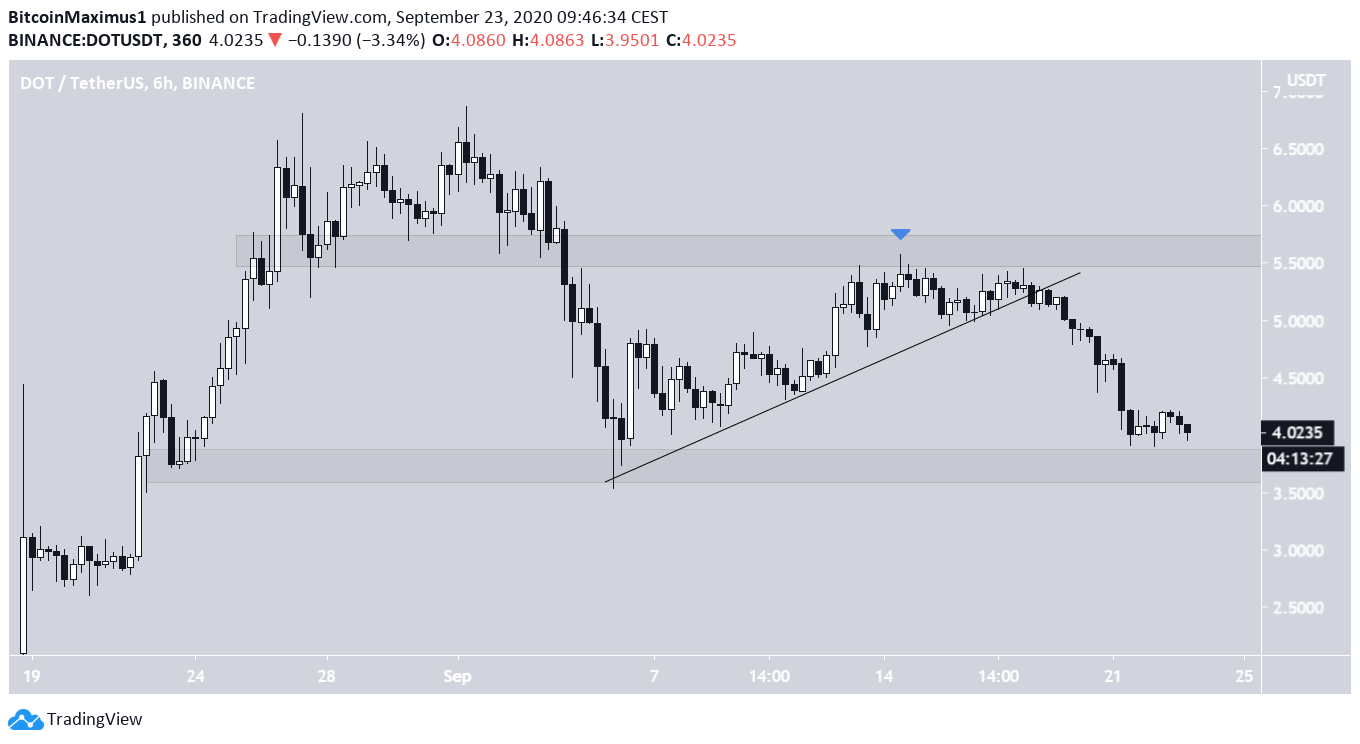
After a significant decrease from its all-time high on Sept 1, DOT reached a local low of $3.53 on Sept 5 and began an upward move.
The move continued until Sept 14 when the price briefly revisited $5.57. However, DOT reached a top, broke down from an ascending support line, and has been decreasing since.
DOT Trading Range
The local high confirmed the $5.65 area as resistance. Currently, the price is trading near $4.10 after hitting a low of $3.95 on the day.
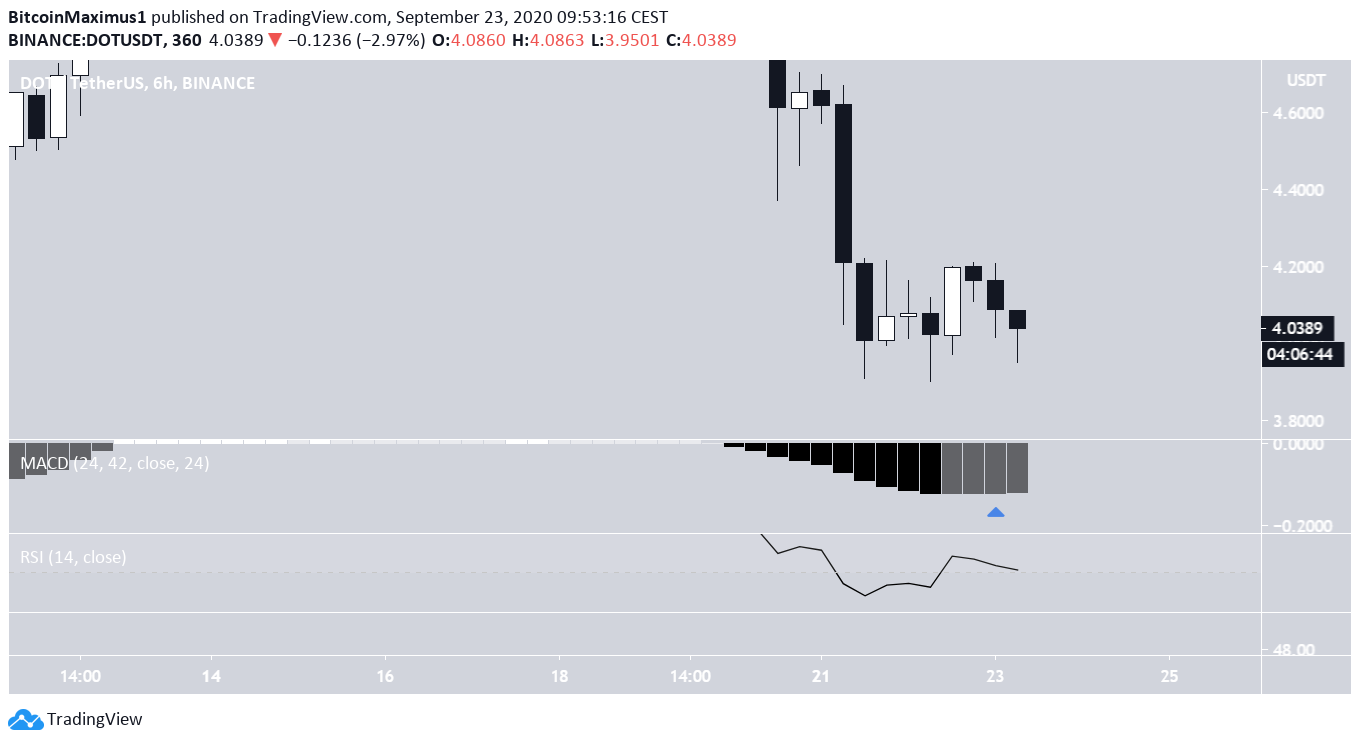
Technical indicators are slowly starting to turn bullish, but have not confirmed the bullish reversal yet. While the MACD is increasing, it has not crossed into positive territory. In addition, the RSI is oversold but has not generated bullish divergence yet.
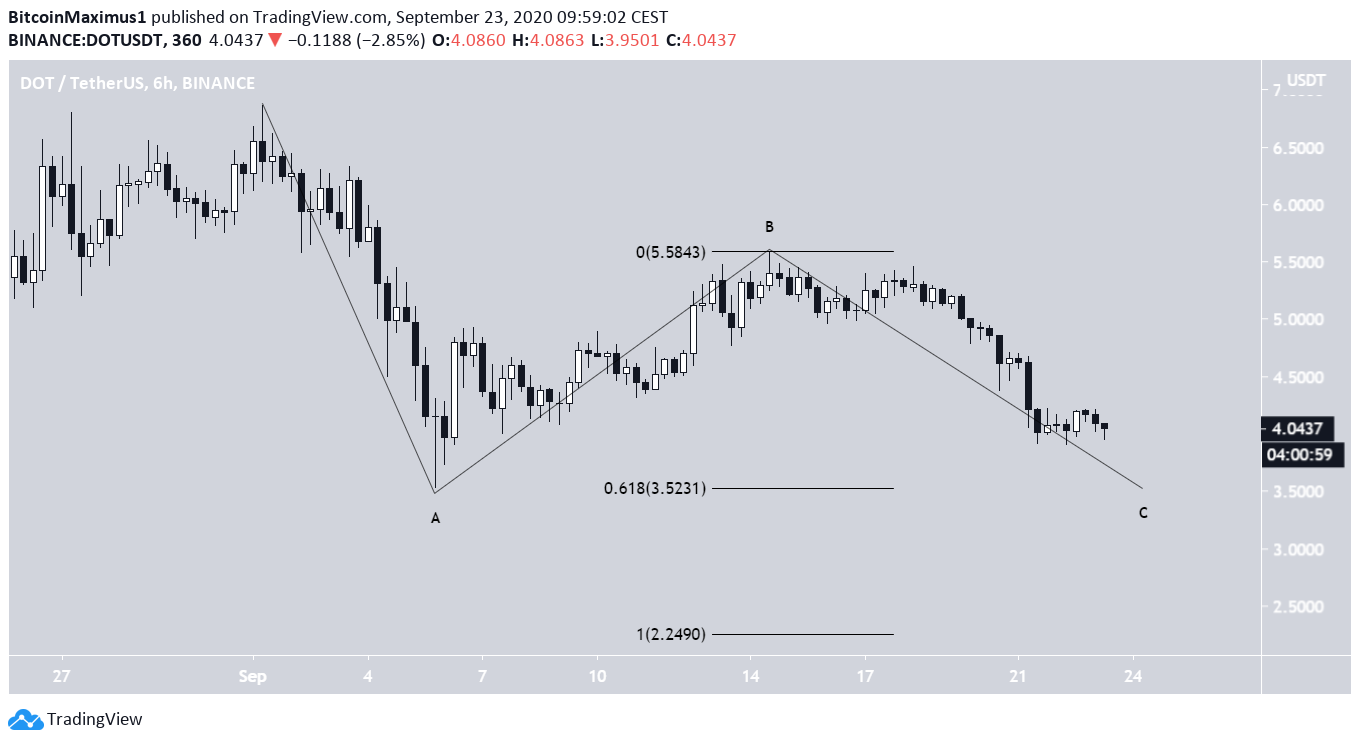
Wave Count
Beginning on Sept 1, DOT has seemingly begun a corrective A-B-C formation (in black below) and looks to be currently in the C wave.
The two most likely levels for the correction to end are at $3.52 and $2.24, which are found by projecting the length of the A wave to the top of the B wave (0.618 and 1 respectively).
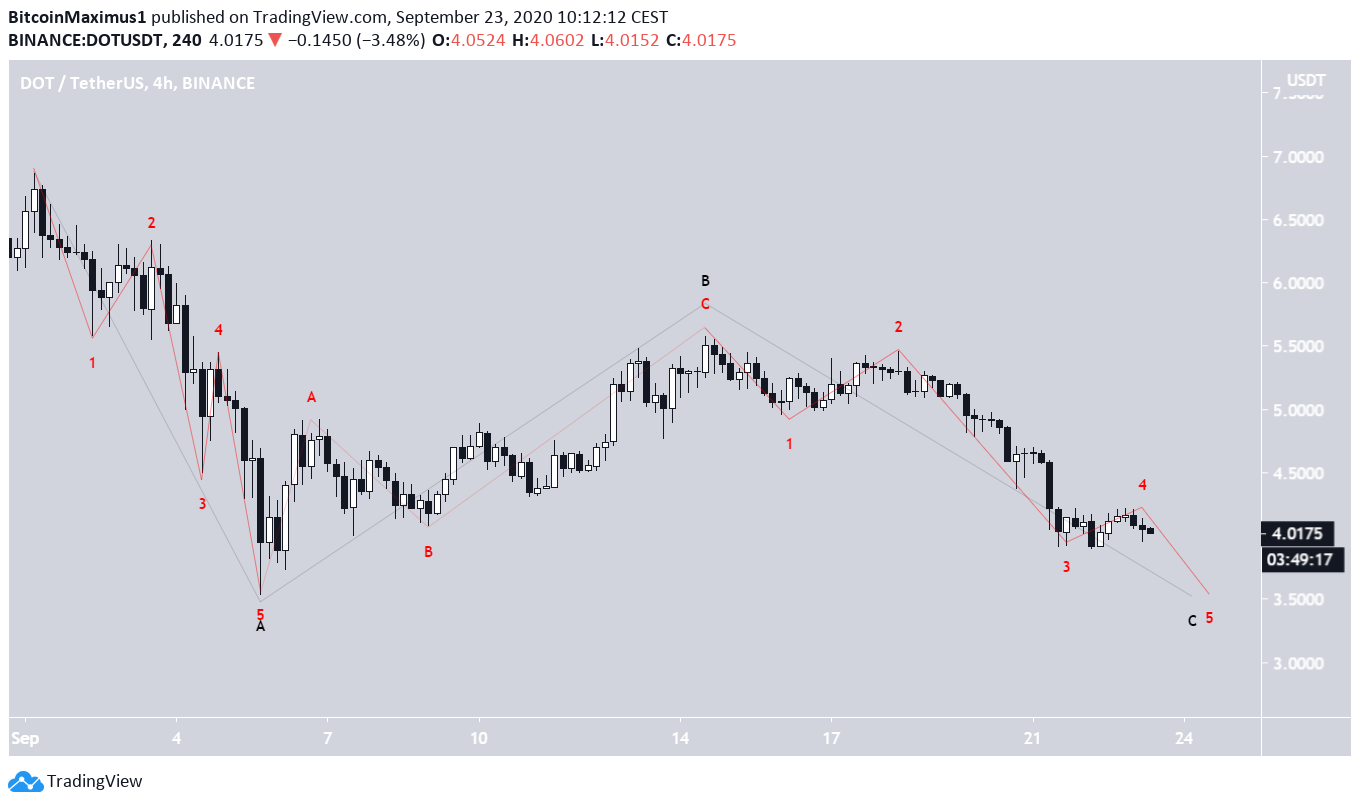
A closer look at the short-term movement reveals that the C wave is transpiring inside a bearish impulse (in red below). Where exactly the corrective period ends will mostly depend on if the fifth wave extends. The first target of $3.52 seems more likely at this point.
DOT/BTC
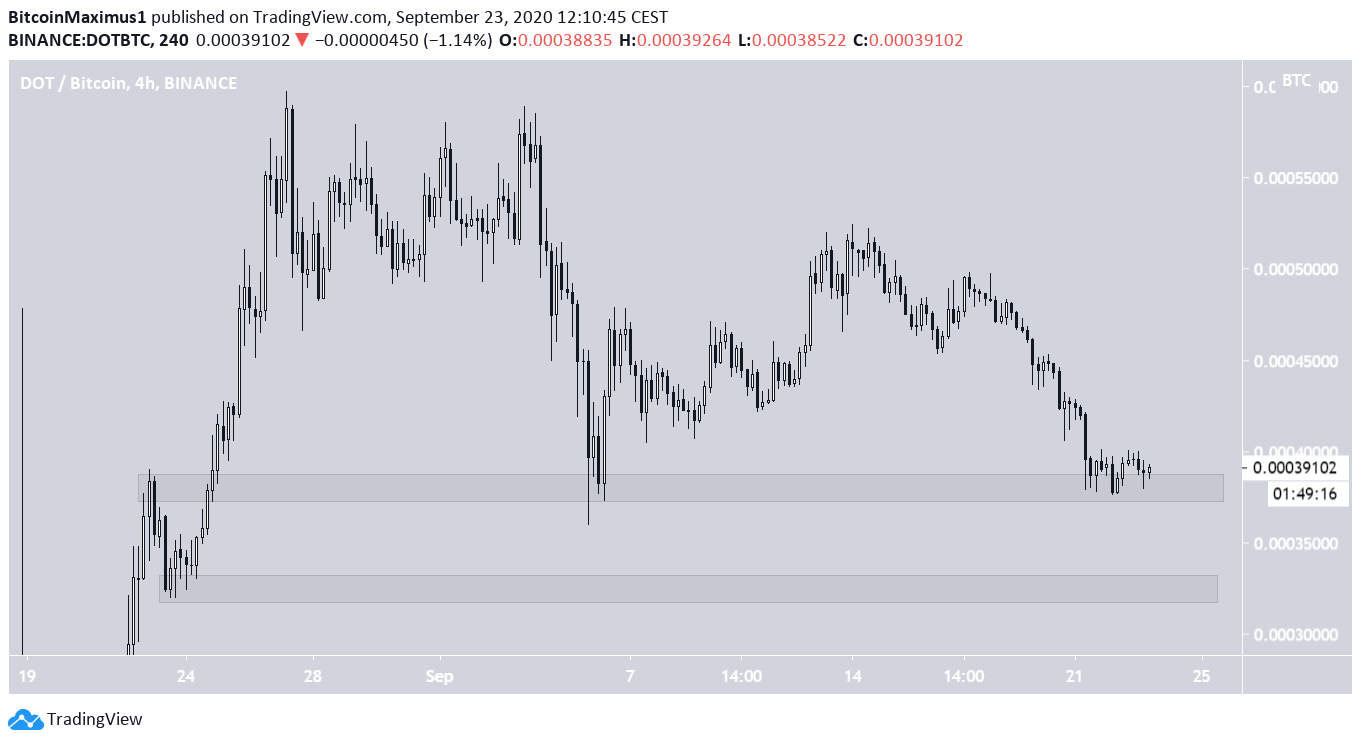
Cryptocurrency trader @TheEurosniper outlined a DOT chart, stating that the price is expected to decrease toward 32,500 satoshis.
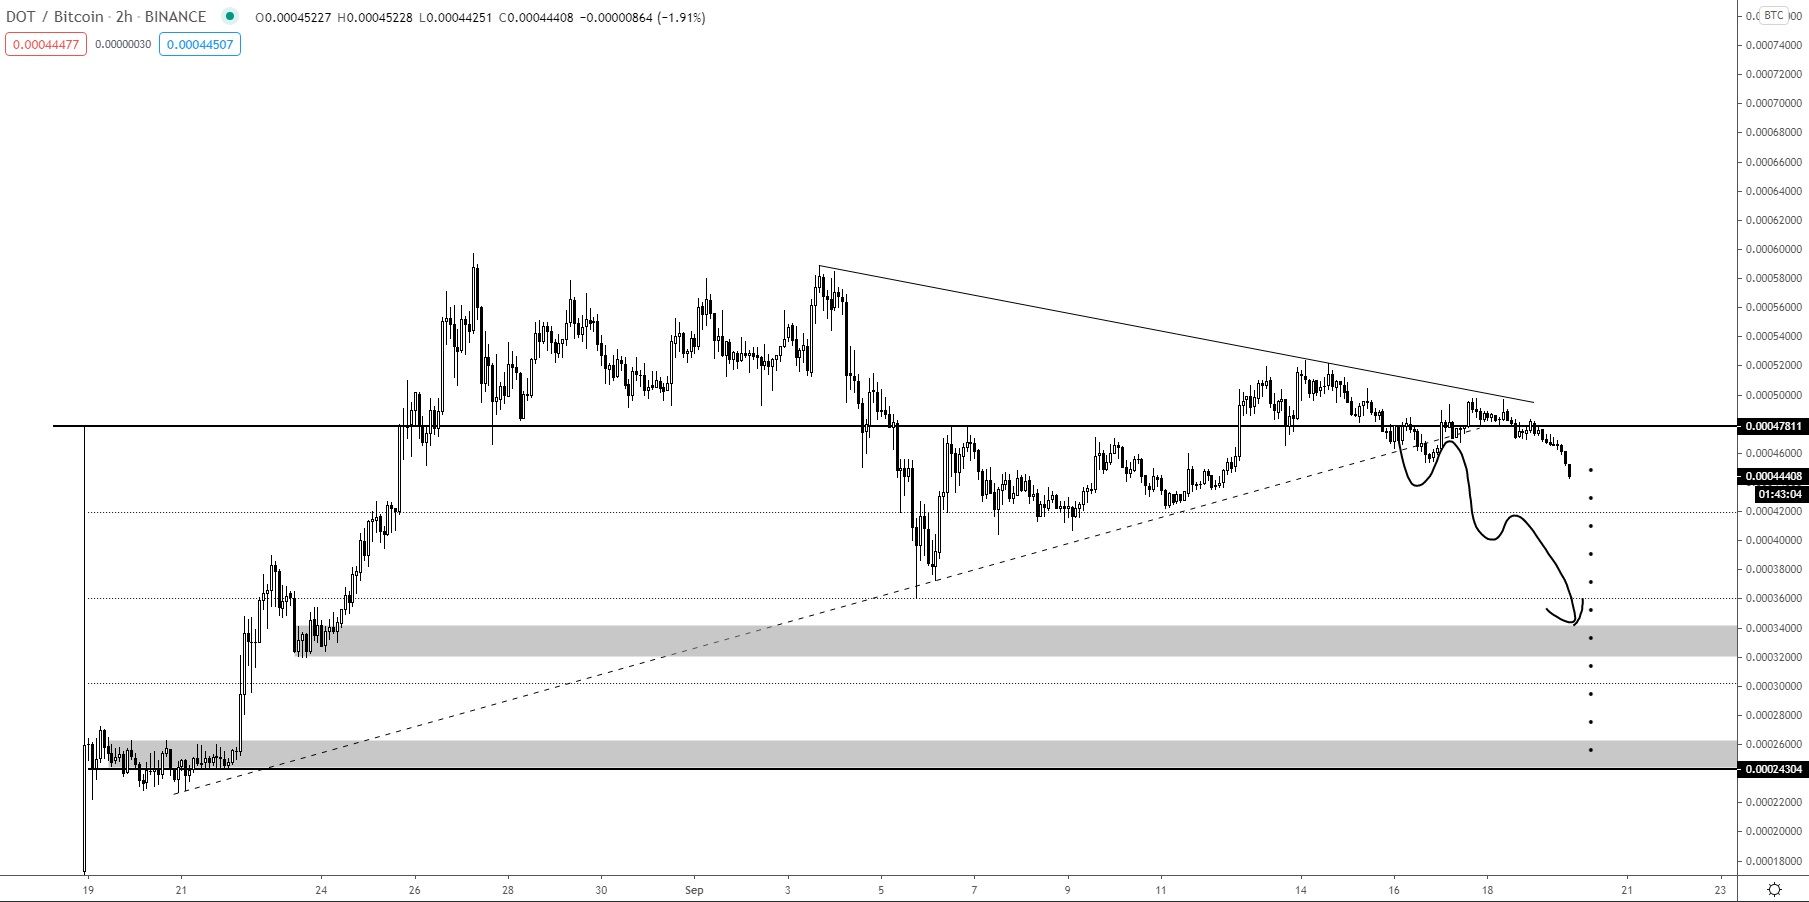
The DOT/BTC chart is very similar to its USD counterpart. It has reached the first support area at 38,500 satoshis, and a breakdown from it could take the price all the way back to 32,500 satoshis, fitting with the target given in the tweet.
To conclude, DOT is expected to complete one more short-term wave down before resuming its upward movement.
For BeInCrypto’s latest Bitcoin (BTC) analysis, click here!
