


The Bitcoin (BTC) price has been increasing since reaching a low on Sept 21. However, the increase looks corrective and BTC is expected to complete another small downward move before eventually resuming its upward movement.
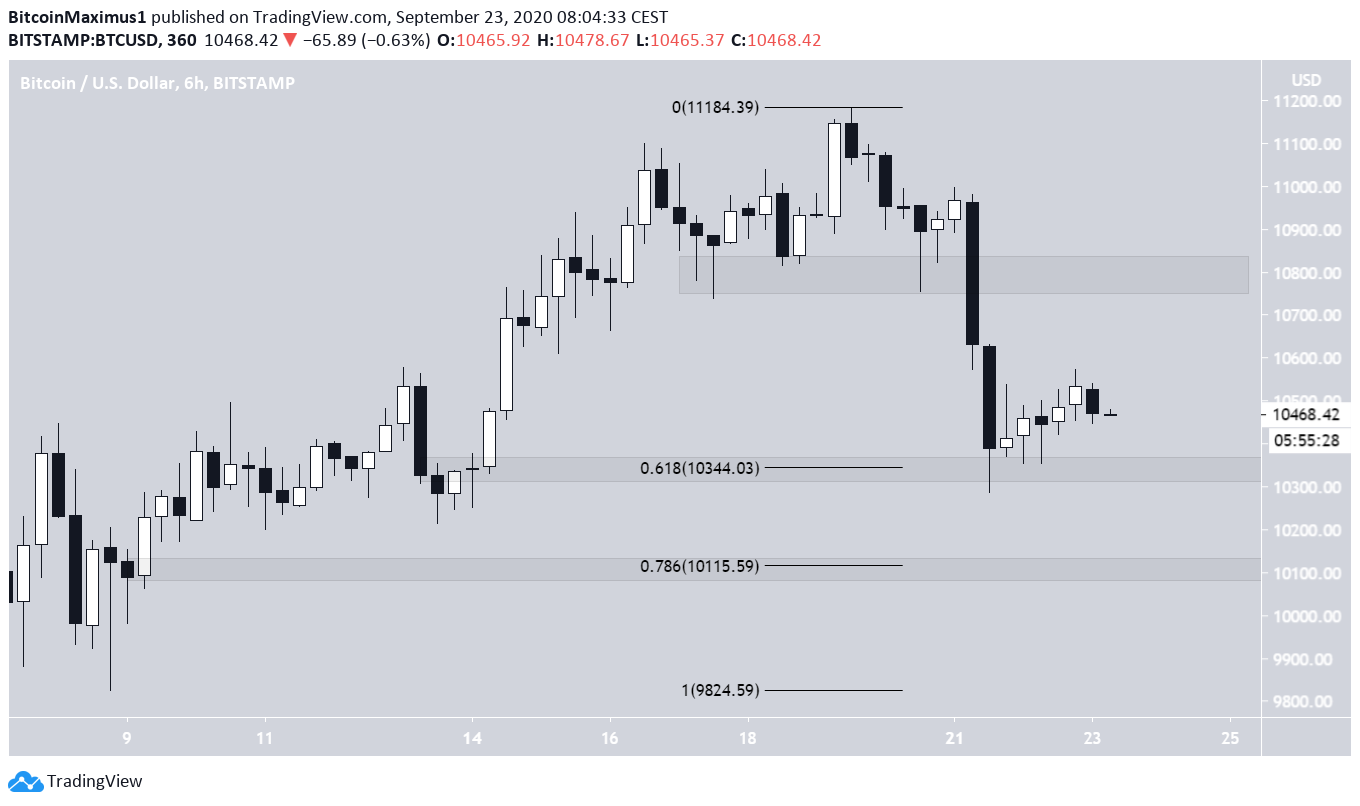
After reaching a low of $10,286 on Sept 21, the BTC price began an upward movement that is still ongoing. So far BTC has only managed to reach a local high of $10,573.
Weak Bitcoin Bounce
The bounce transpired at the 0.618 Fib level and the minor $10,350 support area. The next support area is found at the 0.786 Fib level near $10,115. Conversely, the closest resistance area is found at $10,800.
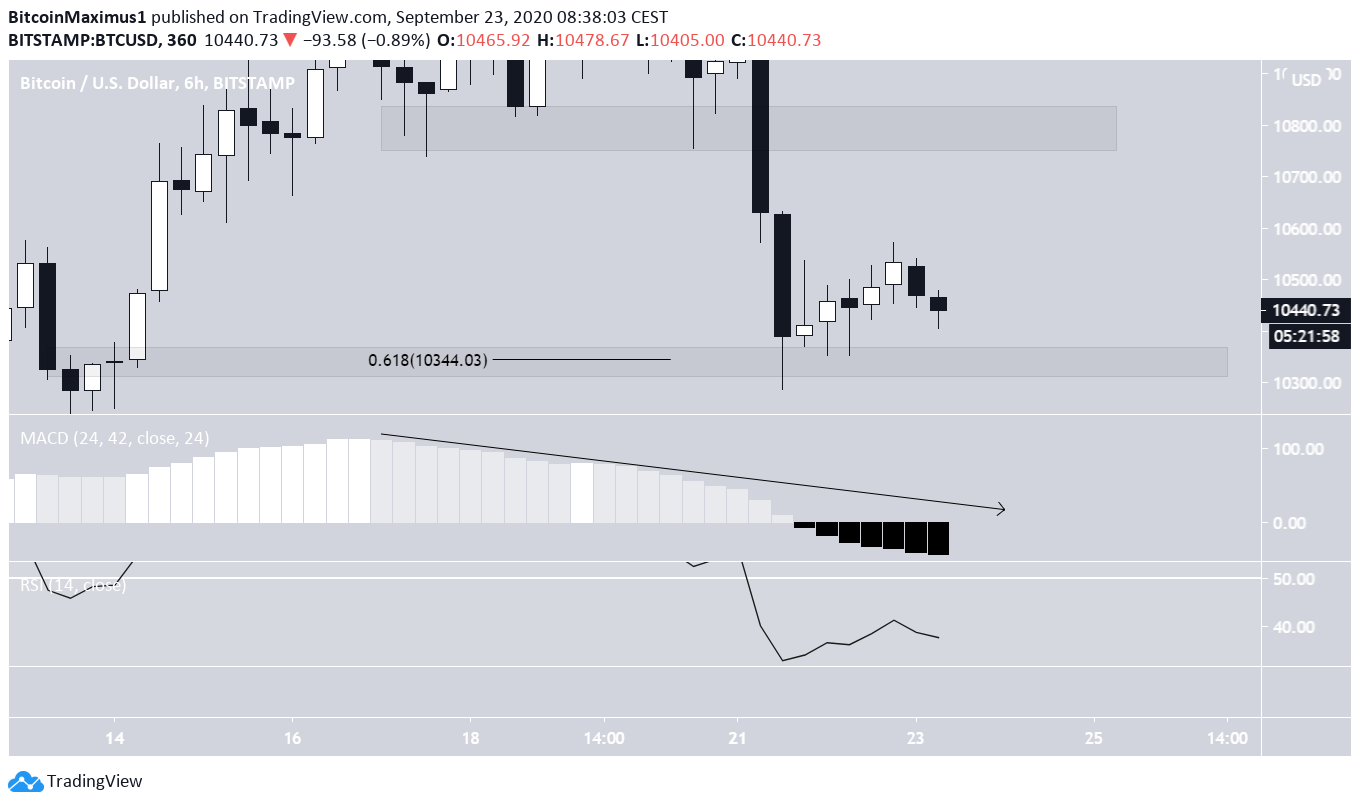
Technical indicators do not show signs of a reversal yet. The MACD has been decreasing over the past three days and has turned negative. The RSI has not generated any bearish divergence and is not yet oversold.
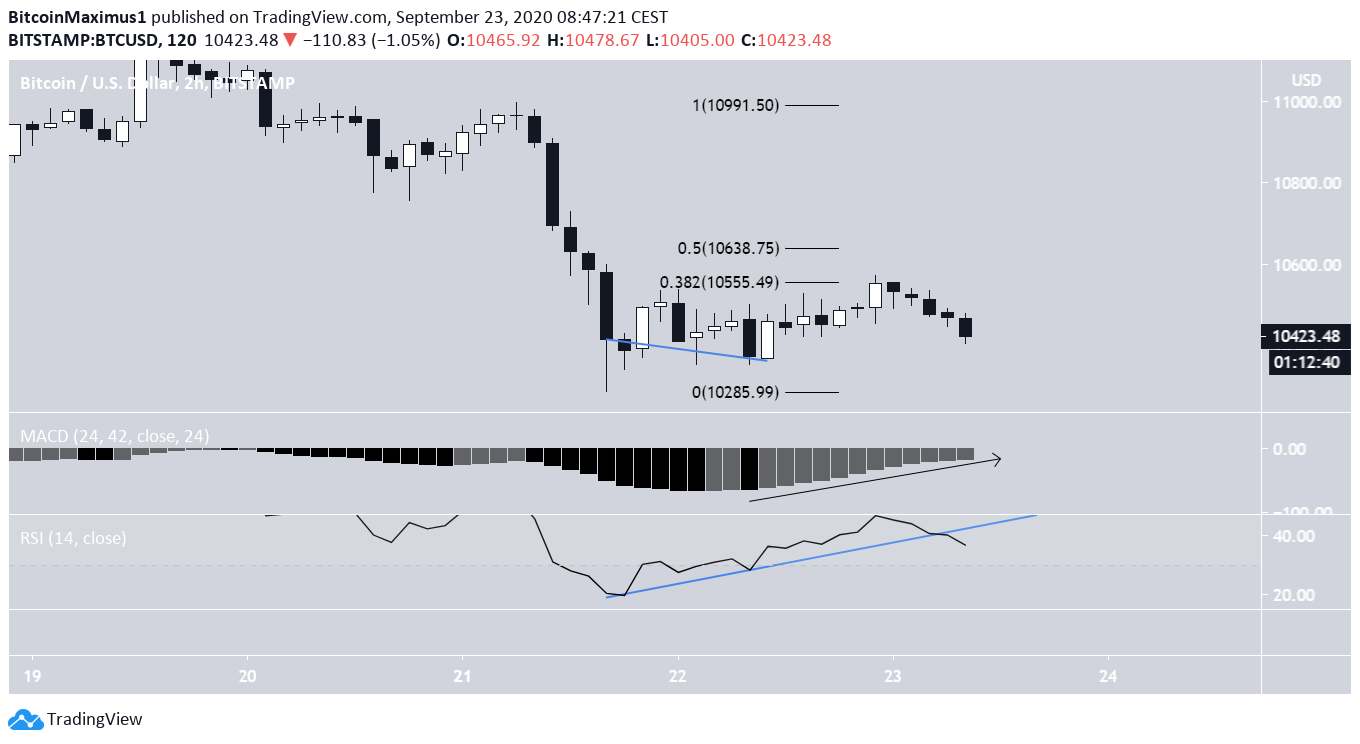
The shorter-term chart indicates that the current movement is more likely to be a retracement than it is to be the beginning of a new upward movement. So far, the price has been rejected by the 0.382 Fib level and dropped back. The 0.5 Fib level is found at $10,638.
While there was some bullish divergence in the RSI, an increase has already occurred as a result and the trend of the divergence has since been broken. The MACD is moving upwards but has not reached positive territory yet.
As it stands, another re-test of $10,350 and possibly the $10,115 area seems like the most likely scenario.
Wave Counts
Beginning on Sept 19, it seems that BTC has begun a bearish impulse (shown in blue below). If the count is correct, the price is nearing or has already reached the top of wave 4, and another leg down is expected afterward. This would fit with the analysis from the previous section.
Furthermore, projecting the length of wave 1 to the top of wave 4 gives us a target of $10,121 for the bottom of wave 5. This is a confluence of the 0.786 Fib level and minor support area.
This formation remains valid as long as the wave 1 low of $10,723 is not breached.

To conclude, the Bitcoin price is expected to make another low near $10,100 before eventually resuming its upward movement.
For BeInCrypto’s previous Bitcoin analysis, click here!


