


The Polkadot (DOT) price supposedly broke out from a resistance line but fell back below shortly after. The price will likely break down from its support area and head lower.
Deviation Above Resistance
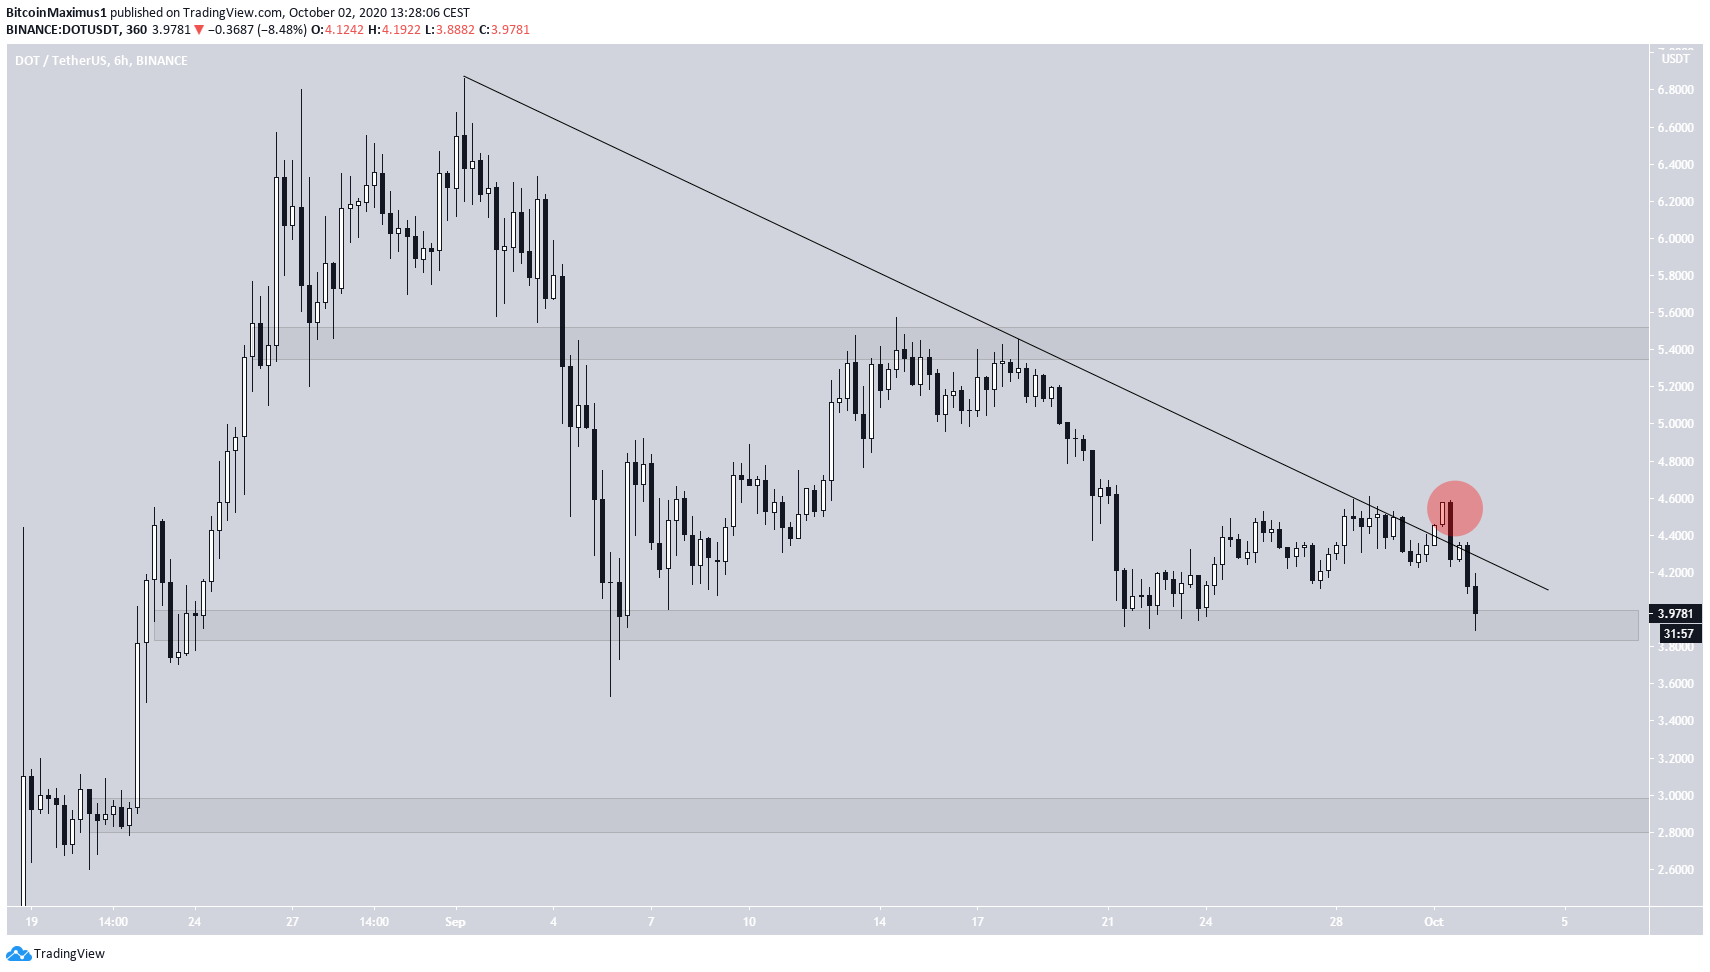
After reaching an all-time high price of $5.85 on Sept 1, DOT began to decline until it reached a low of $3.53 on Sept 5. The price initiated an upward move afterward, but was rejected at the $5.45 area and began to fall once more. This validated the $5.45 area as resistance.
The decline has taken the price to the $3.90 support area, validating it for the fourth time. Each bounce from the area has been weaker, a sign of buyers capitulating.
Furthermore, the price has been following a descending resistance line since the previous Sept. 1 all-time high price. Yesterday, the price faked a breakout above that line and has fallen back since.
This bearish sign suggests that DOT will likely break down from the current support area and head towards the next support at $2.85.
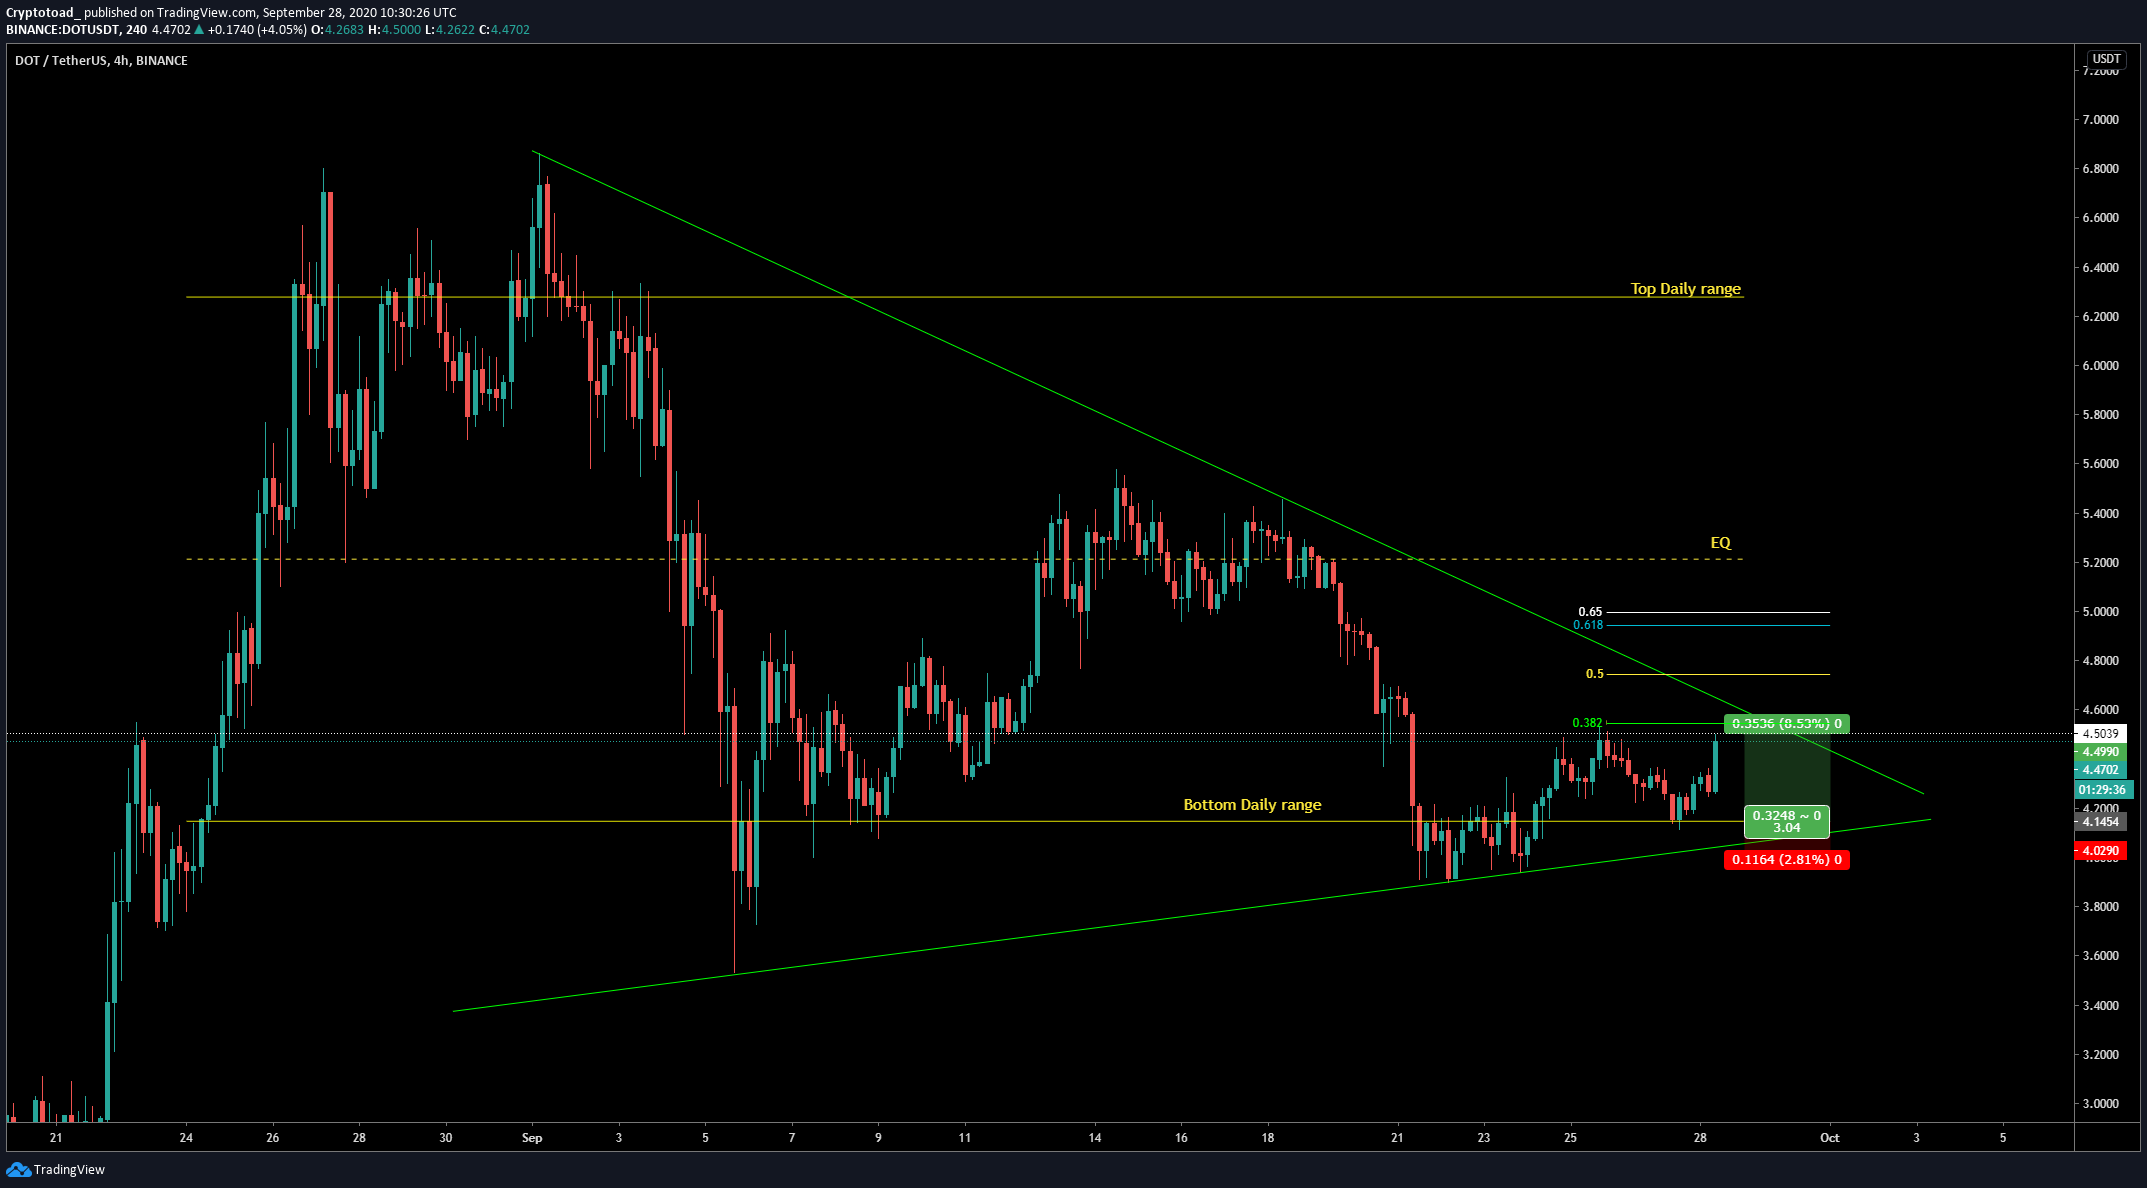
Cryptocurrency trader @mesawine1 outlined a DOT chart, which shows a symmetrical triangle and the price quickly approaching its apex.
Since the tweet, the price has deviated above the resistance line, only to fall back below it and break down afterward. This is a bearish sign that indicates that the price should head lower.
Wave Count
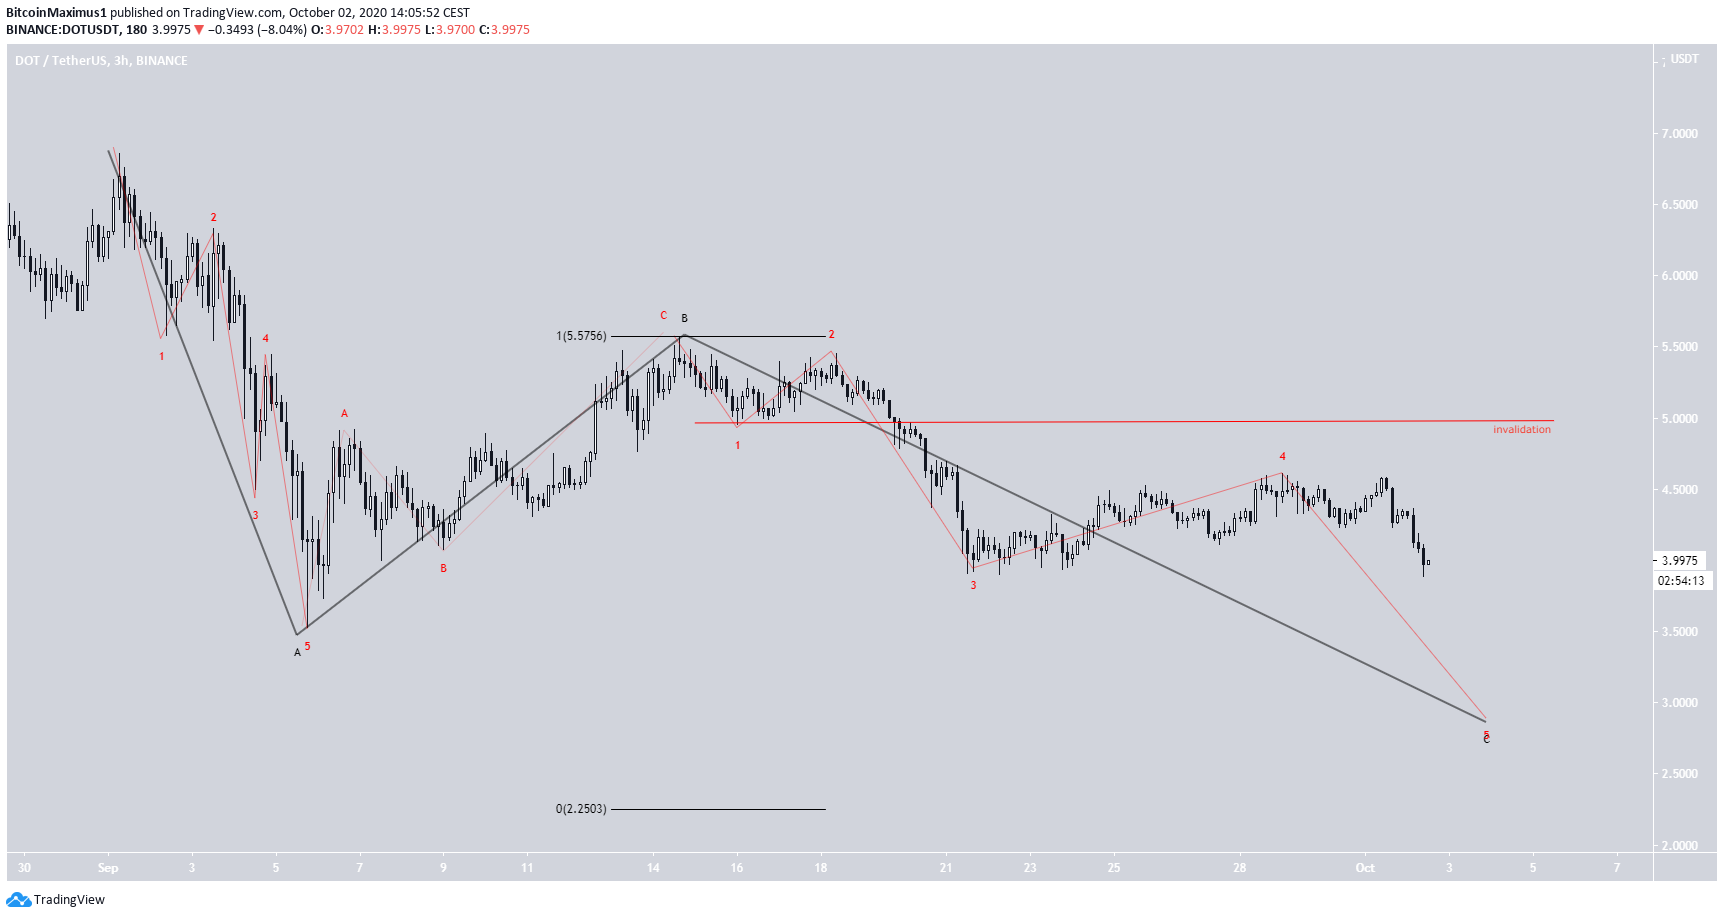
Measuring from the all-time high price on Sept. 21, it seems that the current price has begun an A-B-C corrective formation (shown in black below), currently trading in the C wave.
The sub-wave count is given in red, and it seems that the price has only sub-wave 5 left to complete for the correction.
If the A and C waves have a 1:1 ratio, this will take the price all the way down to $2.25. However, since the price is at the final sub-wave, a smaller fall towards the $2.85 support area seems more likely.
The invalidation of this bearish count would be above the sub-wave 1 low at $4.95 (red line).
To conclude, the DOT price is expected to break down from the current support area and head lower.
For BeInCrypto’s Bitcoin analysis, click here!
Disclaimer: Cryptocurrency trading carries a high level of risk and may not be suitable for all investors. The views expressed in this article do not reflect those of BeInCrypto.


