


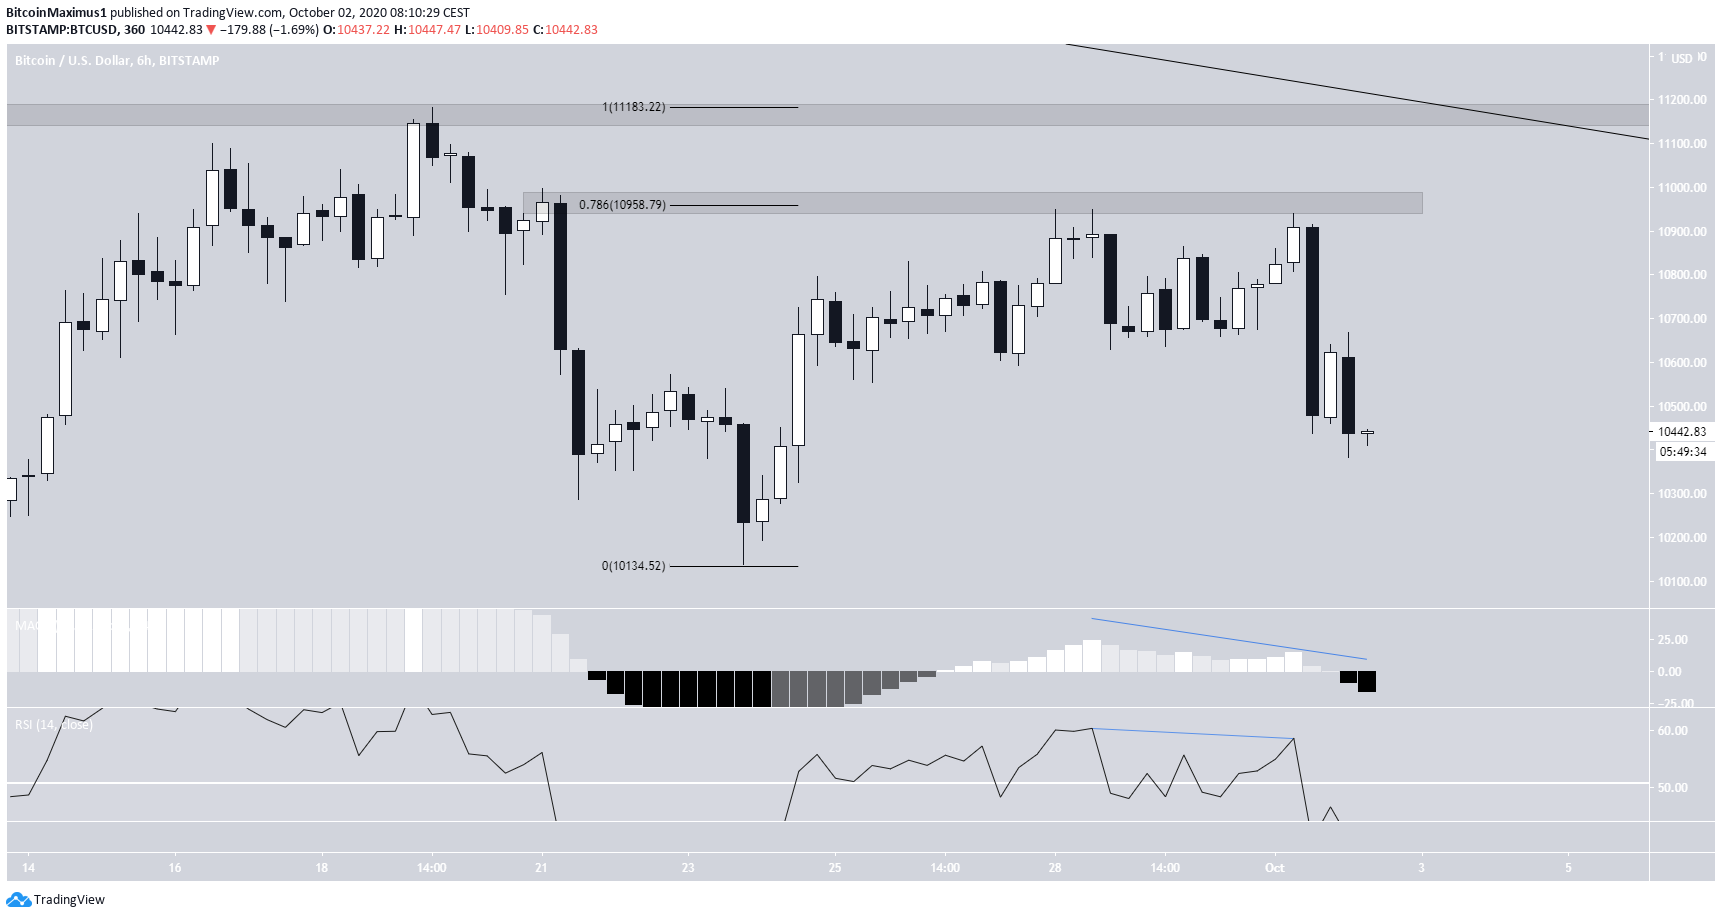
Bitcoin (BTC) was rejected by the $10,900 area and dropped sharply afterward.
It is possible that the price completed its retracement and will soon move upwards.
Bitcoin Rejection And Decrease
On Oct 1, the BTC price reached a high of $10,920, creating a double-top relative to the price on Sept 28. The top was created near the 0.786 Fib level of the previous decrease, making it a likely reversal level.
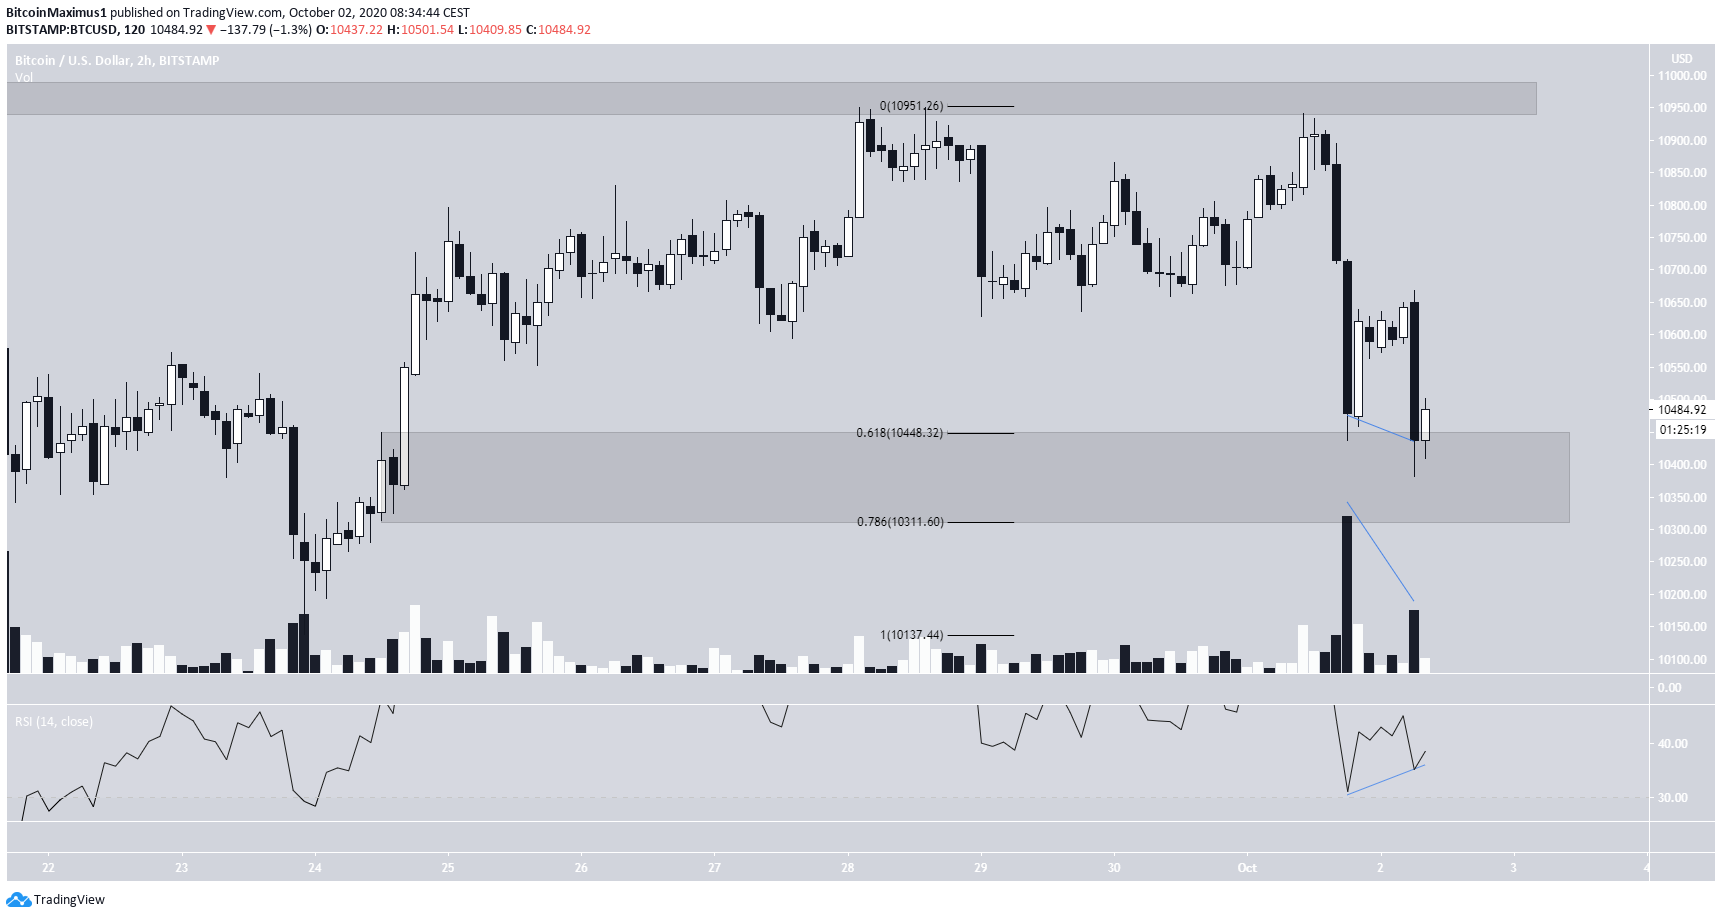
After generating bearish divergence in both the RSI and MACD, the price dropped sharply, reaching a low of $10,385. BTC has since bounced back slightly and is currently trading near $10,440.
The shorter-term 2-hour chart shows that after the decrease, the price reached the 0.618 Fib level of the previous upward movement and is trading between the 0.618-0.786 Fib levels at $10,310-$10,440.
Despite the decrease, there are two bullish signs that have transpired:
- The RSI has generated bullish divergence
- Volume has been considerably lower during the second dip
These are signs that the price may have likely completed its decrease and will soon head upwards.
Wave Count
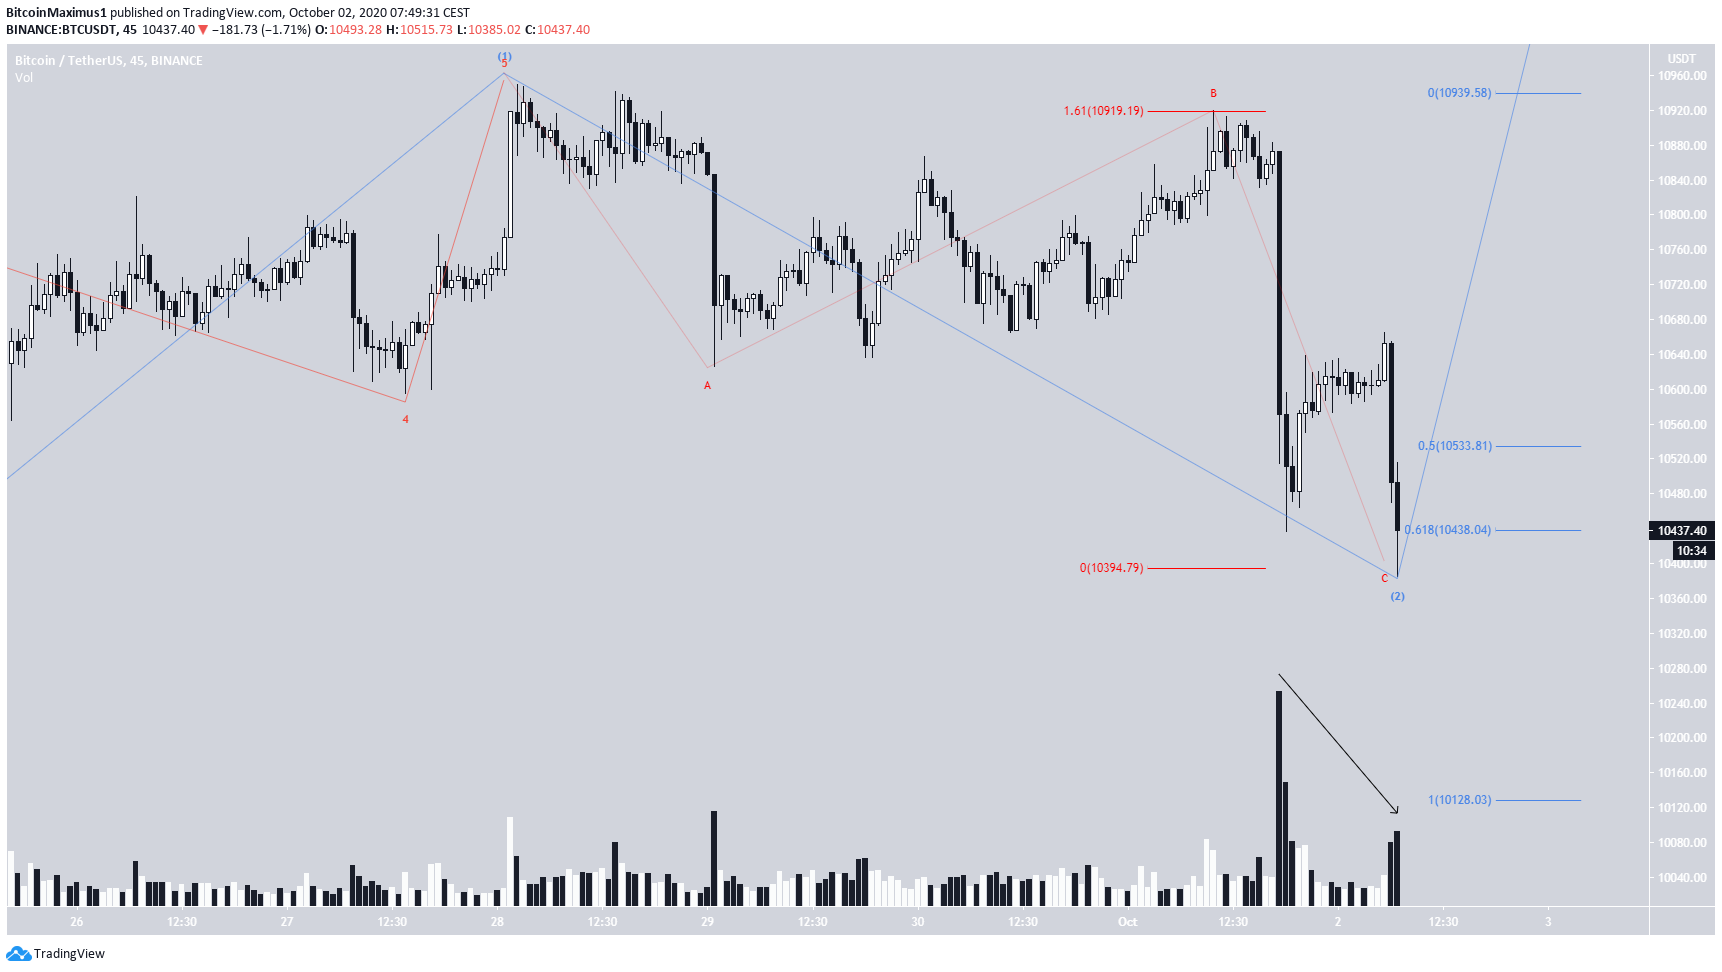
Despite the decrease, the current movement seems more like the ending of a correction rather than the beginning of a new downward trend.
It is possible that the movement was the end of wave 2 (shown in blue below), which transpired inside an A-B-C formation (red). In this particular pattern, the A:C waves had a ratio of 1:1.61, very common in such corrections.
The decreasing volume also supports this possibility. If the wave count is correct, the price will likely soon move upwards.
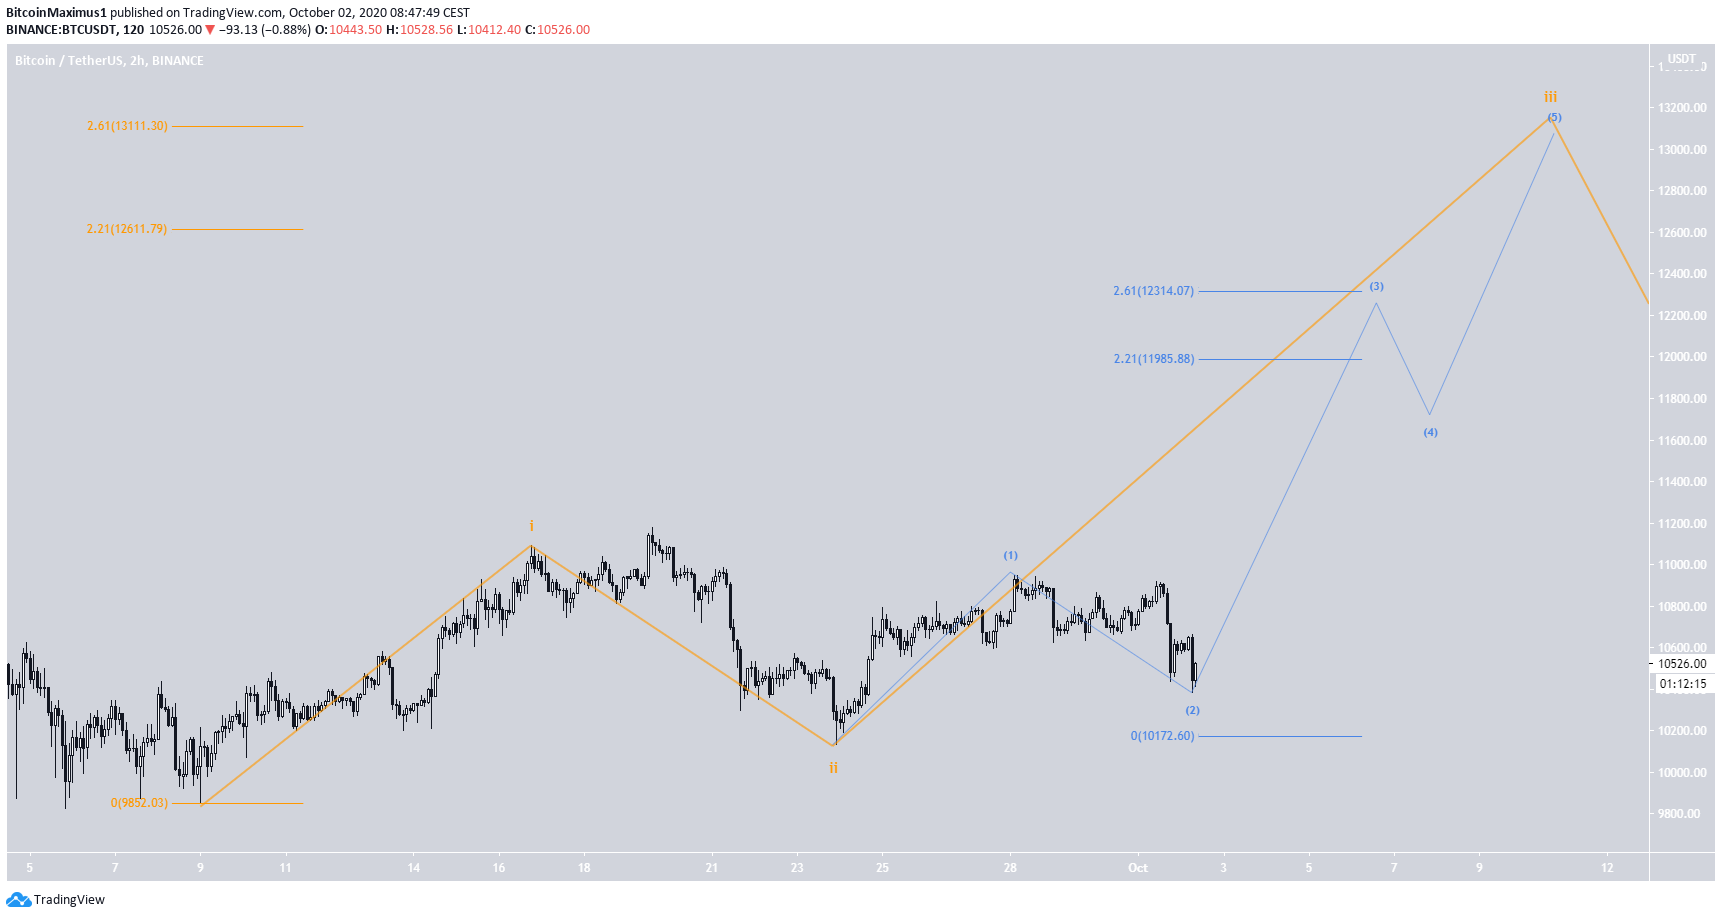
In a longer-term perspective, BTC seems to have begun an impulse on Sept 9 (in orange below). It seems to have already completed waves 1 and 2 and is currently in wave 3.
Inside wave 3, the price has completed sub-waves 1-2 (blue) and should soon begin sub-wave 3, which has a preliminary target between $11,985-$12,314.
For BeInCrypto’s previous Bitcoin analysis, click here!


