


Polkadot (DOT) price is showing bullish reversal signs in both the weekly and daily timeframes.
Kusama (KSM) has fallen to a new yearly low and has yet to break out from a descending resistance line.
DOT Price Reaches Long-Term Support
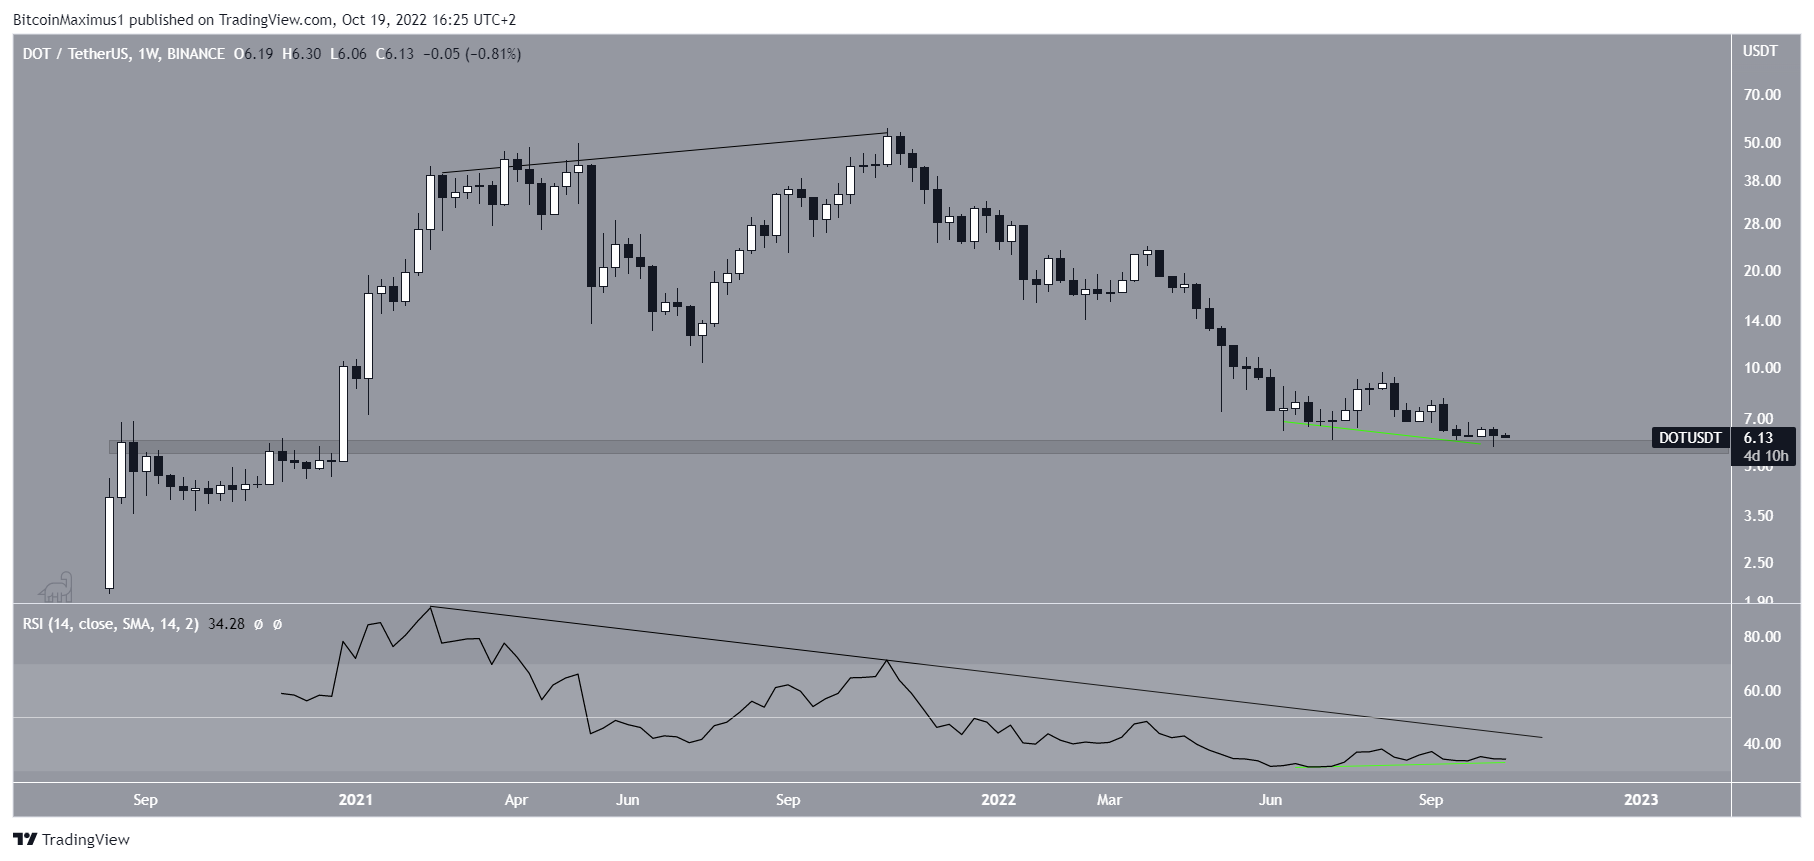
The Polkadot price has been decreasing since reaching an all-time high price of $55.09 in Nov. 2021. The downward movement has so far led to a low of $5.68 in Oct. 2022. The low was made inside the long-term $5.80 horizontal support area, which had previously not been reached since the beginning of 2021.
The weekly RSI movement is leaning towards a bullish outlook. Over the past four months, the indicator has generated a bullish divergence (green line). However, the RSI is still following its descending resistance line and is below 50.
Until it breaks out from the resistance line and then moves above 50, the price prediction for DOT cannot be considered bullish.
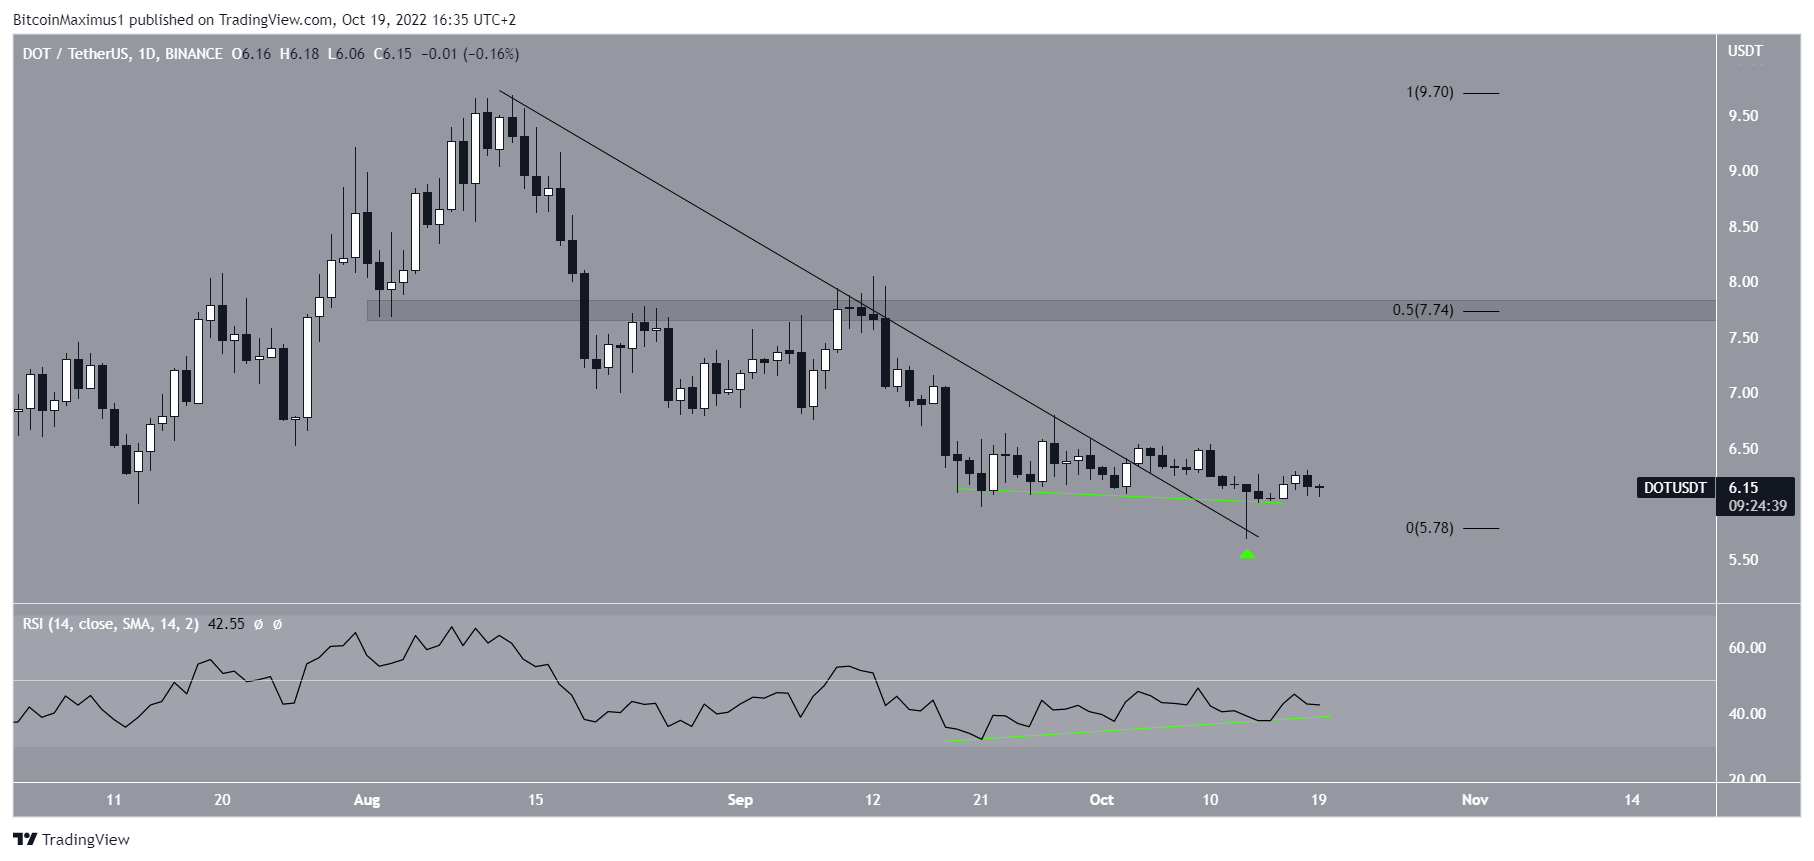
The daily timeframe readings support those from the weekly timeframe. The DOT price has broken out from a descending resistance line and validated it as support afterward, creating a long lower wick in the process (green icon).
In a similar fashion to the weekly timeframe, the daily RSI has also generated a bullish divergence (green line). So, an upward movement is supported by technical analysis readings from both timeframes.
If an upward movement follows, there is short-term resistance at $7.75. This is a horizontal resistance area and the 0.5 Fib retracement resistance level.
This is the final resistance area prior to the Aug. highs at $9.70. As a result, a movement above it could greatly accelerate the rate of increase.
Conversely, a decrease below $5.68 would indicate that the trend is still bearish.
KSM Struggles to Initiate Upward Movement
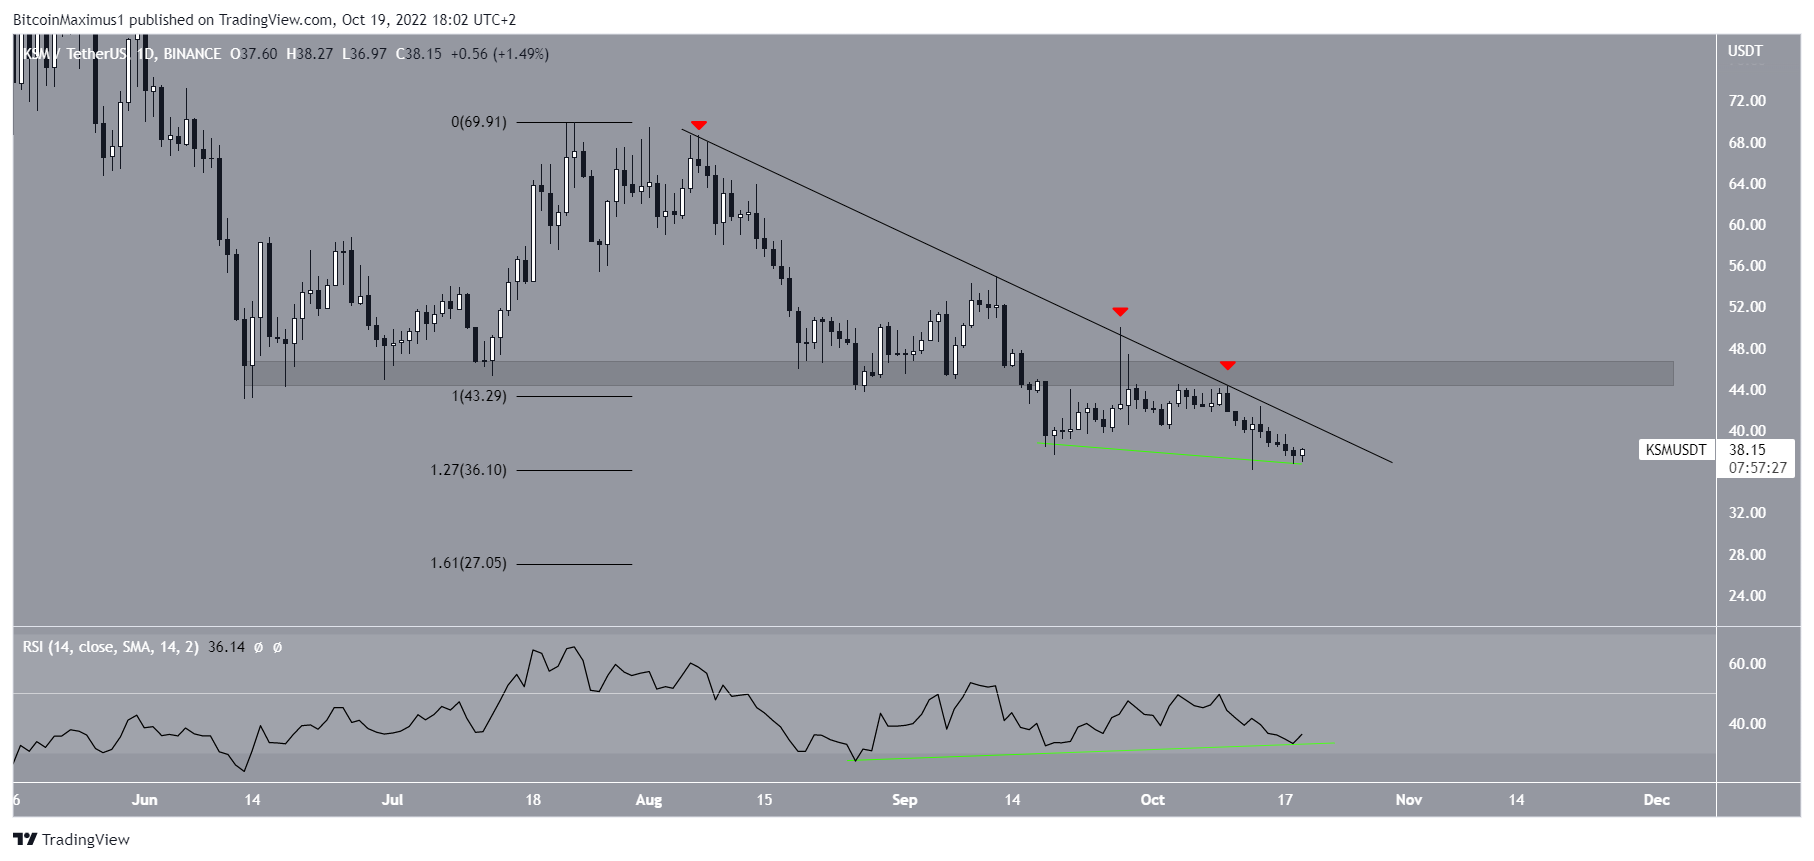
The price chart for KSM does not look nearly as bullish as that for DOT. KSM has been falling underneath a descending resistance line since the beginning of Aug. The line has been validated three times (red icons), most recently on Oct. 10.
While doing so, the KSM price also broke down from the $45.50 area and validated it as resistance afterward.
On the bullish side, the daily RSI has generated a bullish divergence (green line). The divergence occurred at the minor Fib support level of $36.10. However, besides this divergence, there are no other bullish signs in place.
Even if a breakout from the line were to occur, the $45.50 area would now act as strong resistance. Until KSM managed to break out from it, the trend cannot be considered bullish.
If the downward movement continues, the next closest support area would be at $27.05.
For the latest BeInCrypto Bitcoin (BTC) and crypto market analysis, click here
Disclaimer: BeInCrypto strives to provide accurate and up-to-date information, but it will not be responsible for any missing facts or inaccurate information. You comply and understand that you should use any of this information at your own risk. Cryptocurrencies are highly volatile financial assets, so research and make your own financial decisions.


