


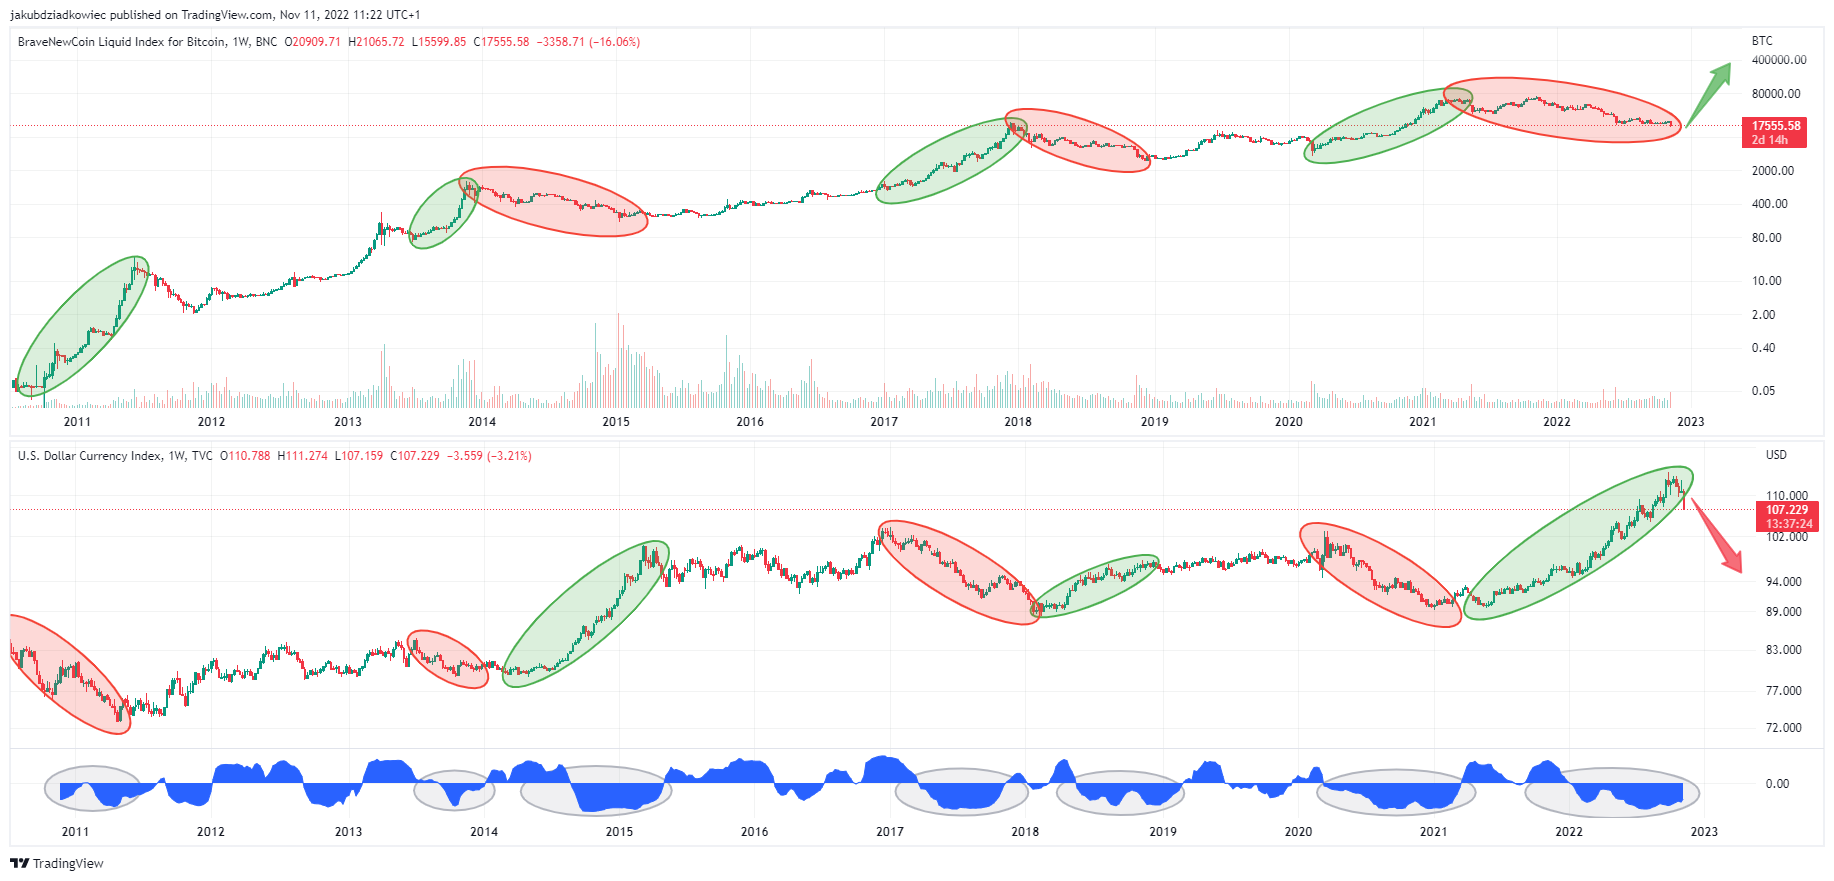
The U.S. dollar index negatively correlates with traditional stocks and the cryptocurrency market. If the DXY has indeed already reached the macro top of this cycle, it is likely that Bitcoin has already recorded or is close to the macro bottom of an ongoing bear market.
The latest economic data from the United States shows that inflation in October 2022 fell more sharply than expected. This gives hope for U.S. consumers and is good news for the Federal Reserve (Fed), which has been trying to lower the Consumer Price Index (CPI) for months.
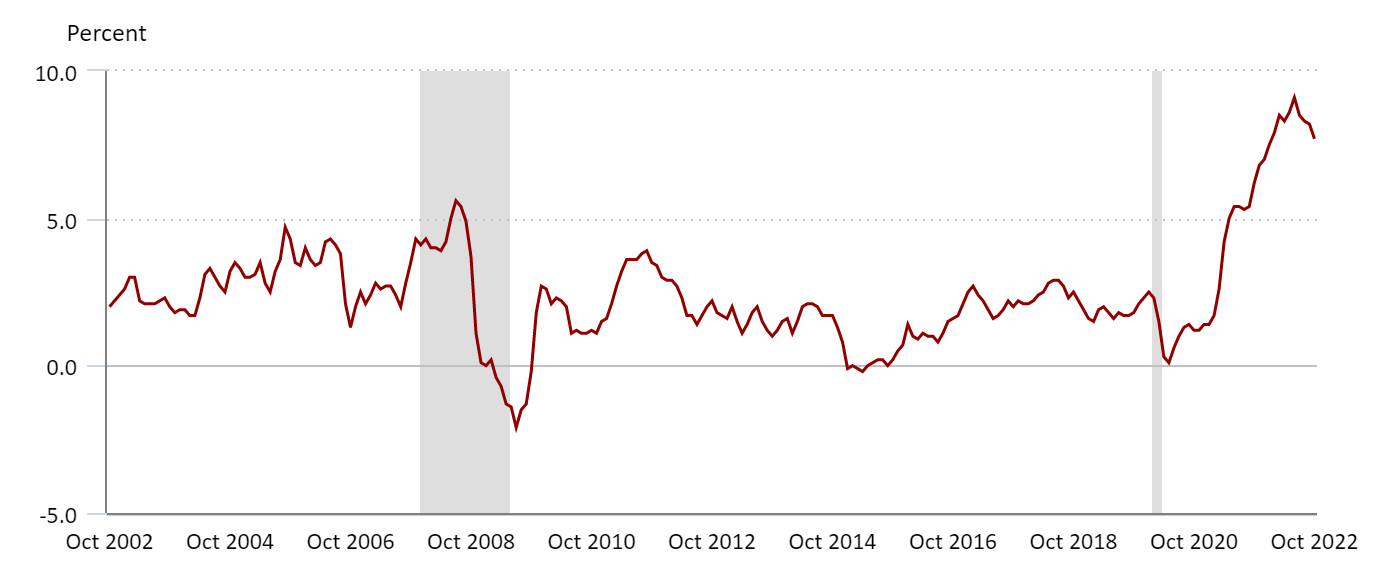
The U.S. CPI came in at 7.7% in October. This is 0.2% lower than the analysts’ consensus expectation of 7.9%. Moreover, it is significantly lower than the September 2022 inflation rate of 8.2%.On the long-term chart, we can see that the likely peak of inflation in the U.S. was in June 2022, when the CPI was 9.1%. It has been falling ever since, and it is possible that this trend will continue.
Declining inflation also gives hope that Fed officials will now raise interest rates less aggressively, as their strategy seems to be paying off. At their last meeting, they raised interest rates by 75 basis points, which was in line with analysts’ expectations.
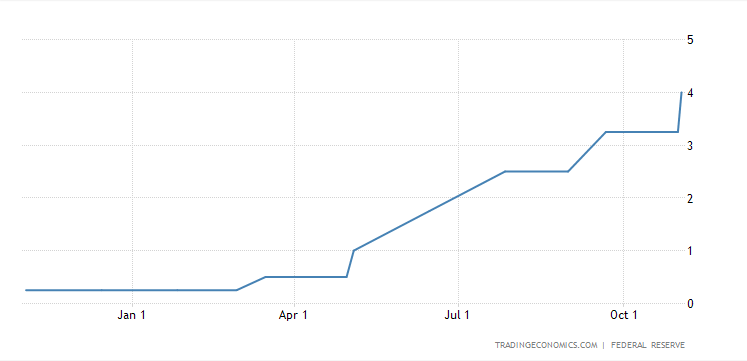
The base interest rate in the U.S. is currently at 4%, the highest level since 2008. Therefore, its increases are now expected to be less aggressive. What’s more, this should bring relief to stock markets and other risk-on assets, including cryptocurrencies.
The US dollar index parabola breaks down
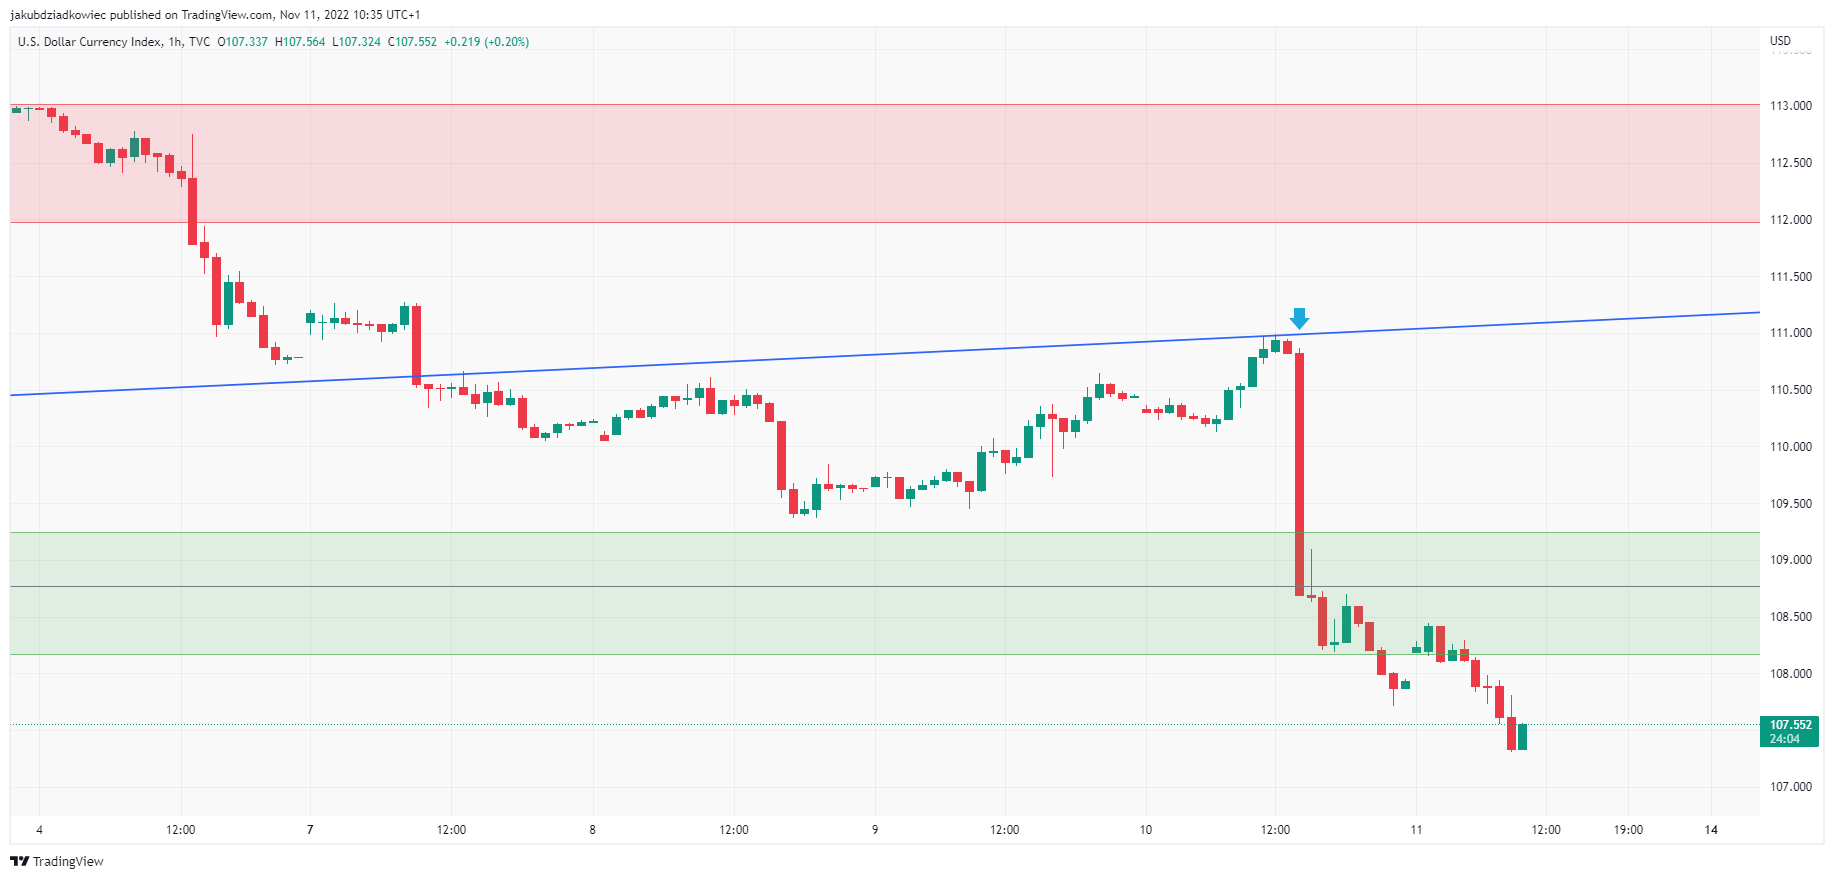
Shortly after the release of U.S. inflation data for October, the U.S. dollar index saw a sharp decline. The DXY lost almost 2% within an hour (blue arrow), falling to a support area in the 108-109 range (green).
In the following hours, this area was not held, and the U.S. dollar index continued its decline today, with the current low at 107.3, a level not seen since August 2022.
On the daily chart, we see that the U.S. dollar index may have just broken down from a long-term support line (blue). This parabolic curve was in effect from January 2021 and had a low of 89.2. Together with the slightly higher low at 89.7 reached in May 2021, the DXY generated a bullish double-bottom pattern (green arrows), which led to a 1.5-year-long bull market for the U.S. currency.
The first signs of a bearish reversal appeared even before the late September peak at 114.8. DXY began generating bearish divergences on the daily and weekly RSI.
Subsequently, the chart generated a series of 2 lower highs (LH) and 2 lower lows (LL). Currently, we see a clear breakdown from the parabola. With yesterday’s U.S. inflation data, its bearish validation and sharp rejection took place.
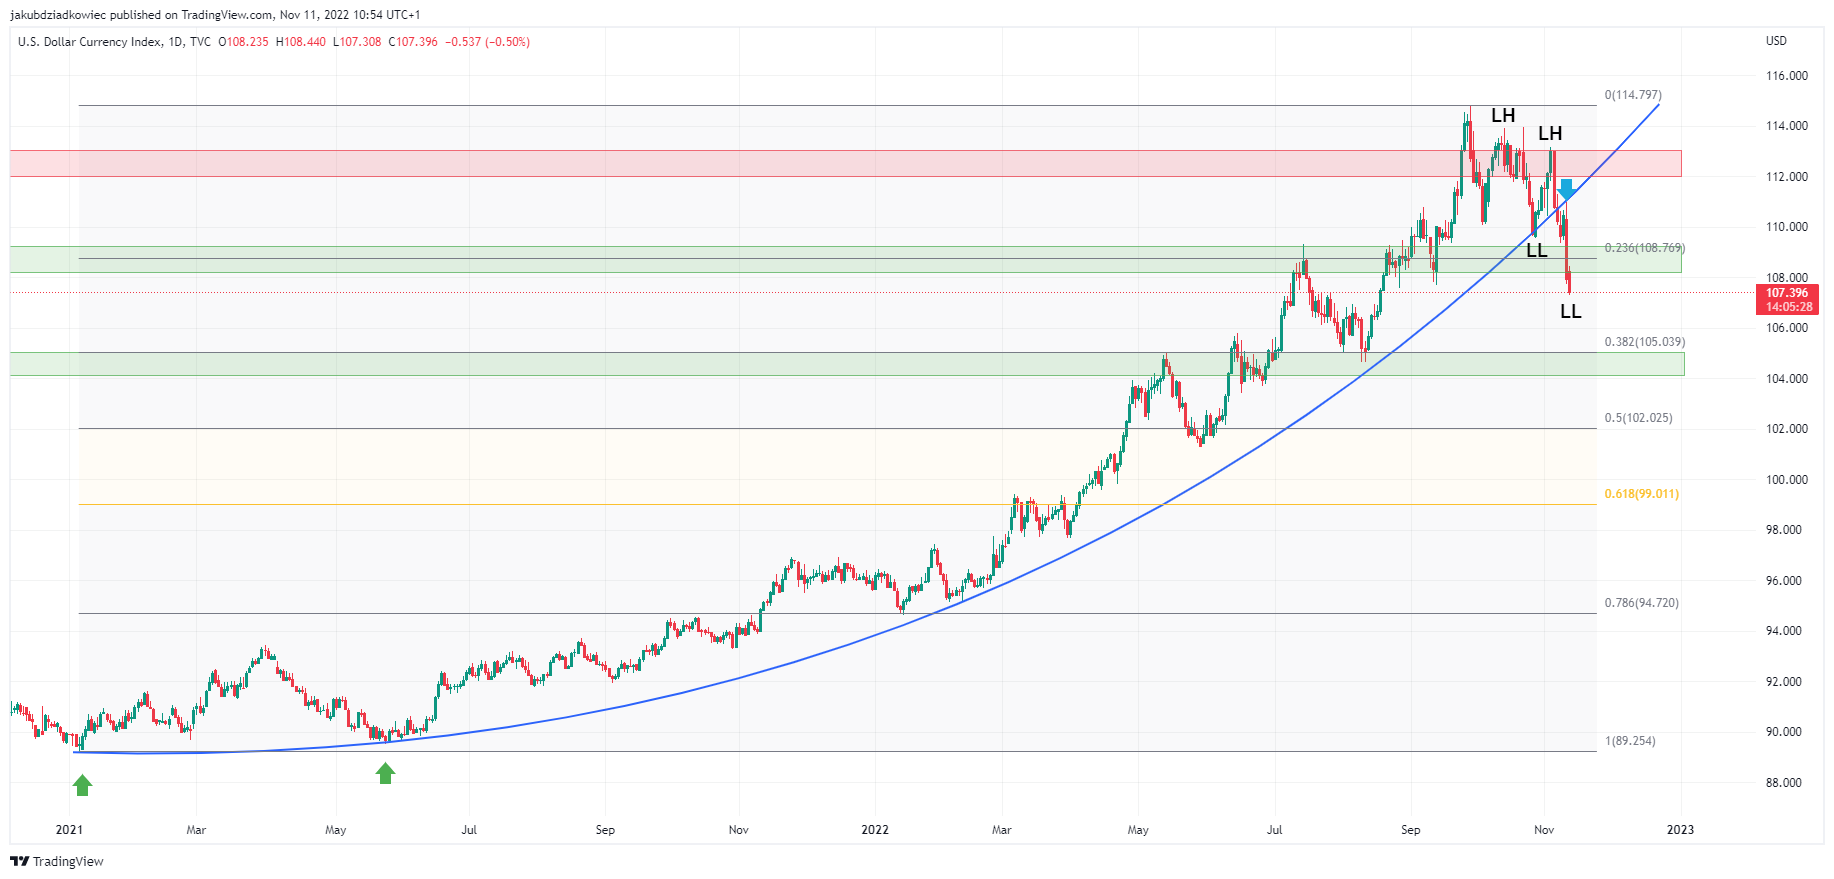
The next areas of support for the DXY are the 104-105 range at the 0.382 Fib retracement and the 102 level at the 0.5 Fib retracement. A bounce at the former level could mean that the ongoing decline is just a correction. The U.S. dollar index will then likely rebound and form an even larger upward parabola. On the other hand, the loss of this area could mean the end of the upward cycle of the U.S. currency and a macro change in the global economic situation.
The same view is held by well-known trader and market analyst Bob Loukas, who presented his analysis of the U.S. dollar index in a tweet published yesterday.
He stated: “Looks like $USD has topped. Clean Cycle progression lower now. When near parabolic trends break like this, generally signals a major top.”
Bitcoin bounces back due to a negative correlation with DXY
Traditional markets and cryptocurrencies reacted very positively yesterday to the decline in the DXY. The SPX increased by 5.54%, while the NASDAQ gained 7.72%. Thus, both indexes closed at their highest since the second half of September 2022.
Major cryptocurrencies also saw big gains yesterday. Bitcoin surged 10.54% to regain the $17,000 level, Ethereum increased 17.82%, and Binance Coin 13.81%. So there is a clear correlation between the decline in inflation and the U.S. dollar index and the recovery in risk-on asset markets.
Bitcoin has a long-term negative correlation with the dollar index. There is an ongoing debate as to how much of this makes it a hedge against inflation.
If the U.S. dollar index has indeed peaked in the current cycle, it is possible that Bitcoin is close to generating – or has already done so at $15,588 – a macro bottom. However, if the DXY rebounds and resumes its post-correction rally, the cryptocurrency market — plagued by its own problems like the recent collapse of FTX — and BTC could face much lower prices.
For BeInCrypto’s latest Bitcoin (BTC) analysis, click here.


