


The Dogecoin (DOGE) price reached a new yearly high on Jan. 22. However, the wave count suggests that the initial portion of the upward movement is complete.
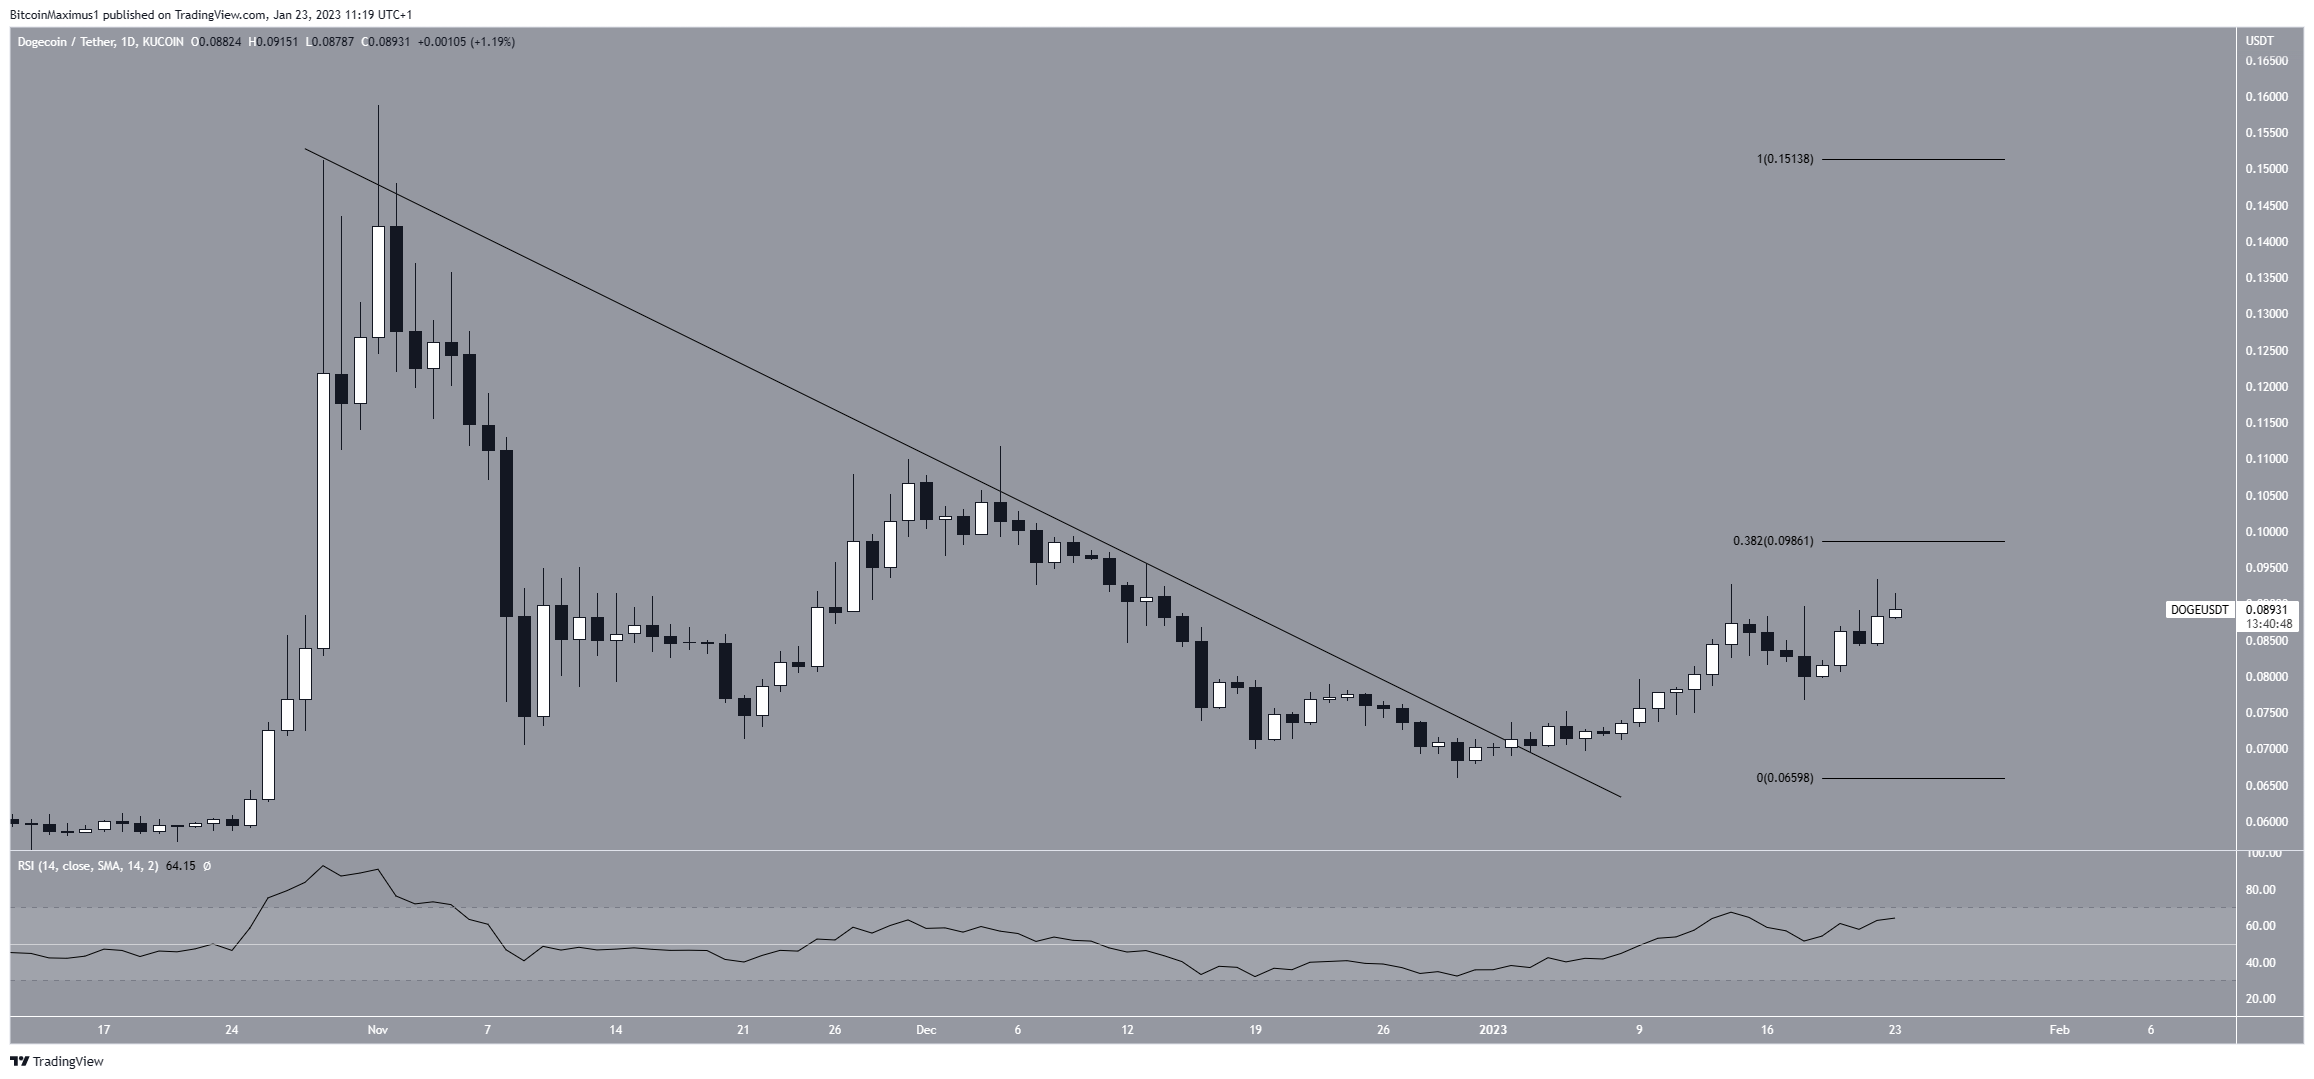
The Dogecoin price has increased since Dec. 30. It broke out from a descending resistance line on Jan. 2. Previously, the line had been in place since the beginning of Nov. 2021. As a result, the breakout from it can lead to a sustained rally. Furthermore, the breakout was combined with a daily RSI movement above 50, another sign of a bullish trend.
The DOGE price reached similar highs on Jan. 14 and 22, but the latter was the highest price. If the upward movement continues, the closest resistance would be at an average price $0.098, which is the 0.382 Fib retracement resistance level of the entire downward trend.
Dogecoin Price Prediction for Feb: New Highs Are Eventually Likely
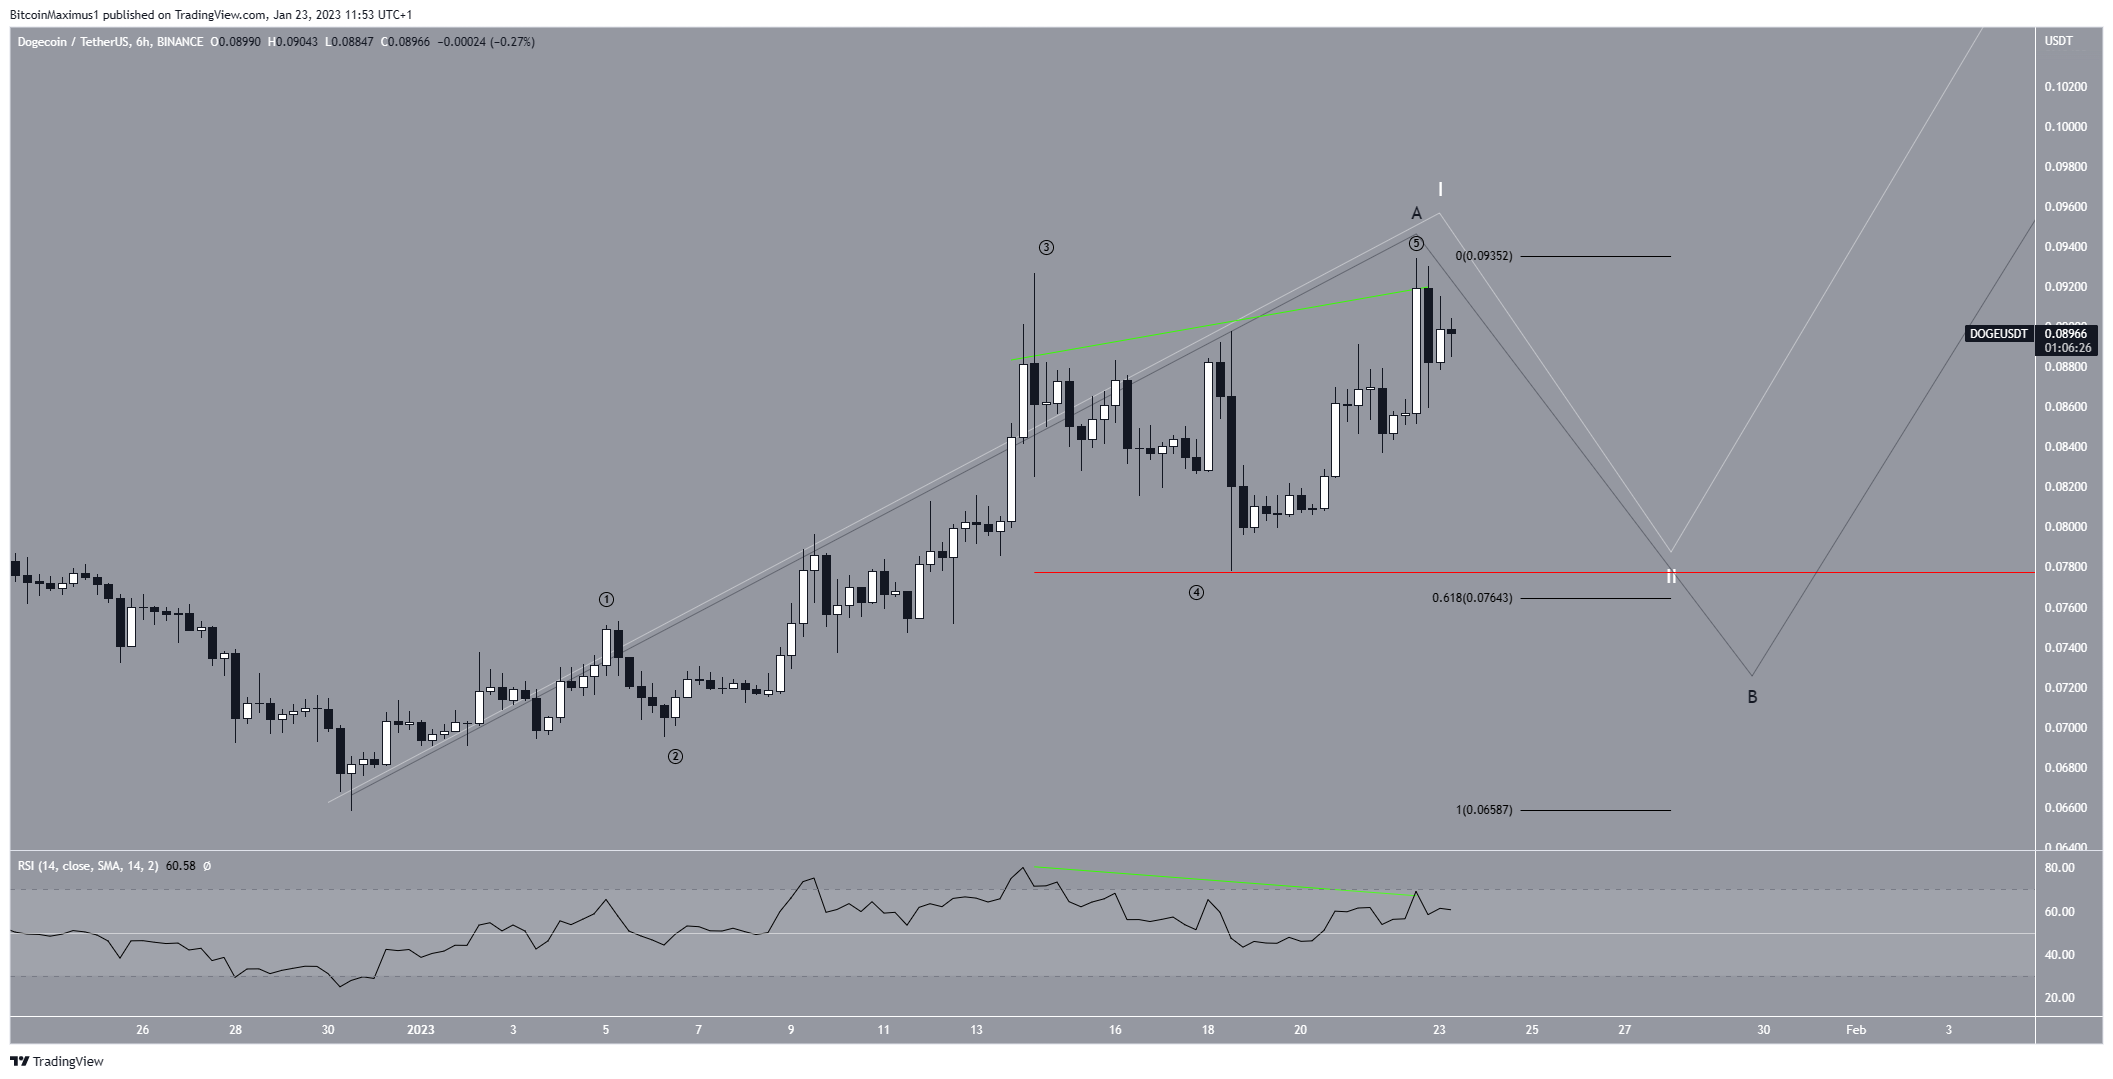
The technical analysis from the six-hour time frame gives a more bearish outlook. The wave count suggests that the Dogecoin price has completed a five-wave upward movement (black). Besides the wave count, the RSI’s bearish divergence (green line) over the past 24 hours supports this outlook. However, it is not certain if this move is wave one of a longer-term five-wave upward movement (white) or if it is wave A of an A-B-C correction instead (black).
The sharpness of the ensuing decrease will go a long way in confirming which is the correct count.
A decrease below the bottom of sub-wave four (red line) and 0.618 Fib retracement support level at an average of $0.077 would go a long way in indicating that the movement was wave A (black). On the other hand, a bounce before these levels would support the more bullish outline of a larger five-wave upward movement (white). This would give a bullish Dogecoin price prediction for Feb.
An increase above the Jan. 22 high of $0.093 would mean that the upward movement will continue without a retracement at all, while a drop below the Dec. 30 lows of $0.066 would invalidate the bullish DOGE price analysis altogether.
To conclude, the most likely Dogecoin price prediction for Feb. is an initial retracement followed by an upward movement. An increase above $0.093 would mean that the retracement is complete, while a drop below $0.063 would mean that the trend is still bearish.
The former would likely lead to highs near $0.111 while the latter could send the DOGE price in a plunge toward $0.057, the lowest price this year.
For BeInCrypto’s latest crypto market analysis, click here.
