

Dogecoin (DOGE) is in the process of breaking out from a long-term bullish pattern, which would confirm that a bullish trend reversal has begun.
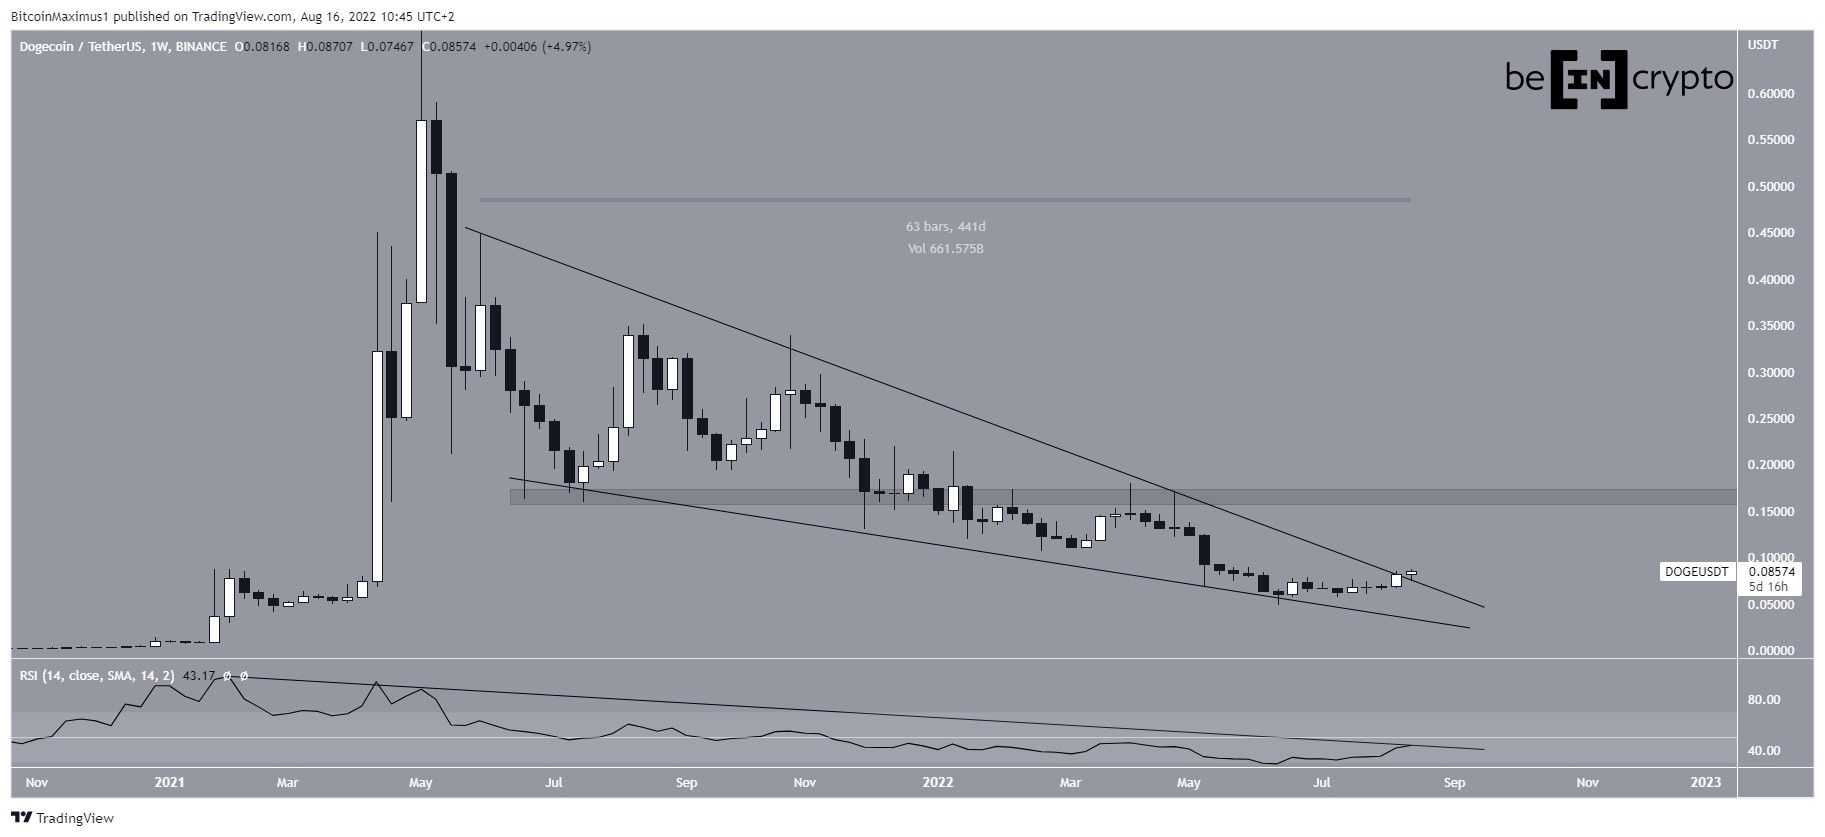
DOGE has been decreasing since reaching an all-time high price of $0.74 in May 2021. The downward movement has so far led to a low of $0.049 in June.
Over the past 441 days, the decrease has been contained inside a descending wedge, which is considered a bullish pattern. Currently, Dogecoin is making an attempt at breaking out from this wedge. If successful, the next closest resistance area would be at $0.165.
Interestingly, the weekly RSI is also in the process of breaking out from its descending resistance line. If it is successful in doing so and then reclaims the 50 line, it would confirm that a bullish reversal has begun.
Ongoing DOGE breakout
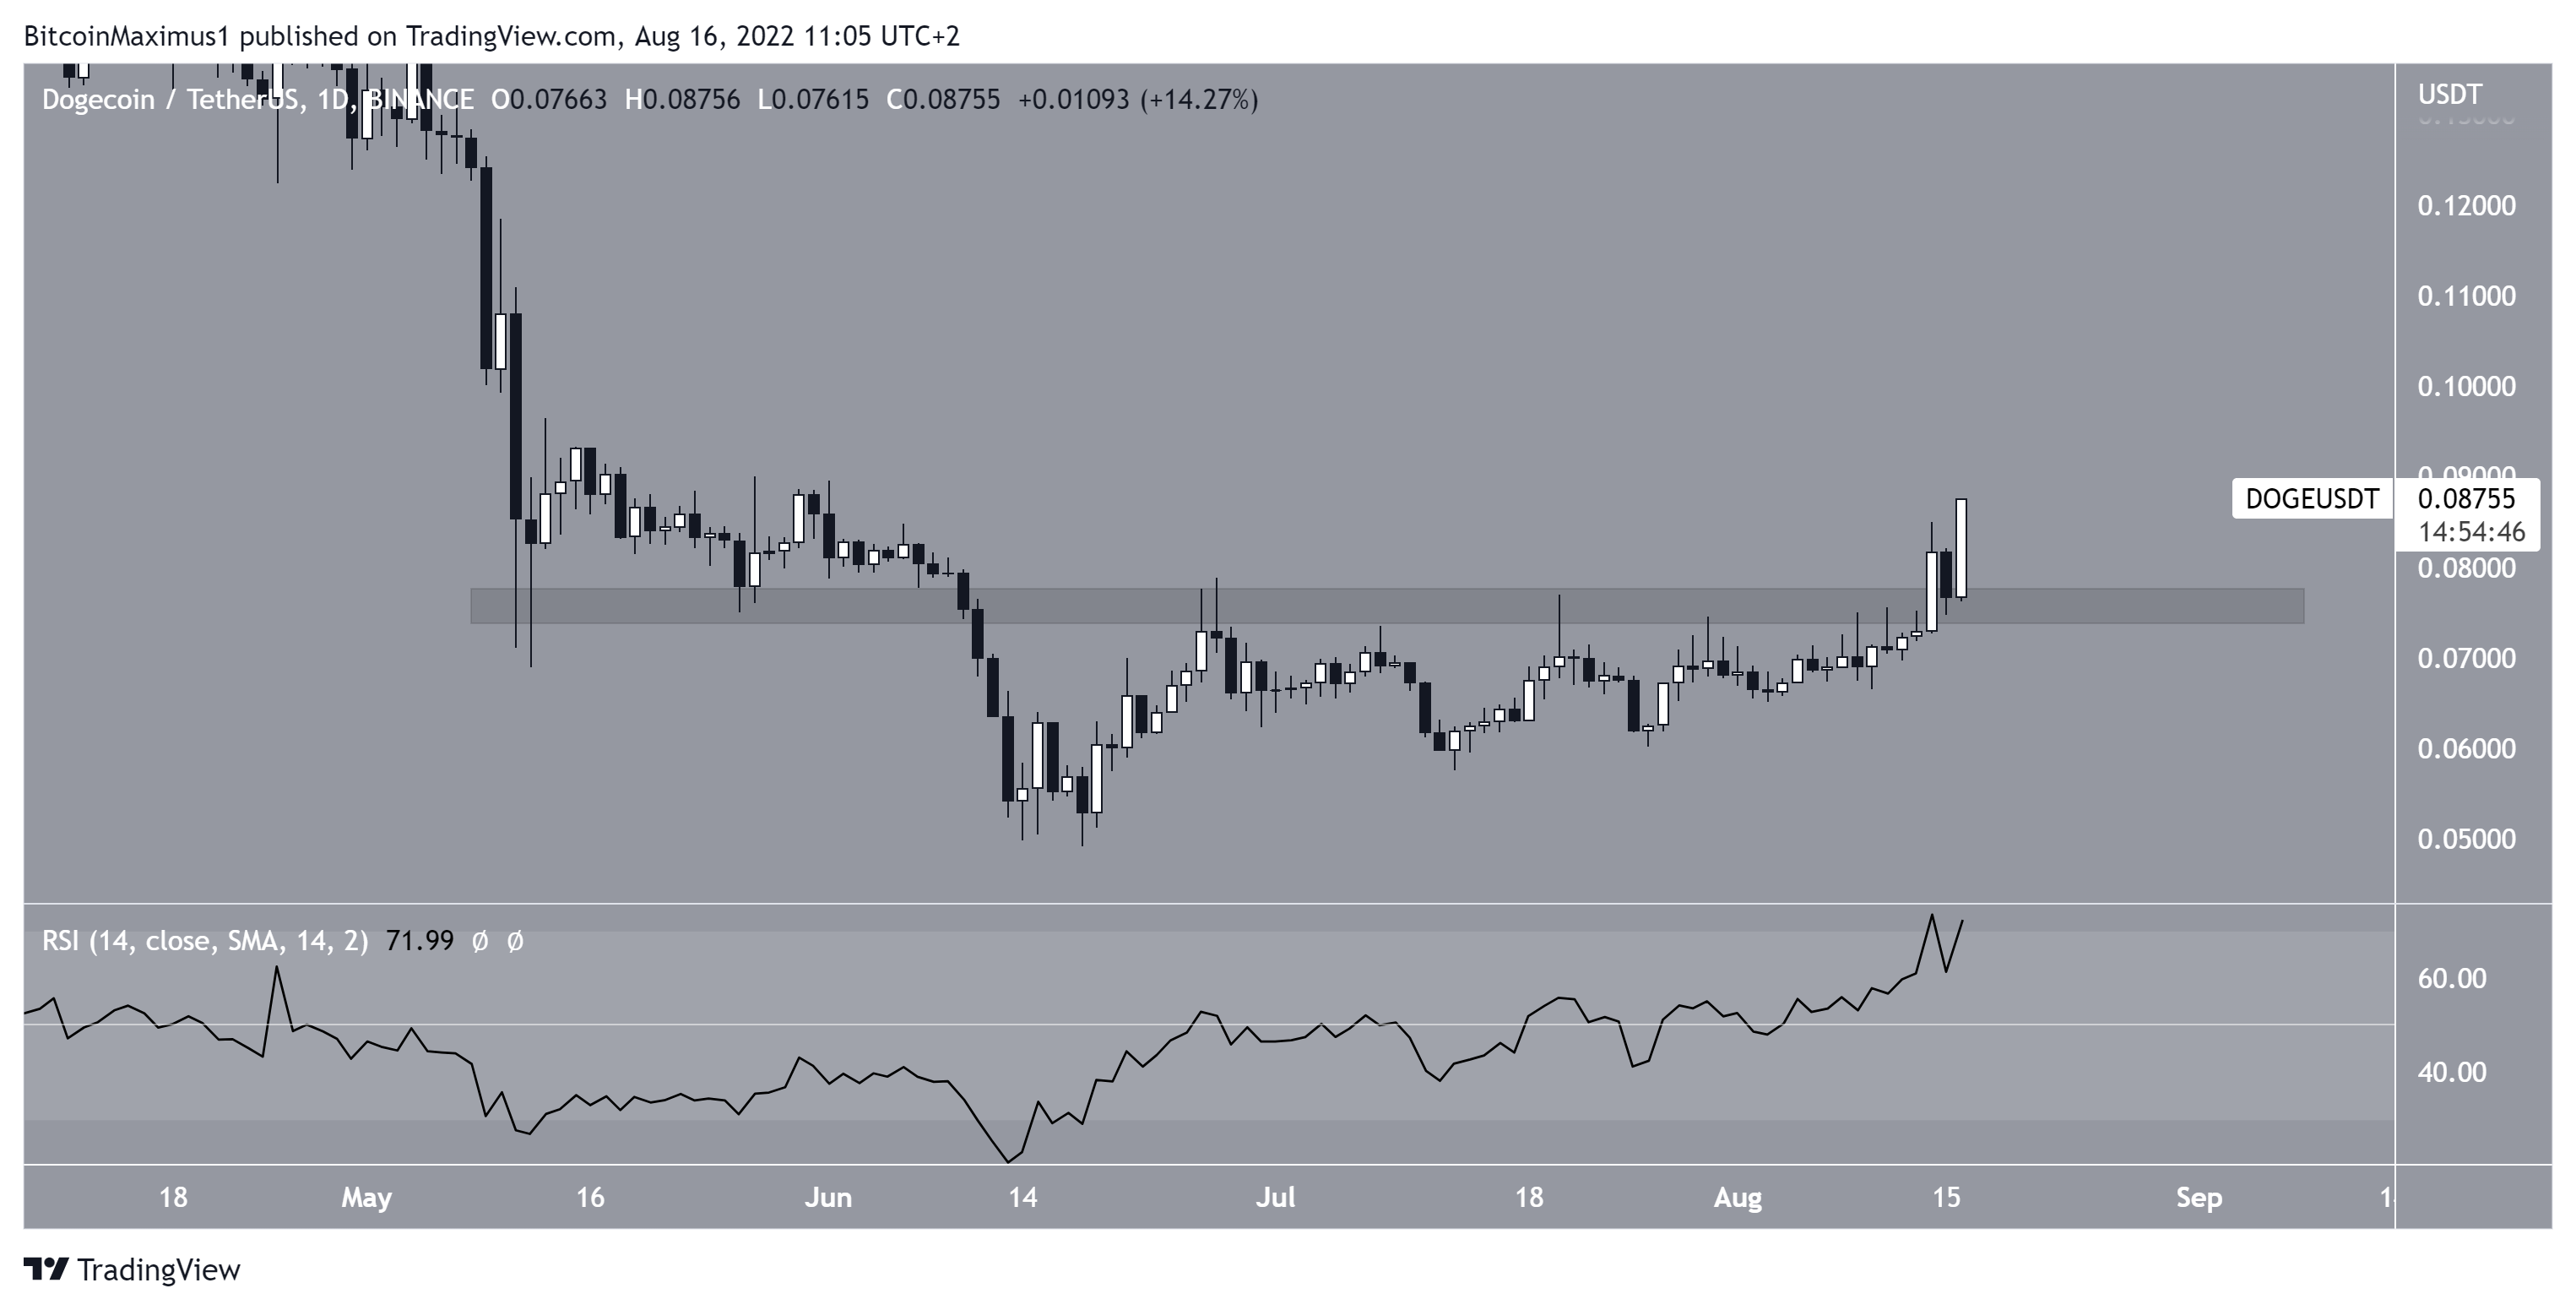
The daily chart supports the readings from the weekly time frame. It shows that Dogecoin has broken out from the $0.077 resistance area on Aug 14 and validated it as support the next day.
Moreover, the daily RSI has decisively broken out above 50. So, it suggests that the price is also likely to break out from the long-term wedge.
Wave count analysis
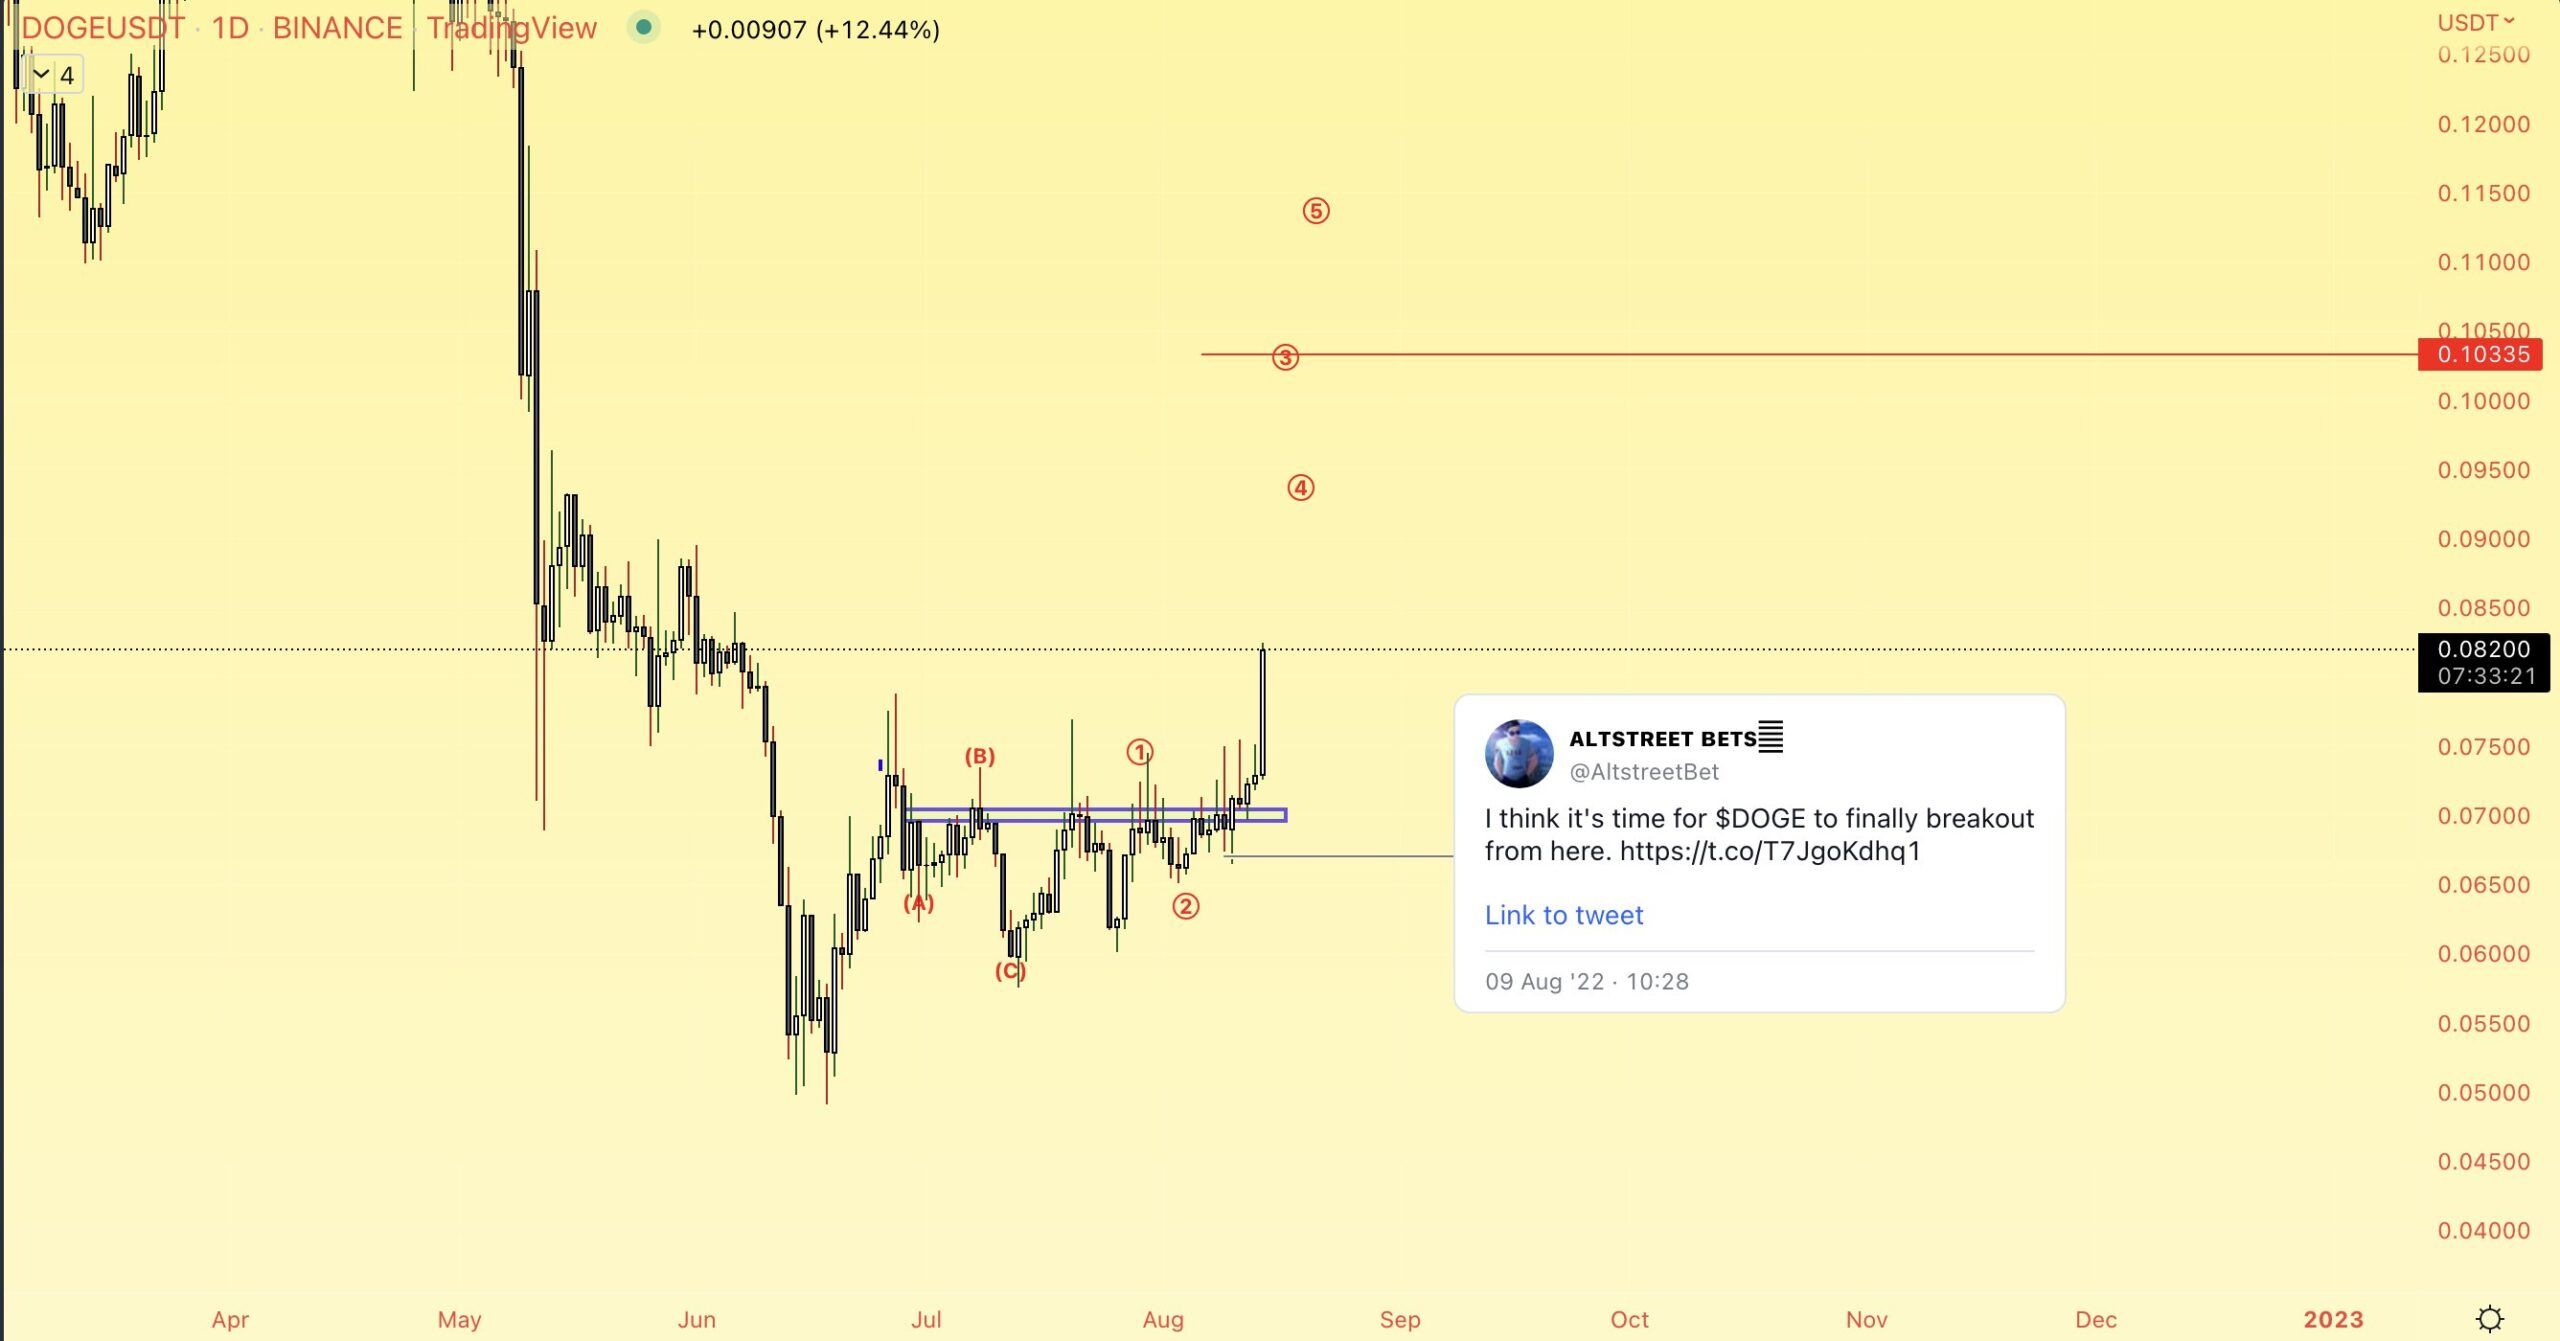
Cryptocurrency trader @Altstreetbet tweeted a chart of DOGE, stating that the price has begun a long-term wave three.
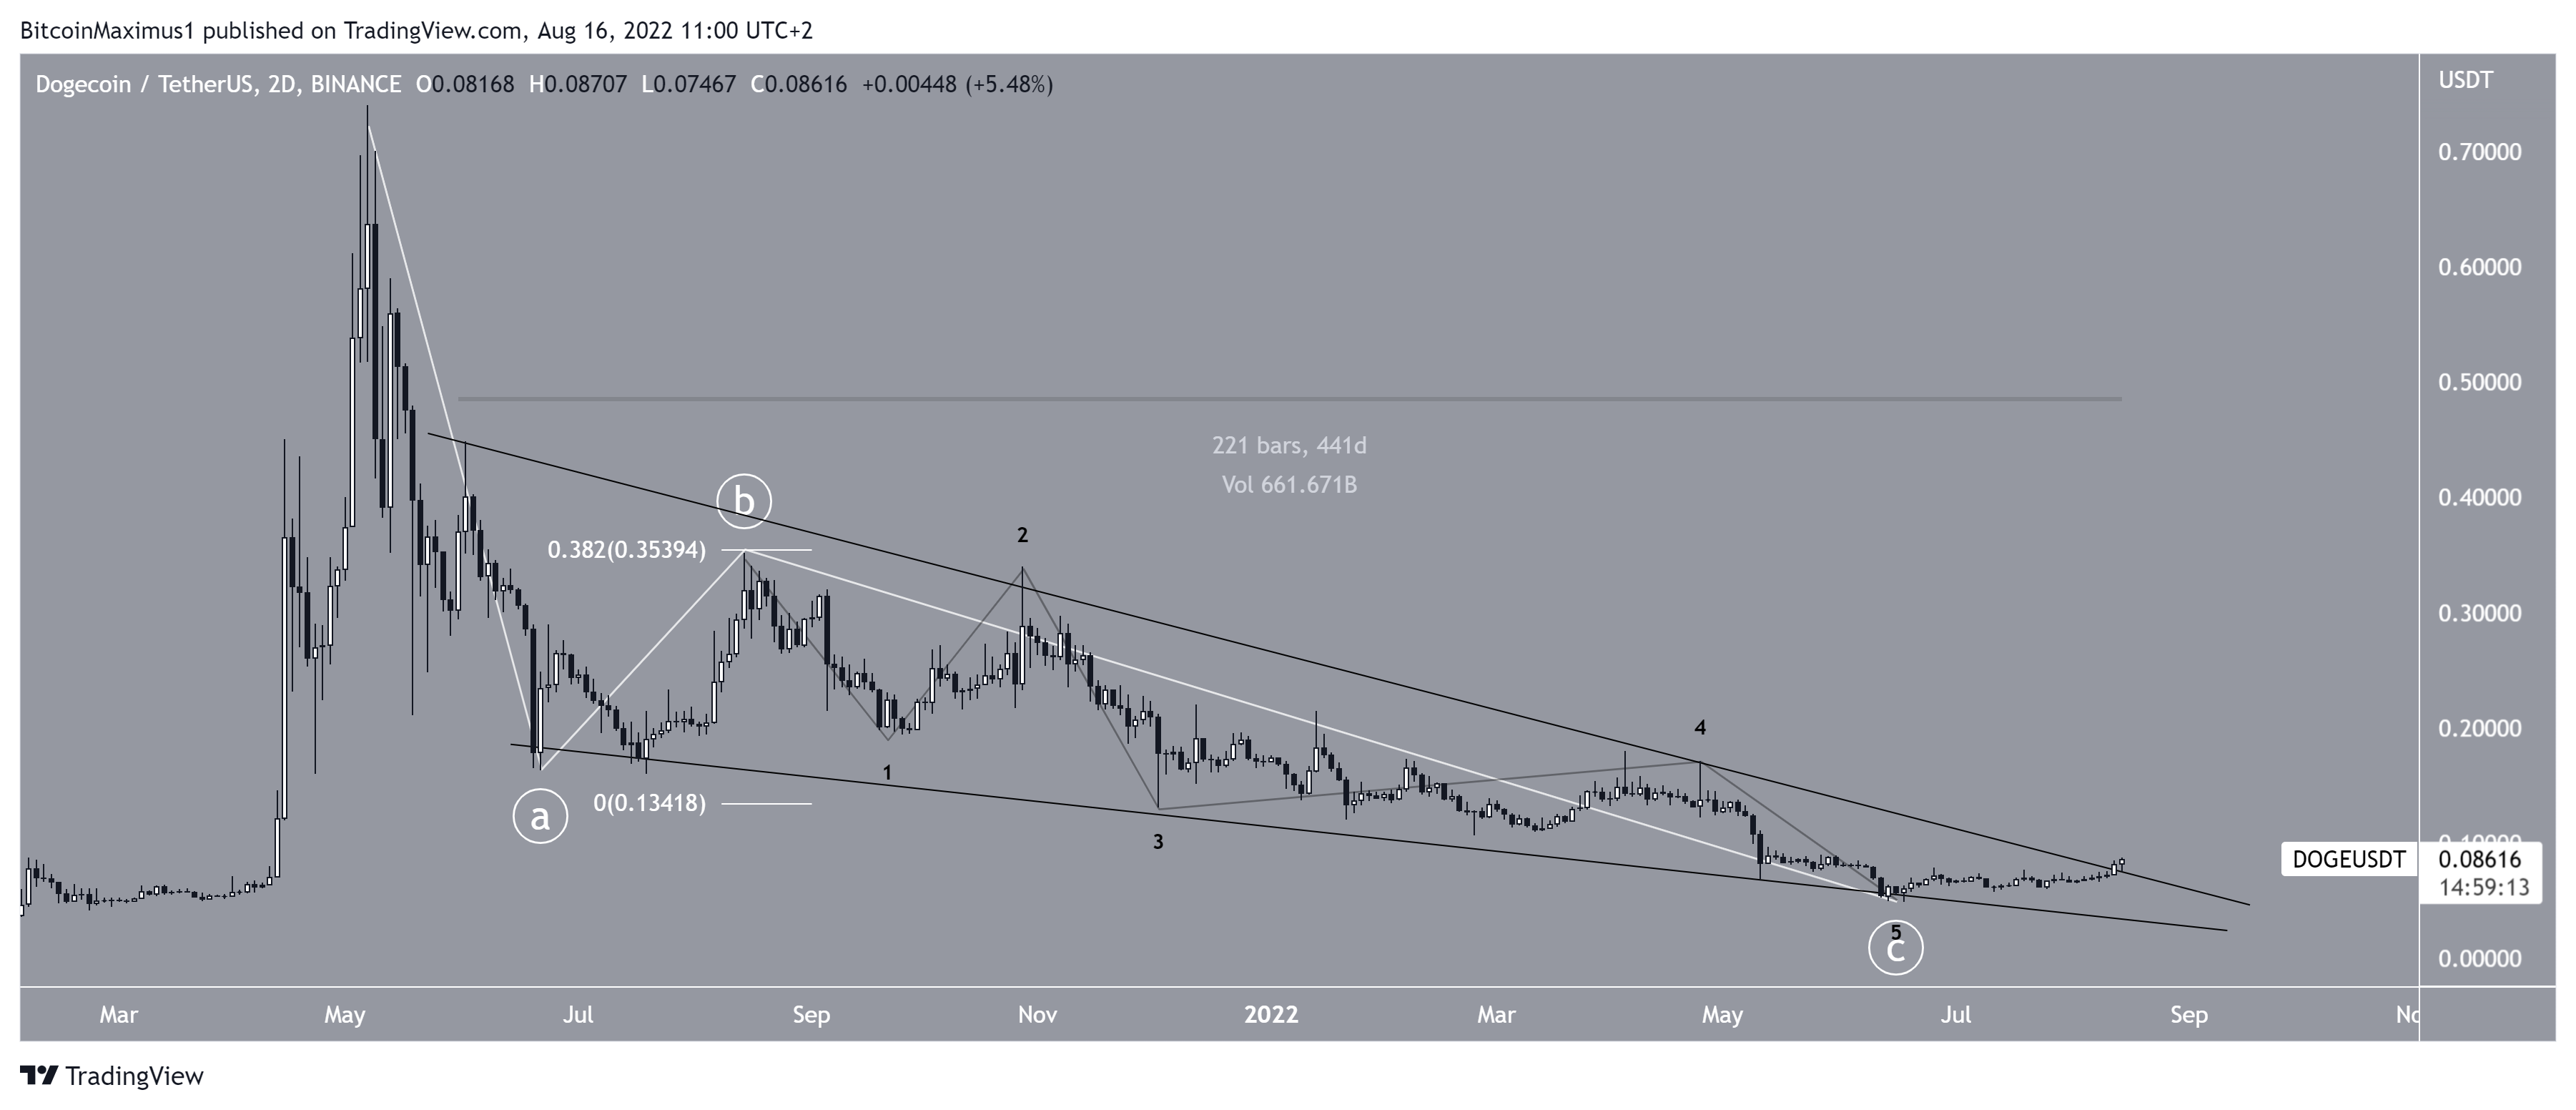
The most likely long-term count suggests that DOGE has completed an A-B-C corrective structure measuring from the all-time high. In it, the C wave developed into an ending diagonal, hence the shape of the descending wedge.
The sub-wave count is given in black.
As for the short-term count, the most likely scenario suggests that Dogecoin is in wave three of a five-wave upward movement. The sub-wave count is given in yellow, also suggesting that the price is in sub-wave three.
Therefore, if the count is correct, the rate of increase would be expected to accelerate soon.

For Be[in]Crypto’s latest Bitcoin (BTC) analysis, click here
Disclaimer
In line with the Trust Project guidelines, this price analysis article is for informational purposes only and should not be considered financial or investment advice. BeInCrypto is committed to accurate, unbiased reporting, but market conditions are subject to change without notice. Always conduct your own research and consult with a professional before making any financial decisions. Please note that our Terms and Conditions, Privacy Policy, and Disclaimers have been updated.
